Charting the Markets: S&P 500 Edges Closer to New Highs
September is supposed to be a bad month for traders. But, there's a catch.
You've reached your free article limit
You've read 0 of 1 free Pro articles.
Stocks finished the week near their highs, and August turned out a strong month. After the deep drop at the start of the month, that end result was a surprise.
But August is notoriously known as a volatile month and it certainly lived up to that standard.
After the market took a dive spurred by the unwinding of a "yen carry trade" (remember that?) it returned course. The focus also returned to what was truly meaningful: the Fed, monetary policy, earnings, interest rates and the economy. All of these trump the short-term gyrations that pop up here and there. That's why we take a long-term approach with our investing thesis, so let's examine a chart of the S&P 500, for a technical look.
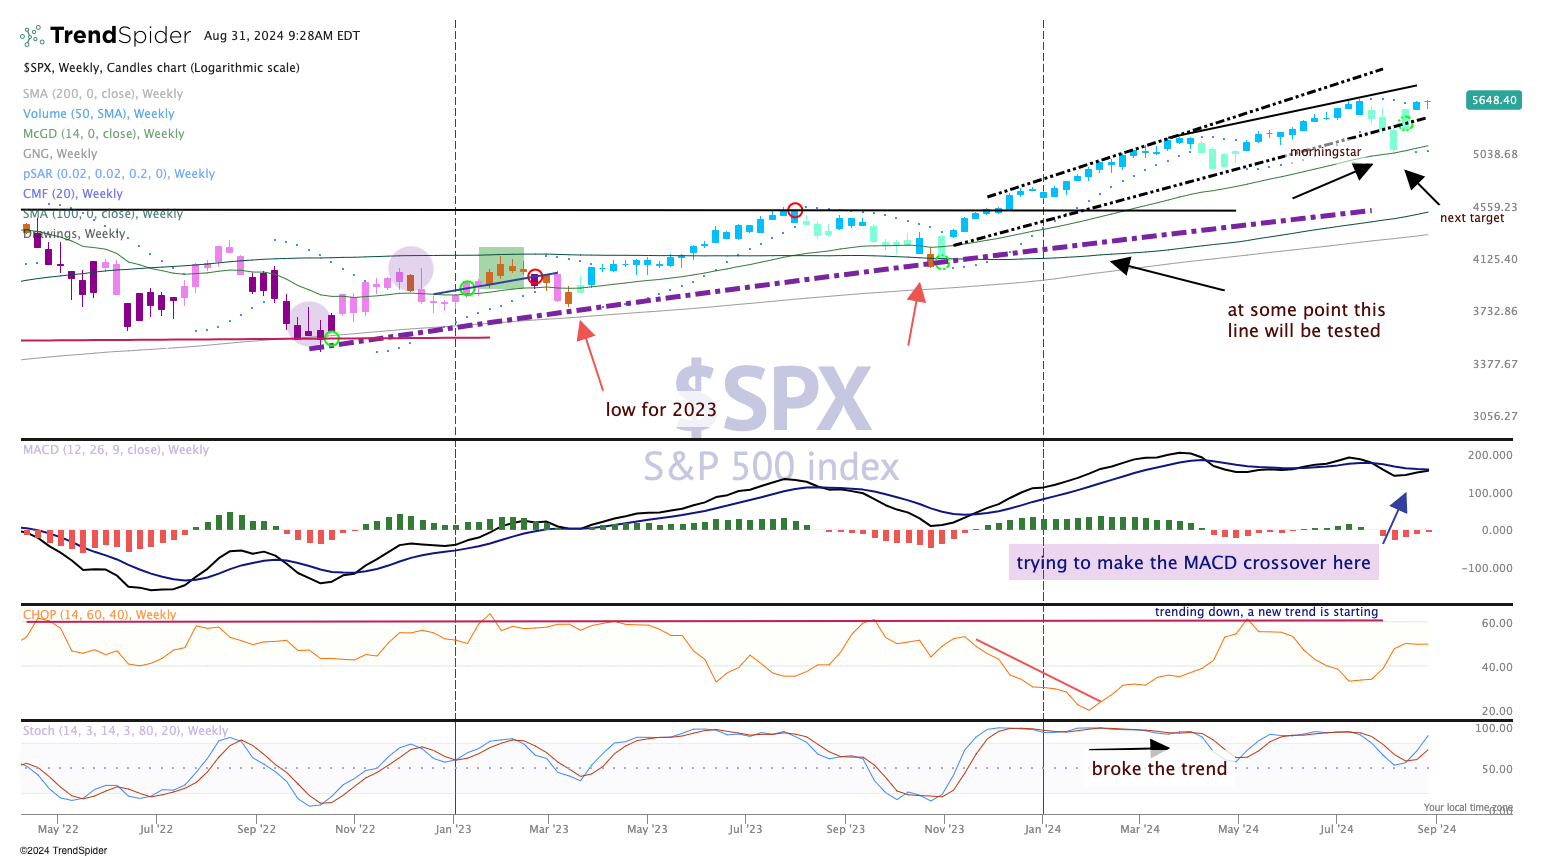
The chart shows a strong move as the index closed at session highs for the week. That is undeniably bullish, the Moving Average Convergence Divergence, as see on the third pane, is still trying to make a crossover bullish move. If that happens, we like to see a follow-through to the upside for confirmation. But confirmation might might take a few more weeks.
The price of the S&P 500 remains in the new channel we drew in last week, with a slightly higher-high. That is also bullish.
September tends to be the most bearish month of the year. But here's the catch: On several occasions, when August was higher so was September.
At the time of publication, the Pro Portfolio had no position in any security mentioned.
