Chart of the Day: Apple's Looking Sweeter
The iPhone maker's chart is cooking as we come out of August.
You've reached your free article limit
You've read 0 of 1 free Pro articles.
That's a pretty nice comeback for Apple AAPL this month, as tech stocks like this one were under duress just after August got started.
But a solid recovery for Apple off the Aug. 5 lows was very impressive and now puts the stock in position to take out the old highs from mid-July.
Notice the candles are blue again; that is a strong bullish condition on the GoNoGo composite of indicators. Further, the parabolic stop and reverse indicator in the first pane in the chart below shows the dots are bullish. This provides good support as long as the condition stays that way.
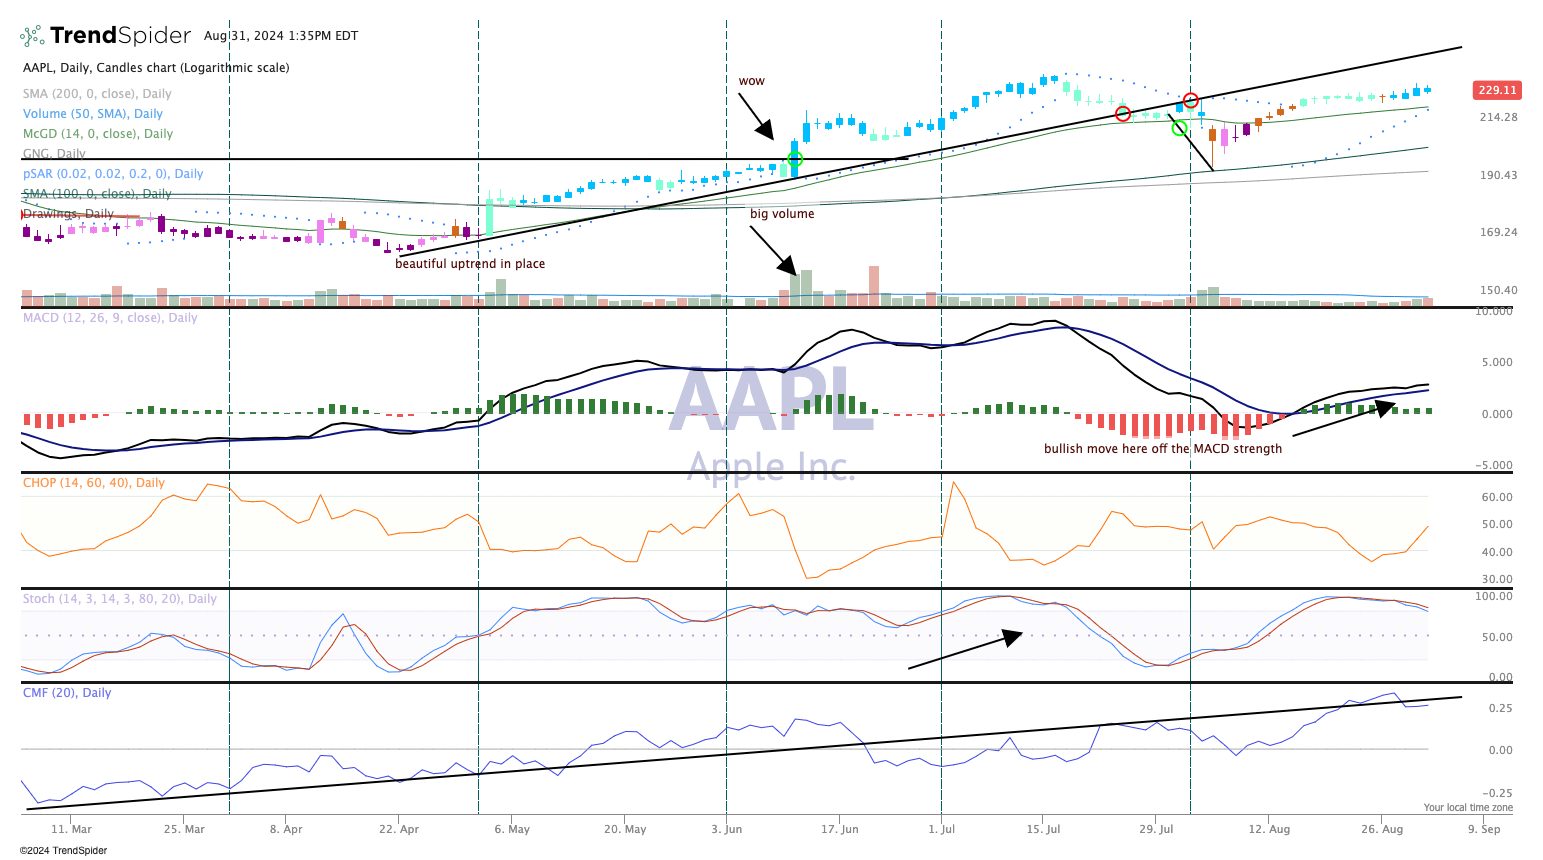
Looking down the second pane, the moving average convergence divergence indicator is strong as well. Going into September, we have often seen Apple make big moves as the company prepares for one of its events.
It seems Sept. 10 is the big day and might be the one where a new iPhone with artificial intelligence capabilities is launched. Many analysts have pointed to this launch as likely the start of a "super cycle" for the iPhone, and before the holidays the timing could not be any better.
Looking back to the chart, the volume trends are bullish, and the "CHOP" indicator, known as the "Choppiness Index," shows the trend is flattening out bullish and that is positive. (This index shows, as you might expect, how choppy a market is, as in whether it's trading sideways or trending up or down.)
In sum: Nothing wrong here with the Apple chart, but active dip buyers are coming in each time the stock falls down, a bullish sign as well.
We rate Apple a "Two" in TheStreet Pro Portfolio, or stockpile on weakness.
At the time of publication, the Pro Portfolio was long AAPL.
