Chart of the Day: Costco Hits Firm Buying Level
The stock remains buoyant though it lacks positive movement at the current time.
You've reached your free article limit
You've read 0 of 1 free Pro articles.
It is important to understand phases of stock movements. Some are long and others are short, and of course, a series of ups and downs can be estimated based on the volatility in the stock.
A name like Costco (COST) is in neither of those camps, rather the stock has found a low at the $900 level and is just moving sideways. It is hard to understand why this is the case when the stock has been such a strong performer, but we don’t need to ask why, we just need to know what is happening in the moment.
With very strong retail sales released early on Wednesday, there is a good chance Costco will be the beneficiary down the road. Further, holiday shopping will be getting underway soon and that might mean more traffic to its stores. But as we know, the chart gives us good information about the future.
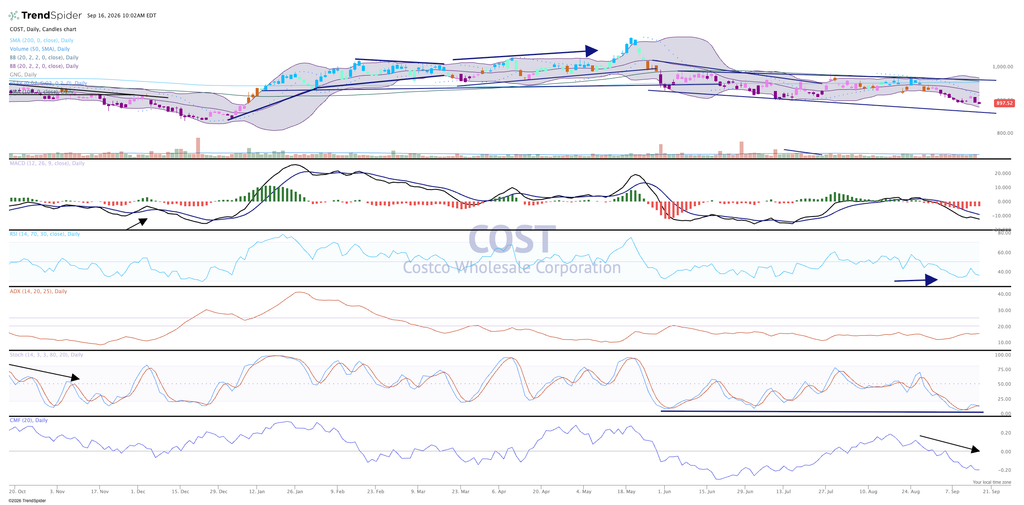
The MACD remains bearish and challenged, money flow is weak and getting worse while the price chart is bearish (showing purple candles). We can see the $900 level has been firm, so barring any shocking news on Costco or the economy, that level should hold and present a nice buying opportunity if you’re light on the shares.
We like Costco in TheStreet Pro Portfolio and rate it a One, or “buy at anytime.”
More Pro Portfolio
- Closing Out This Position as Fed Rate Hike Odds Rise
- 26 Signals Across 9 Portfolio Themes
- Weekly Roundup: A Good Week to Lose Less as Market Stumbles
At the time of publication, TheStreet Pro Portfolio was long Cost.
