The Russell 2000 Is the Chart to Watch. Here’s Why.
I’ve mentioned the equal-weight S&P as an important indicator before. But now, I’m watching the Russell 2000 because it might have even better guidance for traders and investors.
You've reached your free article limit
You've read 0 of 1 free Pro articles.

Note: I am off the desk as I am speaking at the NAAIM Conference and will be on a plane home Tuesday. My next column will be Wednesday morning. And yes, I did razz them for being complacent themselves, having taken their exposure right back up to 87 last week!
The Beloved Tech stocks rallied! And they did not turn red by the end of the day. It feels like a minor victory, doesn’t it?
By now you know that when they rally, they tend to do so at the expense of the rest of the market and Monday was no different. The breadth was poor and upside volume on the NYSE logged in at a mere 41%, so we’ve got the same market with us.
Naturally, none of the indicators changed, nor did sentiment. But I do want to talk about the Russell 2000. When I decided a few weeks ago that I thought it was time to favor the others, I used RSP, the equal-weight S&P, rather than the Russell. The Russell 2000, or IWM, the ETF, is my standard go-to for this trade. But this time the RSP looked more interesting to me.
Yet I now see that the IWM has been green for five of the last six trading days. It was green on Monday, even with breadth being lousy. Now if we take a look at the chart, we can see it is smack up against the rather steep downtrend line that has been in place since these others turned south in August.
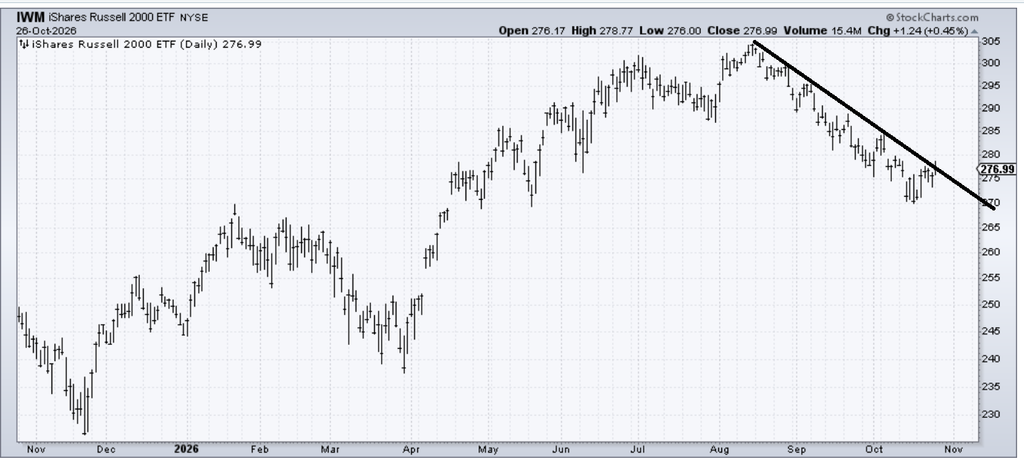
Not shown on the chart is the 200-day moving average line which comes in right around this 275-280 area. Since the IWM is trading higher than it was 200 trading days ago, the moving average is still flat to rising. My rule of thumb is, flat to rising moving average lines are easier to recapture than down slanting ones.
So rather than watch tech stocks—well, okay, I will always watch the tech stocks!—over the next week I am interested to see if the IWM can break over that downtrend line and recapture the 200-day moving average. I tend to think when you break one thing it matters, but break two things at the same time and it matters a whole lot more.
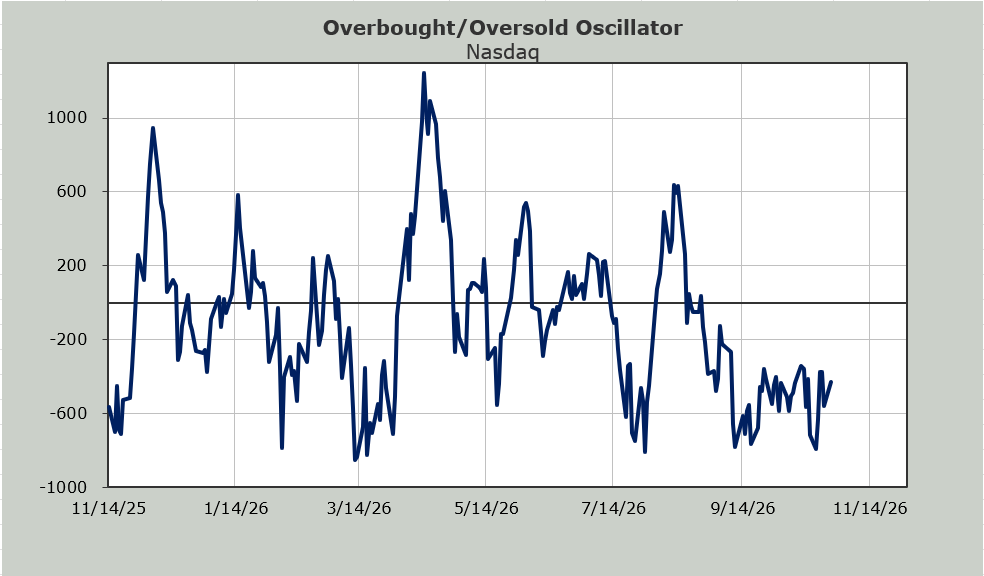
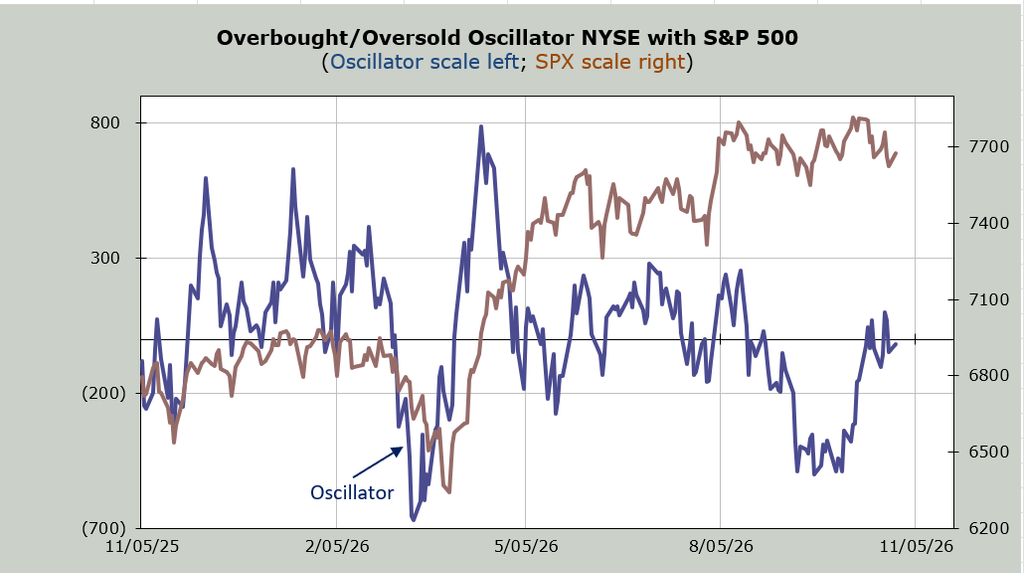
Aside from that the others are a bit overbought (short term). You can see that in the Overbought/Oversold Oscillator’s hovering around at the zero line.
Nasdaq’s Oscillator has still not managed to cross over the zero line. I think it makes a try to do so this week.