Russell Mired in Red Streak as Seasonality Disappoints
If you came into the month banking on a higher July, you are surely disappointed right now.
You've reached your free article limit
You've read 0 of 1 free Pro articles.

I am the last person you should ever look to when it comes to seasonality in the market. If there is a seasonal trade that works 95% of the time and I decide to play it, I can almost guarantee that that will be within the 5% of the time it doesn’t work.
I thought of that on Monday because, as we entered the month of July, there were all of these seasonality charts flying around telling us what a great month July is. Now it might still end the month (there are still two weeks to go) much higher than it is now, but if you came into the month banking on that higher July you are surely disappointed right now, aren’t you?
And would it surprise you to know that the Russell 2000 (which I would remind you got overbought in the last week of June) has had exactly four green days in the month thus far? Not exactly what the seasonality folks hoped for, is it?
But we remain in two markets. Oh, it’s not as perfectly clear cut as it once was, with the Magnificent Seven diverging as they have, but there are the semis that are in a world of their own. Before I discuss Nasdaq, I want to note that the Russell, aside from being green for a mere four trading days in the month, has now logged its third straight red day, making it the longest red streak since May. It hasn’t gone to four since early March.
I bring that up because I think it is possible, even likely, that we see a rally for a day or two, just because the market hates these long strings of down days, and some of the math behind my short-term indicators implies a little bounce. But overall I think the “others” are in for a rough patch over the next few weeks.
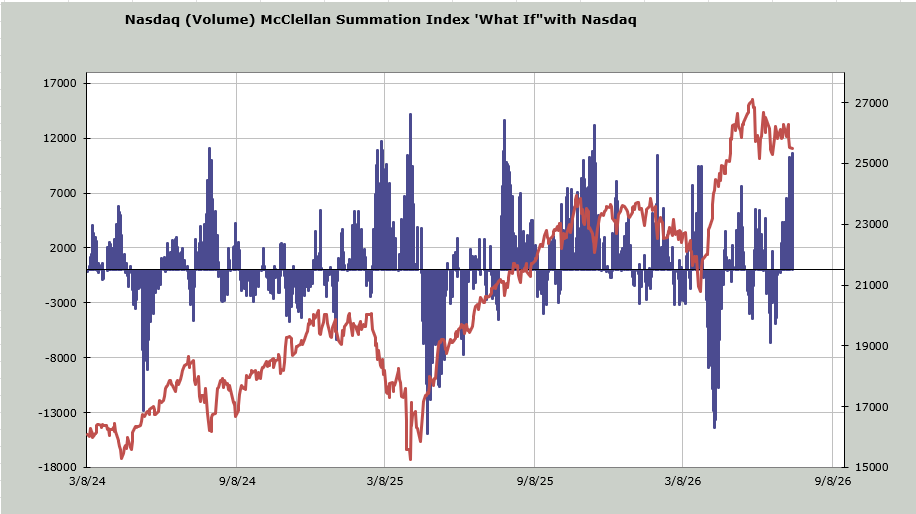
As for Nasdaq, which is already down from the peak in early June, ihere’s a different situation. Its McClellan Summation Index has been heading down. It will now take a net differential of +11 billion shares (up minus down volume) to halt the decline. Considering Nasdaq trades approximately 7 billion to 8 billion shares each day, it would take two spectacular up days just to get the indicator to stop going down. That’s what makes it oversold (short term).
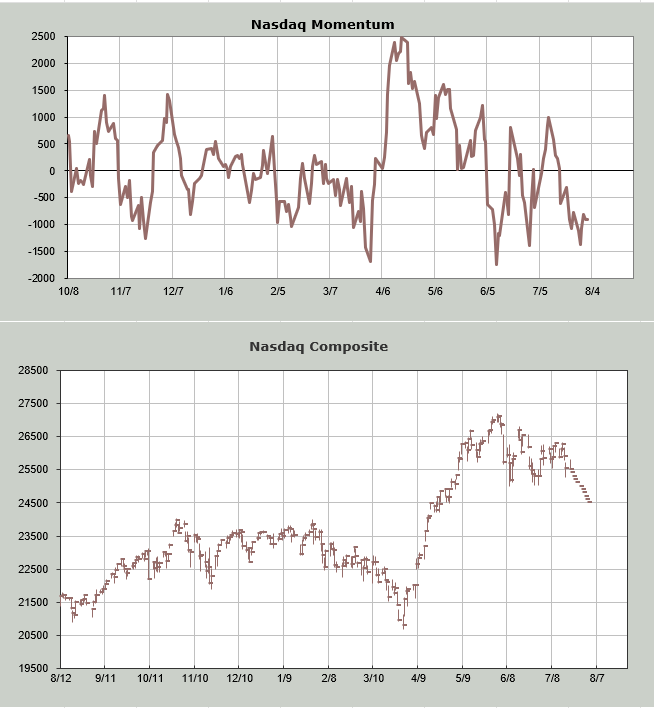
When it comes to price, I use the Nasdaq Momentum Indicator. Here, I plug in lower prices for Nasdaq, searching for the point in time that the indicator stops going down and starts to rise. The exact date is not important — think of it as a general timeframe. Here I have plugged in lower closes for Nasdaq (about 1,000 points) over the next week or so and you can see early next week the indicator starts to rise. So Nasdaq is heading into an oversold condition.
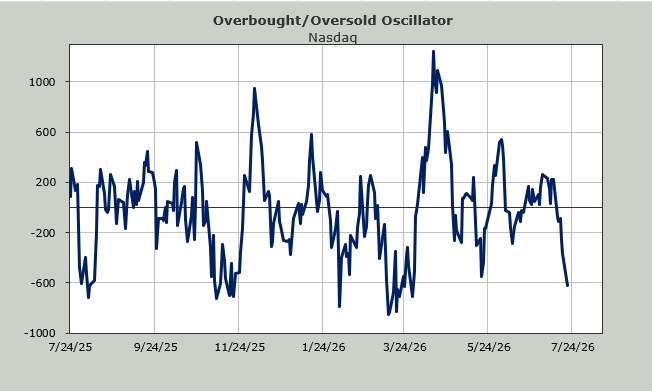
Even my own Overbought/Oversold Oscillator is getting oversold.
But sentiment is not yet there. Monday probably went a long way to changing a few minds, but it’s not yet enough for me. A bounce for a day or two that then comes back down and breaks something would probably get the chatter much louder. Maybe it would even get the put/call ratio over 1.0. Maybe it would get the VIX jumpy. Maybe the volume in the QQQs would get up and over 90 million shares.
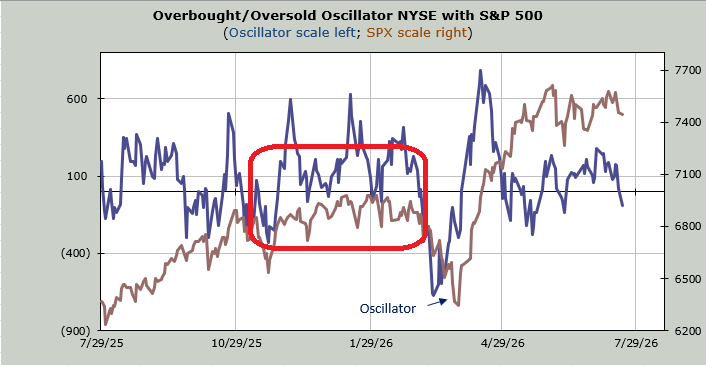
That would be better than this chopfest we have lived in for two months. I am still drawing in that red box.