Let’s Take a Look at Wealth in America
The Fed’s triennial Survey of Consumer Finances showed income gaps narrowed while wealth gaps widened. Debt stress rose even as more families reported increased spending.
You've reached your free article limit
You've read 0 of 1 free Pro articles.

The Federal Reserve Board released its 2025 Survey of Consumer Finances on Friday. The survey, which the Fed has produced every three years since 1989, collects “information about U.S. family income, net worth, balance sheet components, credit use, and other financial outcomes.” The 2025 edition is based on interviews with 4,367 families.
A few things to keep in mind when reading the numbers. All dollar figures are adjusted to 2025 dollars, so the changes are “real,” not nominal. Income is “measured for the year before the survey,” so the 2025 survey’s income figures cover 2024, compared with 2021 in the 2022 survey. Net worth and other balance sheet items are measured as of each family’s interview. While it’s a lagging snapshot, it is one of the most detailed looks we have at household finances.
As context, the Fed notes that between the two surveys, “real gross domestic product grew at an annual rate of around 2½ percent, the civilian unemployment rate rose from 3.7 percent to 4.2 percent, and the annual rate of change in the consumer price index averaged 3.6 percent.”
Executive Summary
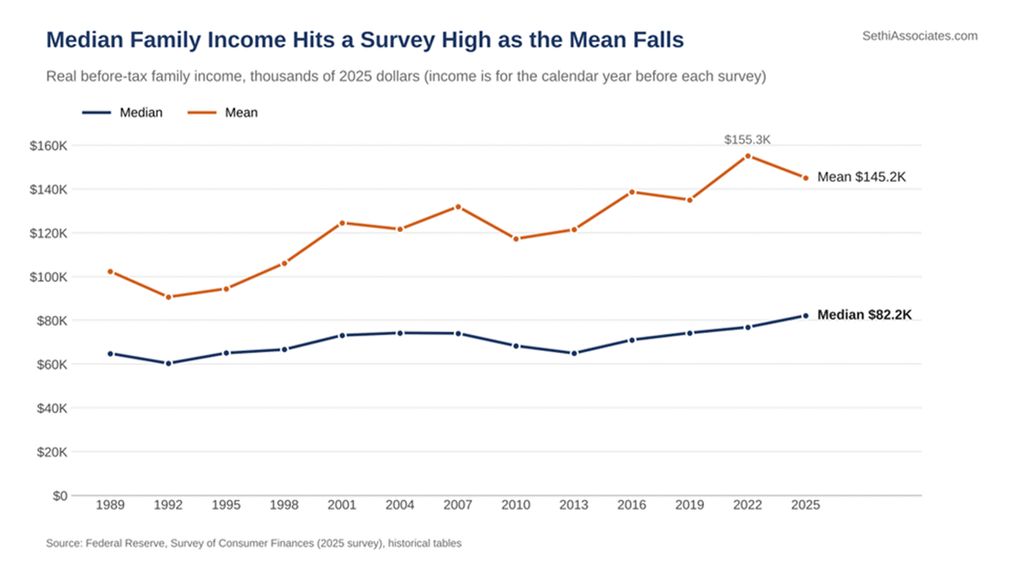
- Income gaps narrowed. Real median family income rose 7% to $82,200, the highest in the survey’s history going back to 1989, but mean income fell 6% to $145,200 as income at the top declined.
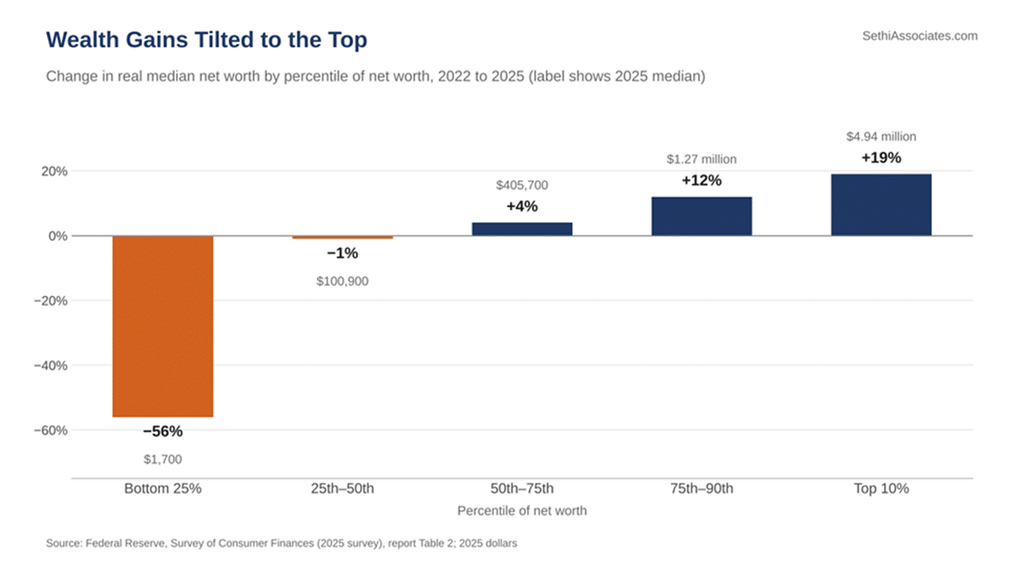
- Wealth gains tilted to the top. Median net worth rose 2% to $215,900 and mean net worth rose 7% to $1.24 million. The top 10% of families by wealth saw median net worth rise 19%, while the bottom quarter’s median fell to $1,700 from $3,800.
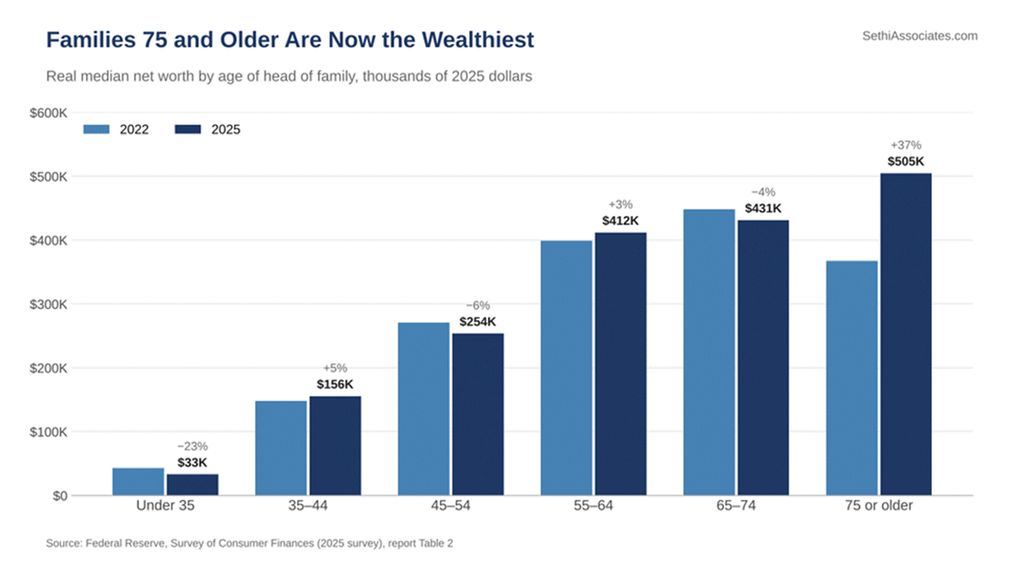
- The oldest are now the wealthiest. Families headed by someone 75 or older saw median net worth jump 37% to $504,900, the highest of any age group, while families headed by someone younger than 35 saw theirs fall 23% to $33,000.
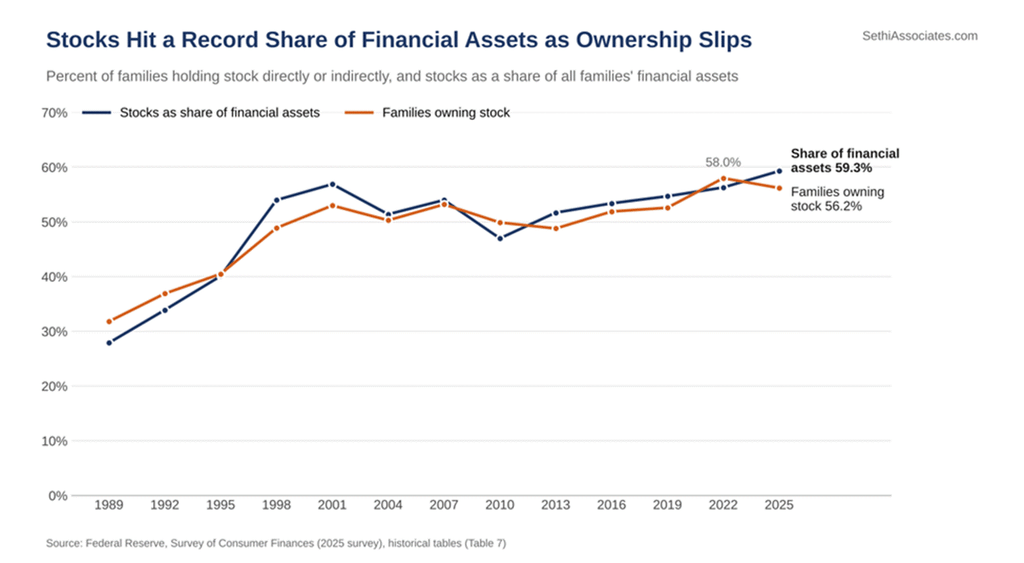
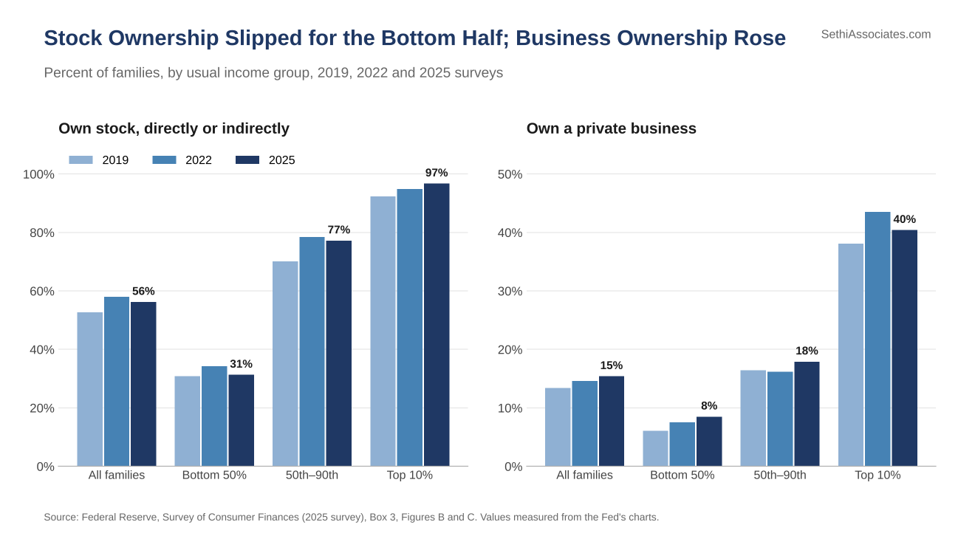
- Fewer families own stocks, but stocks are a record share of their financial assets. Stock ownership slipped to 56.2% from 58.0%, with the bottom half of earners accounting for nearly all of the decline, while stocks rose to 59.3% of families’ financial assets, the highest in the survey’s history.
- The cost of buying a home hit a record share of income. The monthly payment needed to buy the median home was about 33% of median family income in 2025, an “all-time high” for the modern survey, up from 26% in 2022.
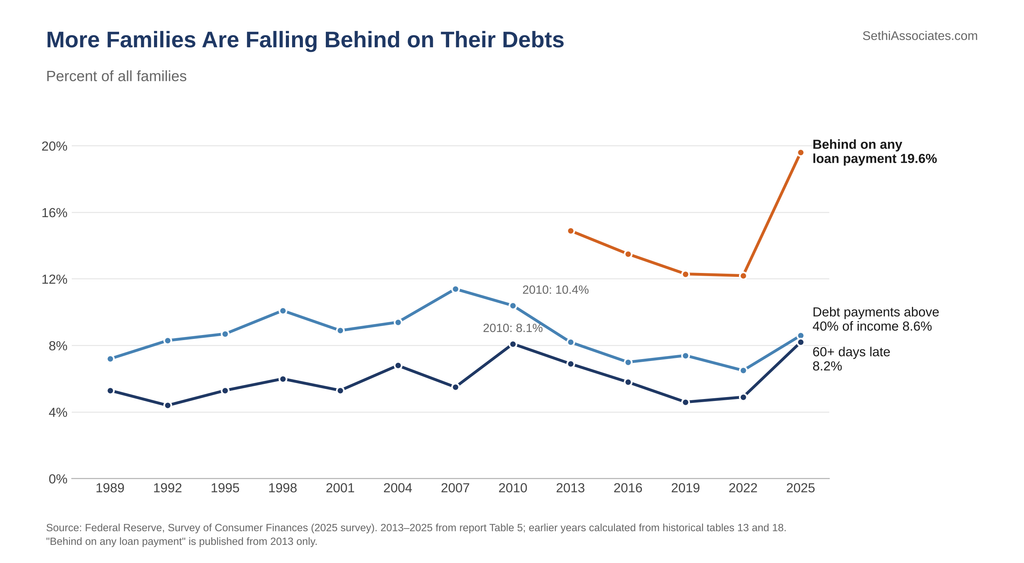
- Overall debt stress was the highest since 2010. The share of families behind on loan payments rose to 19.6% from 12.2%, and 8.6% of families had debt payments above 40% of income, both the most since 2010.
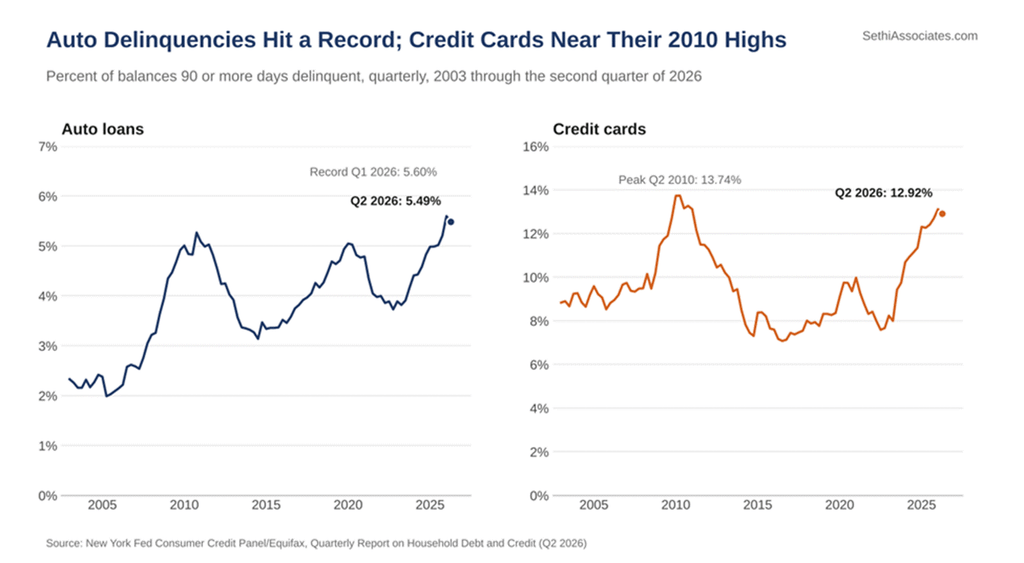
- Auto and credit card stress continued into 2026. New York Fed data show the share of auto loan balances 90 or more days delinquent hit a record in the first quarter, and the credit card share hit its highest since late 2010.
- The top isn’t pulling away on spending. The top 10% of earners account for 28.5% of spending, below some popular estimates, and Fed economists found “higher-income families do not appear to be pulling away but at least some lower-income families appear worse off.”
Incomes
Real median family income rose 7% to $82,200, the highest in the survey’s history going back to 1989. That compares with $76,900 in the 2022 survey. Real mean (average) income interestingly though went the other way, falling 6% to $145,200 from $155,300.
In the Fed’s words, “The rise in median income combined with the fall in mean income indicates that the income distribution narrowed between the 2022 and 2025 surveys.” The Fed said “the fall in mean income was driven by a decline for families at the top of the income distribution,” and that “excluding families in the top 1 percent of income indicates that, between the 2022 and 2025 surveys, mean income declined only 1 percent.” High-income families tend to draw on income components that are “volatile and can take very large values, primarily capital gains and business income.”
Grouping families by “usual income” (what a family reports it earns in a normal year), median income for the bottom fifth rose 4% to $24,600, and for the middle fifth (40th to 60th percentiles) rose 7% to $83,100. For the top 10%, median income fell 6% to $387,200 and mean income fell 14% to $652,000.
By age, families 75 or older saw median income rise 24% to $66,800 and mean income rise 6% to $125,100, where the Fed said, where the Fed said “retirement income growth seems to play a key role.” This feeds in to the “G-Shaped economy” talked about by Ed Yardeni where income gains from older generations support younger family members. In that regard, the mean income for families 35 to 44 fell 25% to $139,800, “driven by declines in capital gains income,” though their median rose 3% to $97,000.
By race and ethnicity, Hispanic families saw median income rise 31% to $66,800, while “Black non-Hispanic families and Asian families experienced declines in median and mean income.” Black non-Hispanic median income fell 2% to $49,400 and Asian median income fell 3% to $129,900.
Net Worth
Median net worth rose 2% to $215,900, while mean net worth rose 7% to $1,241,500. The Fed said that “on balance, wealth inequality appears little changed since 2022,” but that “in contrast to income, changes in wealth largely reinforced existing patterns of wealth inequality by family characteristics.”
The bottom quarter of families by wealth saw median net worth fall 56% to $1,700, while the top 10% saw theirs rise 19% to $4,935,200. Mean net worth for the top 10% by wealth rose 5% to $8,975,200.
By usual income, the bottom fifth saw median net worth fall 6% to $14,400 and mean net worth fall 4%, while the top 10% saw median net worth rise 31% to $3,669,900 and mean net worth rise 6%. The Fed said that pattern “stood in contrast to 2019 to 2022, where net worth saw broad-based growth across the distribution.”
Homeowners’ median net worth rose 6% to $458,900, while renters’ fell 7% to $10,600. Families outside metropolitan areas saw median net worth fall 6% to $150,100 and mean net worth fall 19%.
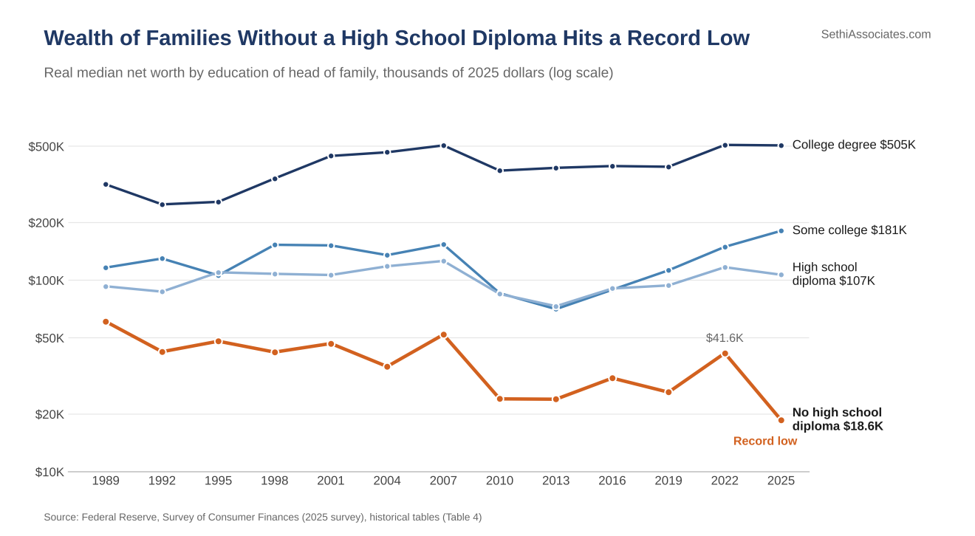
Families without a high school diploma saw median net worth fall 55% to $18,600, which the Fed said was “their largest percent decline recorded in the modern SCF.” Based on the Fed’s historical tables, that’s also the lowest median for the group in the survey’s history going back to 1989, below the $23,900 in 2013. Their mean net worth, by contrast, rose 53% to $294,300, also a survey high. Pointing to the same pattern, to a lesser degree, among families with only a high school diploma, the Fed said “the declines in median net worth and increases in mean net worth imply that wealth inequality within these groups increased.”
Median net worth for families with a college degree is now 27.2 times that of families without a high school diploma, the widest in the survey’s history, up from 12.2 times in 2022. Families with some college but no degree saw the largest gain, with median net worth up 21% to $181,000, while families with a college degree were about flat at $505,400 (down 1%).
Black non-Hispanic families saw median net worth fall 25% to $36,800, a decline the Fed said “stands in contrast to increases seen since the 2013 survey.” As a result, “median wealth for White non-Hispanic families was nine times that for Black non-Hispanic families, which is the largest ratio recorded since 2016.” Hispanic families saw median net worth rise 18% to $79,600, and the White–Hispanic median wealth ratio was “the smallest on record in the modern SCF.”
The Oldest Families Are Now the Wealthiest
In line with the income distribution noted earlier, families headed by someone 75 or older saw median net worth jump 37% to $504,900, the highest median for any age group in the survey’s history. That puts them ahead of families 65 to 74 ($431,300, down 4%) and 55 to 64 ($411,900, up 3%). Their mean net worth rose 10% to $1,962,200, also the highest of any age group in 2025. The Fed said that “in contrast with the previous few survey years, families aged 75 or older had the largest net worth, exceeding levels by families that are nearly or recently retired (which saw some declines).” It attributed the gain to retirement savings: “the increase in net worth was primarily driven by an increase in the value of retirement accounts.”
At the other end, families headed by someone younger than 35 saw median net worth fall 23% to $33,000 and mean net worth fall 33% to $135,400. The Fed said “these declines in net worth among young families are primarily driven by the unwinding of business equity gains between 2019 and 2022.” For context, that group’s median net worth had risen to $42,700 in the 2022 survey from $17,600 in 2019.
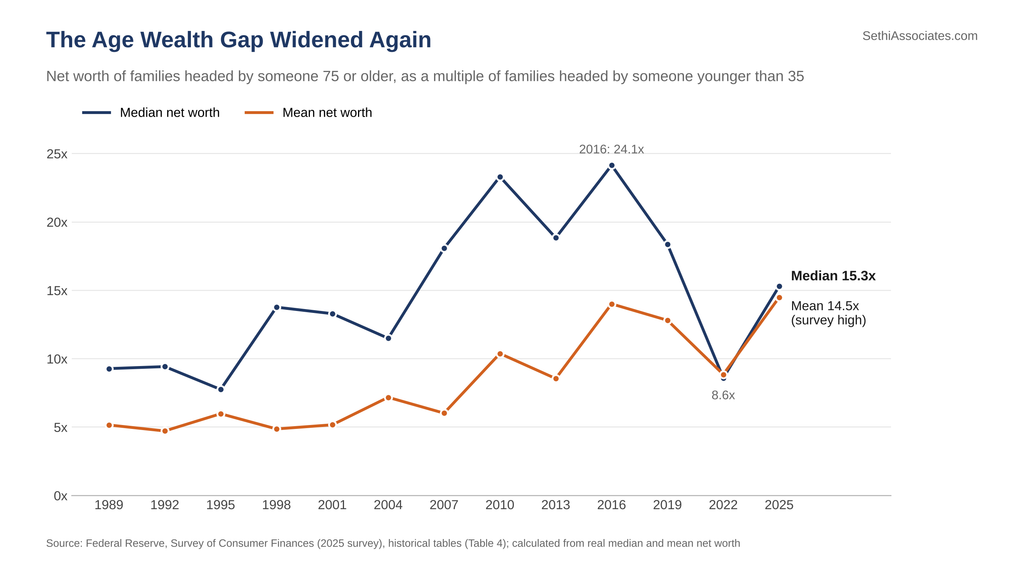
That widened the gap between the oldest and youngest families. Based on the Fed’s historical tables, median net worth for families 75 or older was 15.3 times that of families younger than 35 in 2025, up from 8.6 times in 2022, though below the 24.1 times in 2016. Measured by mean net worth, the multiple rose to 14.5 times from 8.9 times, the widest in the survey’s history going back to 1989.
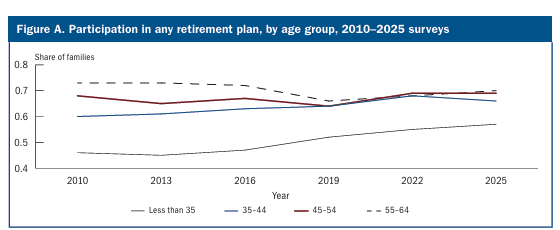
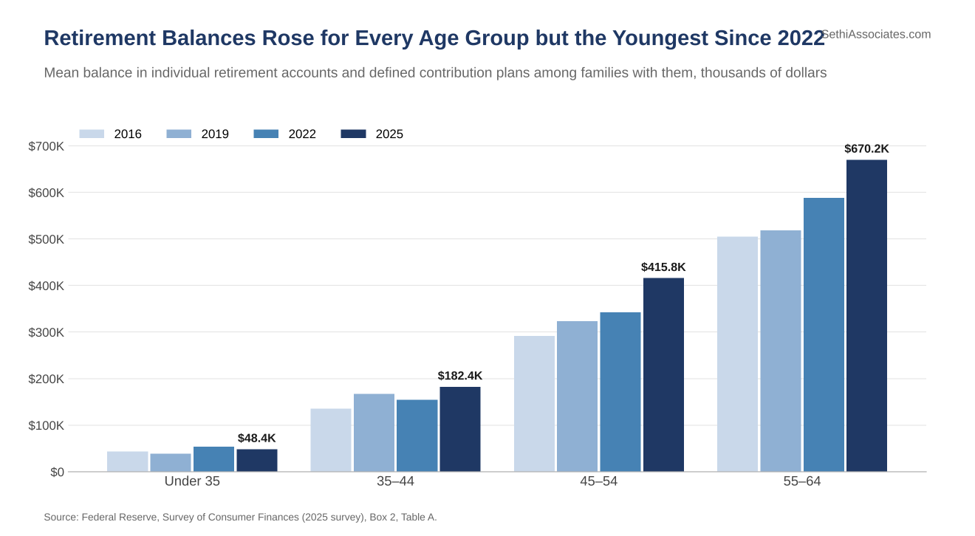
Among families headed by someone 64 or younger, retirement plan participation was 65.1% in 2025, up from 64.4% in 2022. Participation was “around 70 percent” for families 45 to 64 and 66% for families 35 to 44, and the Fed said “younger families (those under age 35) have notably increased their participation over the past 15 years.” Among families with individual retirement accounts or defined contribution plans such as 401(k)s, “the average combined balance increased for all age groups, except for the youngest families.” Mean balances rose to $670,200 from $588,500 for families 55 to 64 and to $415,800 from $342,700 for families 45 to 54, while slipping to $48,400 from $53,800 for families younger than 35.
Stocks
Stocks rose to 59.3% of families’ financial assets, the highest in the survey’s history, even as the share of families owning them slipped to 56.2% from 58.0%. Ownership, direct or through funds and retirement accounts, remains above “the 53 percent in 2019.”
Ownership rises sharply with income. By usual income, “31 percent of families in the bottom half of the distribution held stock, compared with 77 percent of families in the upper-middle group and 97 percent of families in the top decile.” The Fed said “the bottom half accounted for nearly all of the overall decline in participation between 2022 and 2025.”
For families who did own stocks, the value of those holdings rose across the board. The real mean increase was “around $13,000 for the bottom half (a 15 percent increase from 2022), $72,000 for the upper-middle group (a 30 percent increase), and $367,000 for the top decile (a 16 percent increase).” Median holdings among stockowners rose 36% to $77,400 from $56,900.
In terms of private businesses, “15 percent of families owned a privately held business, slightly larger than the value reported in 2022,” and the Fed said the increase “was fully driven by families in the bottom 90 percent, as ownership in the top decile declined.” But “unlike holdings of publicly traded stock, the real value of privately held business declined between the 2022 and 2025 surveys for income groups in the bottom 90 percent.” Among business owners, the real mean value fell around $59,000 (18%) for the bottom half by usual income and around $128,000 (22%) for the upper-middle group, while it rose around $98,000 (2%) for the top 10%.
Housing
The homeownership rate was 65.6%, versus 66.1% in 2022, which the Fed described as “about stable at 66 percent.” It rose to 92% from 89% for the top 10% by usual income and slipped to 78% from 80% for the upper-middle group.
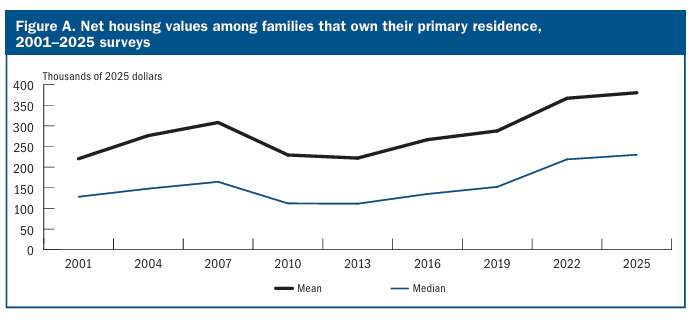
For homeowners, median net housing value (the home’s value minus mortgages and other home-secured debt) rose 5% to $230,000 from $218,900, “remaining at a record high.” But that growth was much slower than the average gain of 26% across the three prior surveys. Among families with a mortgage or other debt on their primary residence, the median balance rose to $183,600 from $170,200.
On affordability, the Fed said “the median home was worth more than 4.5 times median family income in 2025, about unchanged from the previous high in 2022.“ That ratio had bottomed at 3.5 in 2016.
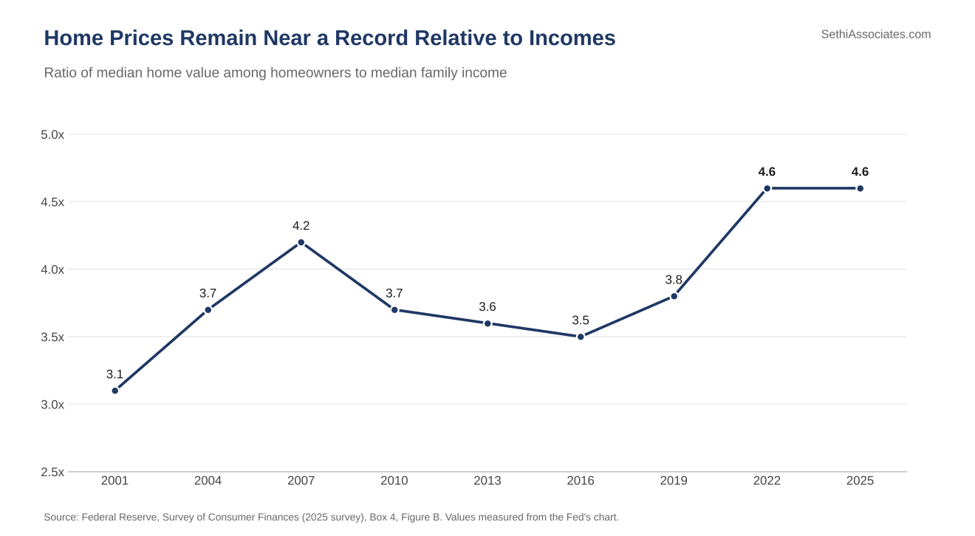
However, “the monthly required payment for a 30-year fixed rate mortgage that would cover 80 percent of the purchase price of the median home and includes annual property taxes that are 1 percent of the home’s value (0.083 percent monthly) was about 33 percent of monthly median family income, which is an all-time high … up from 26 percent in 2022. This 7 percentage point increase was driven mostly by the increase in interest rates over this period.” The calculation excludes maintenance, insurance and homeowners association fees.
Vehicle ownership, the most commonly held nonfinancial asset, fell to 84.2% from 86.6%.
Debt and Financial Stress
The share of families with any debt “remained about stable at 77 percent.” But debt burdens rose relative to income. The median debt payment-to-income ratio for families with debt rose 2.0 percentage points to 15.4%, “rising back up to its 2019 level,” and the aggregate debt-to-income ratio rose to 94.9% from 89.4%. Measured against assets, debt looks lighter: the median leverage ratio (debt relative to assets) for families with debt was 26.9%, “continuing the steady decline seen since the 2013 survey.”
The rise in payment burdens was steepest at the bottom. Based on the Fed’s historical tables, the median debt payment-to-income ratio for families with debt in the bottom fifth by income jumped to 15.5% from 10.8%, the highest since 2010 and the largest increase of any income group. For the top 10%, it rose to 9.0% from 8.4%. In aggregate, total debt payments rose to 11.9% of total income from 9.9% in 2022, the lowest in the survey’s history, putting the aggregate ratio at its highest since 2013.
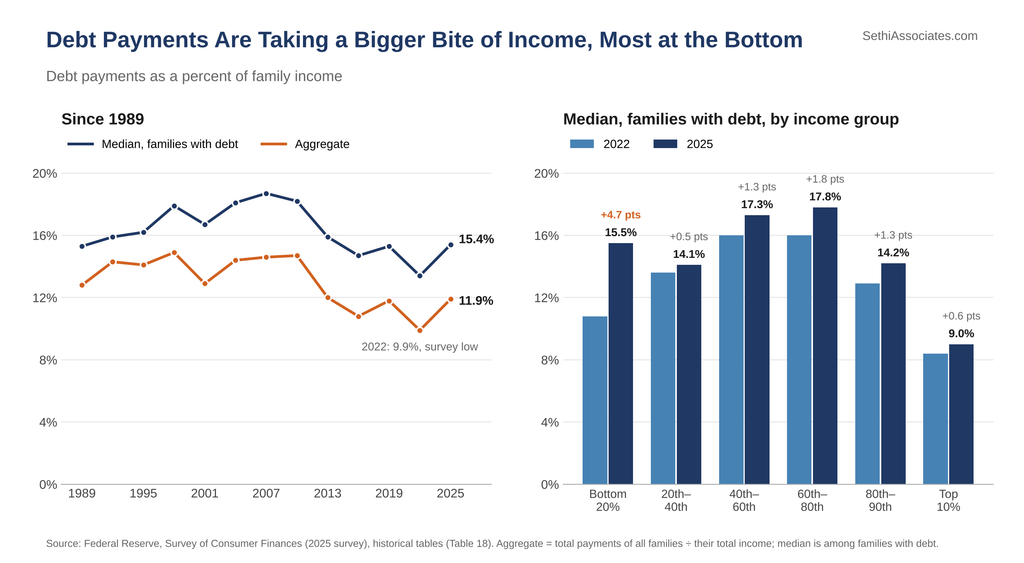
The share of families with debt payments above 40% of income, which the Fed calls “an important indicator of potential financial distress,” rose to 8.6% from 6.5%, “the largest share since 2010.“
Also rising to the highest since 2010 was the share of families behind on loan payments which jumped to 19.6% from 12.2%. The Fed said families “were more likely to be behind on their financial obligations than at any point since the 2010 survey.”
The share of families 60 days or more late rose to 8.2% from 4.9%. Based on the Fed’s historical tables, that’s the highest share in data going back to 1989, just above the 8.1% in 2010. Among families with debt, the share 60 days or more late rose to 24.8% from 16.1% for the bottom fifth by income, and to 19.3% from 11.9% for renters, both also the highest in the Fed’s historical tables going back to 1989.
Elsewhere, the share of families with a buy now, pay later balance rose to 12% from 7%, with a median balance of $400 and a mean of $1,400. The share carrying a credit card balance was about unchanged at 45%, but the median balance rose $150 to $3,100 and the mean rose $1,300 to $8,000. Payday loan use rose to 2.6% from 2.1%, and the share of families that didn’t apply for credit for fear of being turned down rose to 13.5% from 12.9%. The share of families that declared bankruptcy in the past five years was 1.4%, versus 1.3%, and the share with a foreclosure start was 0.7%, versus 0.5%.
Spending
The 2025 survey added new questions on total spending, which along with existing questions on food, housing and vehicles the Fed said “provide more comprehensive measures of family spending.” Total spending excluding housing costs such as rent and mortgage payments averaged $48,700 over the previous 12 months, and the median was $33,700.
Families in the top 10% by usual income spent an average of $138,800, “nearly double the spending of the 80th to 90th percentiles,” and accounted for 28.5% of all spending. Families in the bottom fifth spent an average of $17,600, or 7.2% of the total. The picture is similar by wealth: the top 10% spent an average of $136,000, or 27.9% of the total, while the bottom fifth spent $23,400.
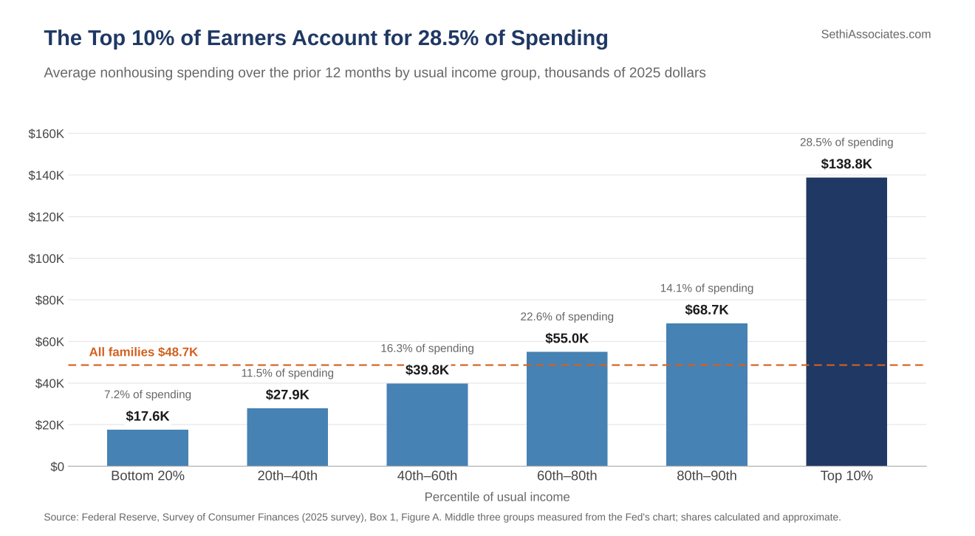
That top-decile share is lower than some widely cited figures. In a companion FEDS Note on the new spending data, Fed economists Aditya Aladangady, Jesse Bricker, Andrew C. Chang, Sarena Goodman and Gina Li noted that their estimate is below popular press figures “which attribute up to 45 percent of spending to the top decile of income.” They added that in the Labor Department’s Consumer Expenditure Survey, “the highest decile accounts for a still-high 21 percent of spending,” and that in the Fed survey, “two-thirds of total spending in the top income decile was by the top 5 percent by income.”
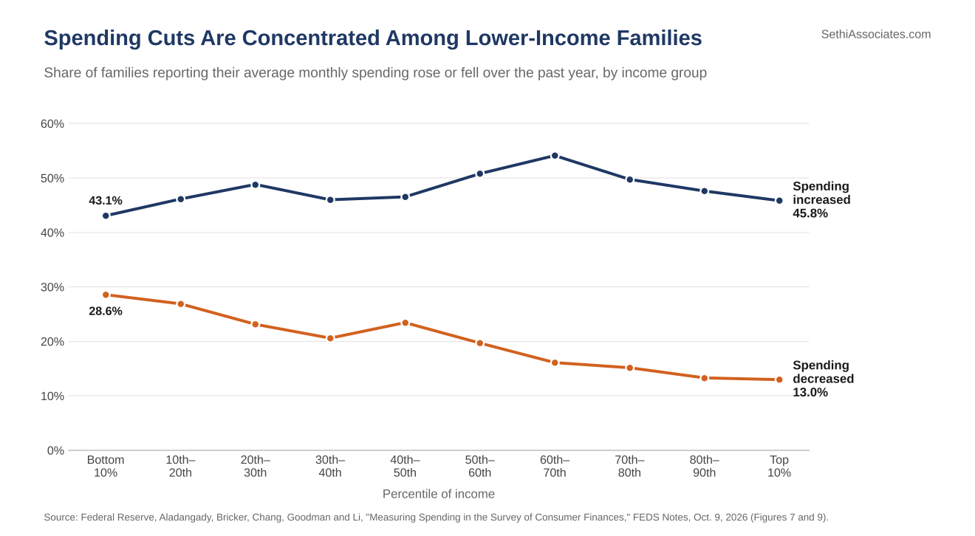
On the “K-shaped” economy debate, the note used new questions asking families whether their spending, income and financial situation had changed from a year earlier. “The share of families reporting a decrease in spending is concentrated among lower-income families,” the authors wrote, while “higher-income families do not appear to be disproportionately increasing spending.” They concluded that the pattern “is only in part consistent with a K-shaped recovery” and that “higher-income families do not appear to be pulling away but at least some lower-income families appear worse off.”
The note’s data by income decile showed the pattern. Among the bottom 10% of families by income, 28.6% said their spending fell over the past year, more than double the 13.0% of the top 10%. The share saying spending rose though was higher, ranging from 43.1% to 54.1% across income groups and peaking in the 60th to 70th percentiles rather than at the top.
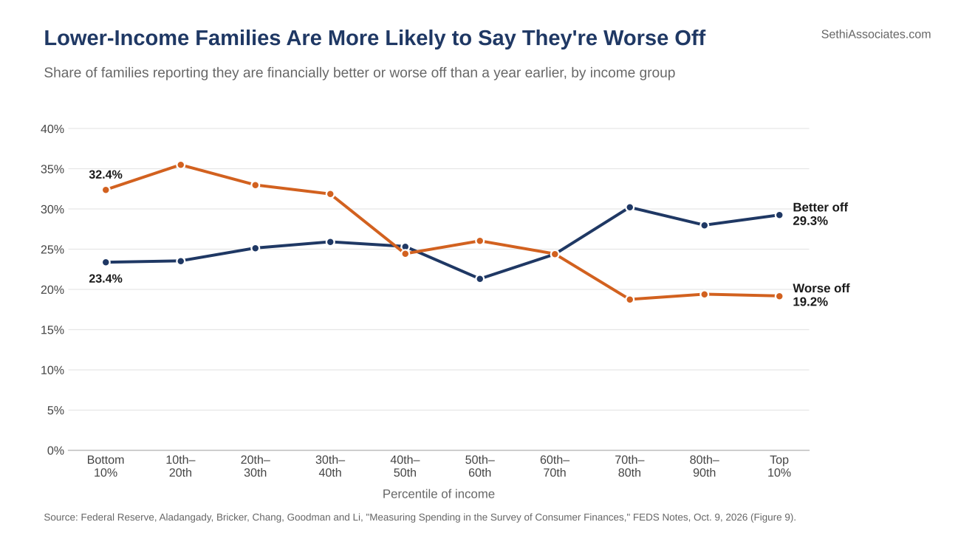
And on overall finances, 32.4% of the bottom 10% said they were worse off than a year earlier and 23.4% said they were better off, while for the top 10% the split was reversed, at 19.2% worse off and 29.3% better off.
Note though more recent data from Bank of America suggests that the end of 2025 may have represented a cyclical extreme in the high income wage growth versus lower incomes.

The note also estimated that “roughly one-quarter of families are at their budget constraint,” meaning “their calculated saving rates are less than or equal to 0.” Based on the Fed’s historical tables, the share of families that saved over the prior year fell to 53.4% from 56.5%, the lowest since 2013.
The survey also breaks out some categories. Families spent an average of $7,700 on food at home (median $6,000) and $3,500 on food away from home (median $2,400). Vacation spending averaged $4,200 (median $1,000), but “39 percent of families—primarily younger families, those with limited income and wealth, and those with health issues—spent nothing on vacations in the past 12 months.” Among families that did spend on vacations, the average was $7,000 (median $3,500). The Fed said “vacation expenditures account for an increasing share of total spending across both the income and wealth distributions—consistent with vacations being luxury spending—whereas food accounts for a declining share.”
The survey also asked how families would use extra money. A second FEDS Note by the same economists asked families to “imagine you unexpectedly receive a sum of money equal to one month of your family’s normal annual income.” On average, families said they would “spend 22 percent of this hypothetical windfall, save 47 percent” and “use 30 percent to pay down debt.” The share they would spend, known as the marginal propensity to consume, varied by income: “MPCs peak at 28 percent in the bottom decile and reach their lowest point of 14 percent in the top 1 percent.” The authors also found that “the MPC among hand-to-mouth households” (those with little in liquid assets relative to income) “is smaller than what models generally imply.”
A 2026 Update on Debt and Delinquencies
The survey reflects family finances as of 2025. The New York Fed’s Household Debt and Credit Report for the second quarter of 2026 shows total household debt of $18.8 trillion, down $13 billion from the first quarter. The New York Fed said “aggregate delinquency rates improved slightly in Q2 2026, with 4.7% of outstanding debt in some stage of delinquency.” Mortgages, which make up $13.1 trillion of that total, had 0.99% of balances 90 or more days delinquent.
The share of auto loan balances 90 or more days delinquent hit 5.60% in the first quarter, the highest in New York Fed data going back to 2003, and was 5.49% in the second quarter. For credit cards, 12.92% of balances were 90 or more days delinquent in the second quarter, down from 13.12% in the first quarter, which matched the first quarter of 2011 for the highest since the fourth quarter of 2010. The annualized rate of auto balances moving into serious delinquency was 3.00%, the highest since the first quarter of 2010.
Joelle Scally, economic policy advisor at the New York Fed, said “delinquency rates across most products have held steady over the past two years,” adding, “Still, new delinquencies for auto loans and credit cards remain at elevated levels, a trend we’ll continue to monitor.”
Balances on home equity lines of credit rose $13 billion to $459 billion, “$142 billion above the low reached in Q1 2022.”
Fed’s Takeaways
The Fed summed up the three years by saying that “while most families experienced moderate increases in income and net worth, an increasing subset of families appear to have been experiencing financial stress.”
On why debt looks lighter against assets but heavier against income, the Fed said that “the strong stock market performance and increases in house values during this period boosted family assets,” but that “families may have money tied in illiquid assets that may not easily be drawn down to finance debts.” It added that the rise in debt-to-income and payment-to-income ratios “likely reflect … the fact that some families experienced drops in their incomes,” concluding, “Altogether, these measures suggest that despite the overall growth in family assets, some families may be increasingly less likely to be able to service their loans.”
All Survey of Consumer Finances figures are from the Fed’s report and historical tables. The survey is conducted every three years. The New York Fed’s third-quarter Household Debt and Credit Report is due later this year.


