Is the Nasdaq Volume 'Holiday' Just a One-Week Blip?
Consider the possibility as you look at the chart of stocks making new highs on Nasdaq.
You've reached your free article limit
You've read 0 of 1 free Pro articles.
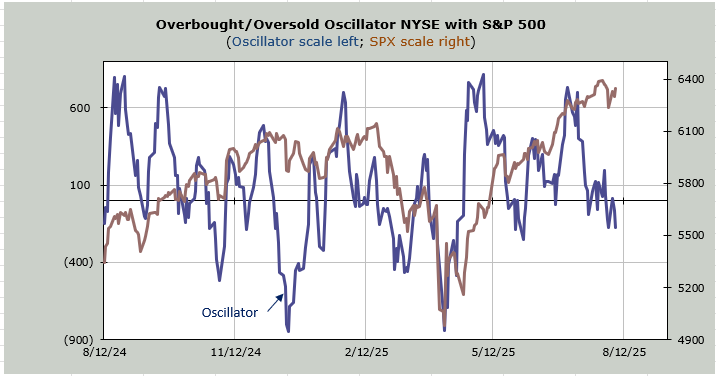
For the past six or seven weeks the majority of stocks have stalled. We have seen that in the SOX and the Bank Index. But we can look at Industrials and see the same.
After the run we had from the April lows this is not surprising at all. The bulls will call it a digestion while the bears will call it topping. But in the past week there has been another change.
Yesterday we looked at the Nasdaq McClellan Summation Index using volume. It has rolled over. It is the first time it has done so since the April low. That’s the blue line on the chart. I won’t harp too much but it’s easy to see that this particular period looks vastly different than the May stall out. In that period all this did was slow the rise for a few days. It never rolled over.
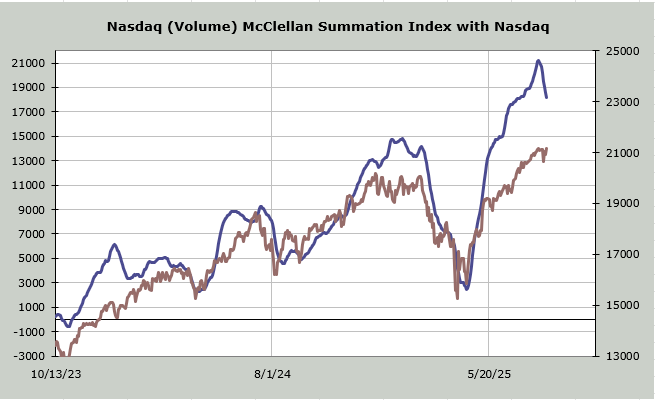
Wednesday’s rally did not change the indicator at all since Nasdaq’s net volume was a mere 54% to the upside. Just a little reminder that Nasdaq itself was up 250 points, or 1.2%.
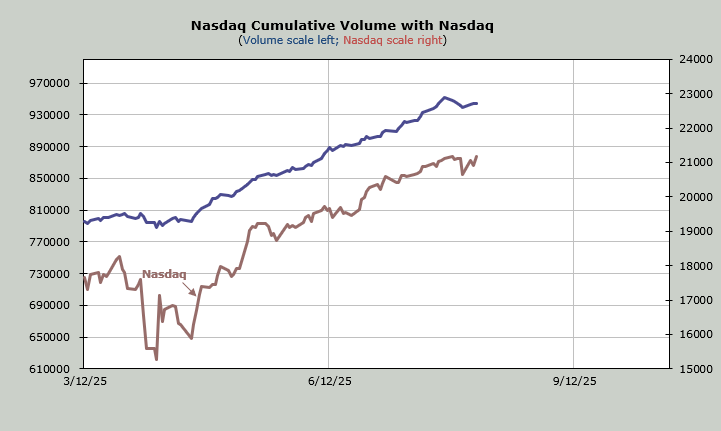
Now take a look at cumulative volume on Nasdaq. This is calculated just like breadth, but instead of using advancers and decliners we are using up and down volume.
I joked the other day that the penny stock traders had taken a holiday since we have seen Nasdaq volume fall off a cliff as soon as the calendar turned to August. But look at the blue line (volume) and notice that it ticked down last week and has barely regained anything this week. Now look at the rise off the April low. We did not even see this sort of action at that hiccup in May.
Now take a look at Nasdaq (brown). It is fractions away from a new all-time high. It’s possible the volume ‘holiday’ is just a one-week change and it will resume the upward path and make new highs in the next few days, but for the time being there is a change here.
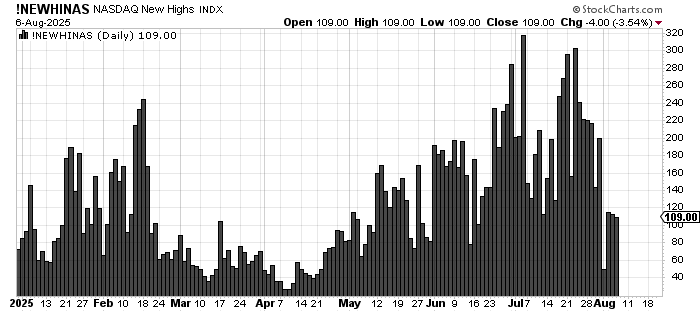
Consider this as you look at the chart of stocks making new highs on Nasdaq. Look at May: there were 160 stocks making new highs. Early July saw over 300. Wednesday had 108. And there were more stocks making new lows than highs.
The best news I have is that sentiment certainly isn’t giddy as it was in early July. We’ve seen the 10-day moving average of the put/call ratio creep up to over .90 already. We’ve seen the Daily Sentiment Index (DSI) go from 87 in early July to 61 today (for the S&P).
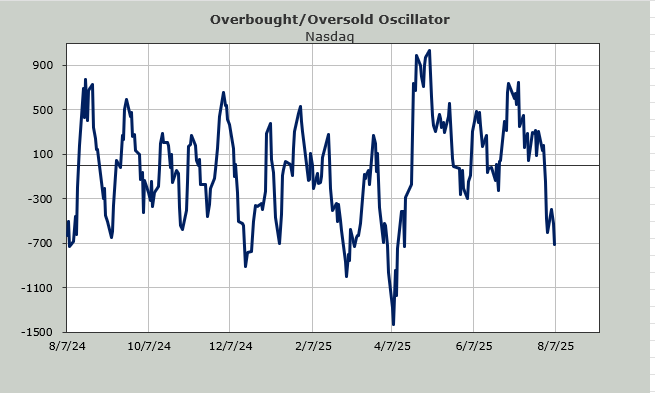
You can see the divergence quite starkly when you look at the Overbought/Oversold Oscillator for Nasdaq. It is now closing in on the March low but the index is near its high. Keeping in mind this indicator is based on breadth, it tells us a lot about what’s happening away from the Index movers.