Is a Double Dip Decline Needed to Set the Market Up for New Highs?
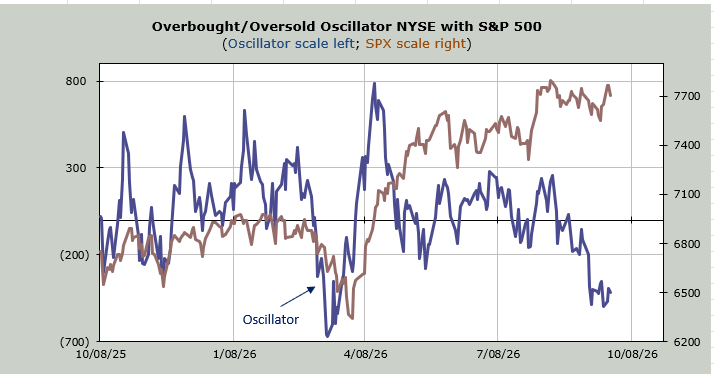
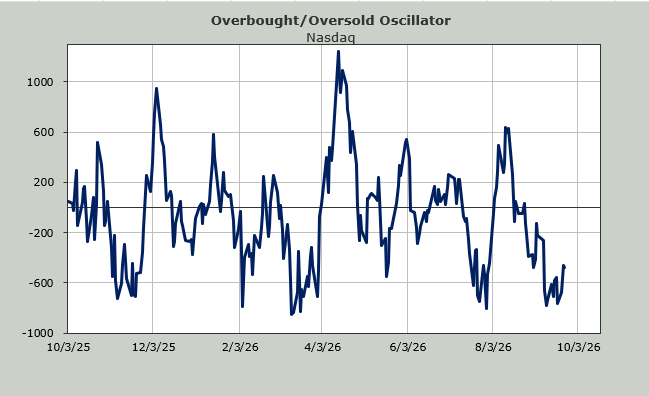
If we look back at the indicators, we’ll see that double-dip declines led to durable rallies.
You've reached your free article limit
You've read 0 of 1 free Pro articles.
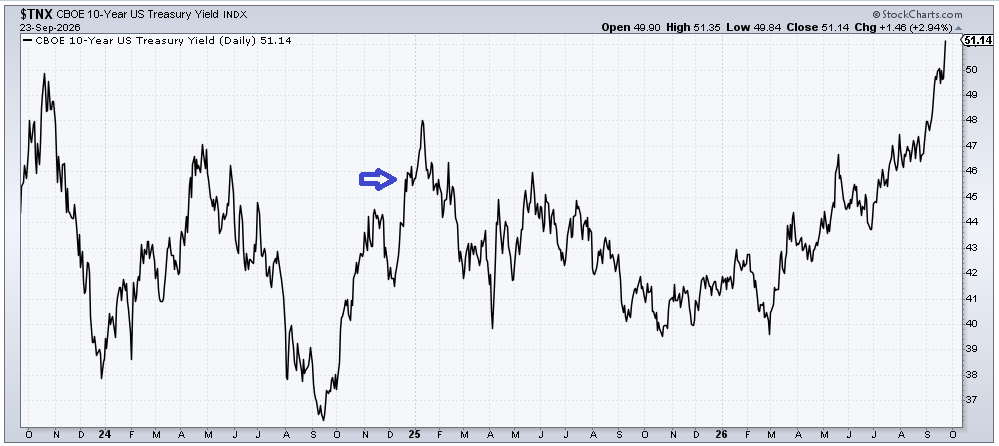
The talk of the day was about bonds. I actually saw one or two folks note the dreaded ‘rate of change’. But ask me if that meant they changed their view on stocks? Nope. No way. Not even close.
When we looked at the yield on the Ten Year a few weeks ago, and I noted the Daily Sentiment Index (DSI) had come down to 9, and I pointed out the last time it had done so, there was still another spurt to the upside in rates (blue arrow on the chart). Today’s DSI is 12, and I can honestly say I don’t know if this was it. But I noticed something else about that time in the market.
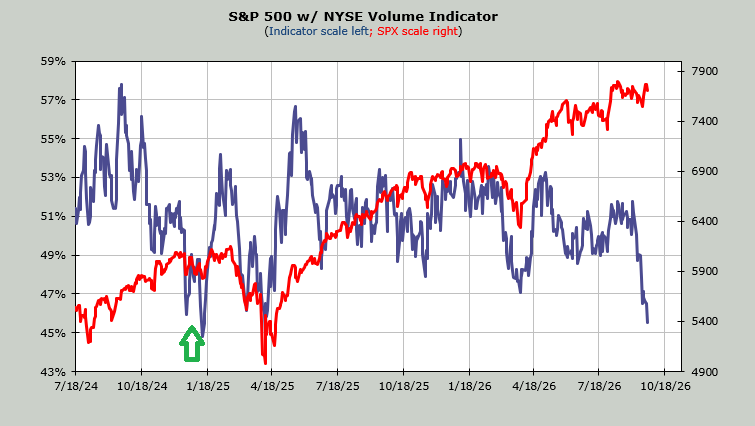
The Volume Indicator is now at 46%, which in bull markets means we’re intermediate-term oversold. In bear markets, it gets down to the 40% area. But look over on the left side of the chart (green arrow), and we see not one but two dips into oversold territory—both while the S&P is still so close to the highs. Quite similar to today.
As a reminder, this intermediate-term indicator does not get oversold because stocks are going up; it gets oversold because they are going down. Notice that we enjoyed a rally, but the rally made a marginal new high, but that was that; it wasn’t great.
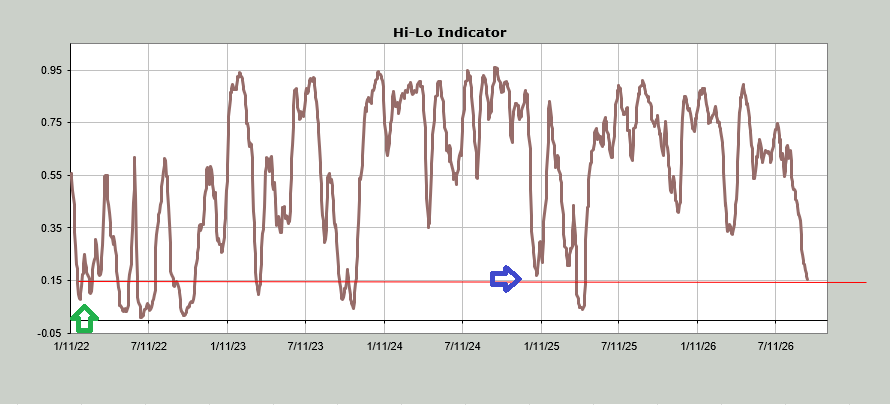
Now take a look at the Hi-Lo Indicator. The one for the NYSE got to .15 today. Under there, and it is oversold. Now notice the blue arrow on the chart. That was that same period in late 2024/early 2025. The green arrow on the left side of the chart was early 2022. But let’s stick with 2025 for now.
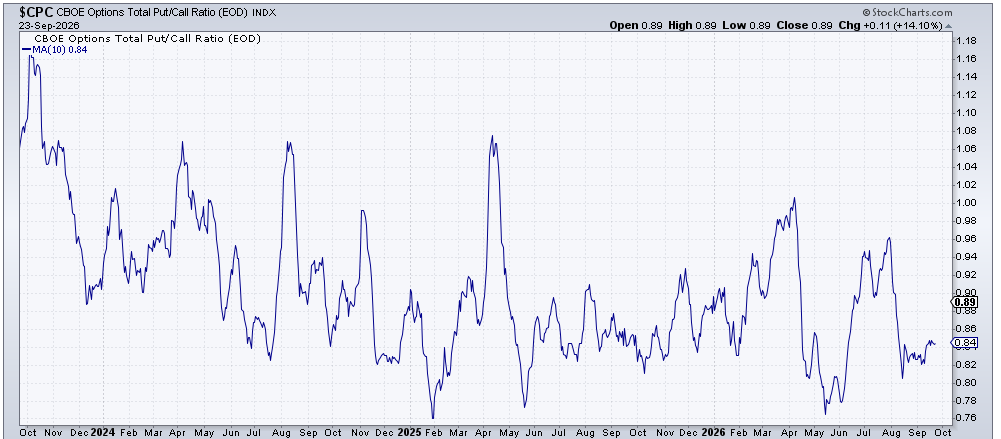
Now let’s look at the ten-day moving average of the put/call ratio from that time. It had a move up in that it went from .82 to .90, which is not bad but not panicky. And as soon as the market started rallying, it sunk like a stone (to .76!). Complacency.
So to recap, we had interest rates heading upward with a single-digit DSI, we had stocks quite oversold, but the S&P not far off its high. The result was a poor rally that gave way to the Tariff Tantrum that took the S&P down 20% before we got a durable low.
I am not one to focus on analogs—mostly because they all seem to end up in a 1929 crash—but I do like to see when the indicators look similar to other periods of time. There are many factors that move markets, but an oversold market that is complacent tends not to give us a durable low.