Inflation Remains Elevated as Real Spending Stalls
September core PCE rises the most since February while real incomes fall.
You've reached your free article limit
You've read 0 of 1 free Pro articles.

- US Core PCE Price Index (M/M) Sep: 0.3% (est 0.3%; prev 0.2%; prev R 0.3%)
- Core PCE Price Index (Y/Y): 3.1% (est 3.1%; prev 3.0%)
- PCE Price Index (M/M): 0.5% (est 0.5%; prev 0.3%)
- PCE Price Index (Y/Y): 3.6% (est 3.6%; prev 3.4%)
- US Core PCE Supercore (Y/Y) Sep: 3.116% (prev 3.044%)
- Core PCE Supercore (M/M): 0.316% (prev 0.278%)
- US Personal Income (M/M) Sep: 0.2% (est 0.3%; prev 0.2%; prev R 0.3%)
- Personal Spending (M/M): 0.5% (est 0.6%; prev 0.9%)
- Real Personal Spending (M/M): 0.0% (est 0.1%; prev 0.6%; prev R 0.5%)
Executive Summary
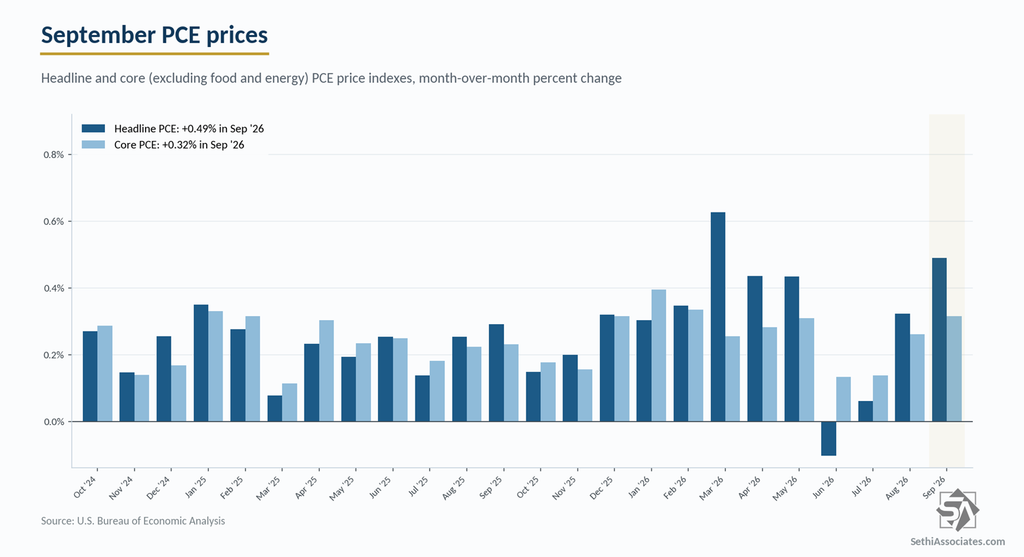
- September core PCE prices rose 0.317% month-over-month, the most since February, in line with the 0.3% estimate, with the year-over-year at 3.12%, the highest since May, also in line, up from 3.03% in August. Headline prices rose 0.49%, the most since March, matching the 0.5% estimate on a 5.36% jump in energy, lifting the year-over-year to 3.649%, the highest since May, from 3.44%, just under the line to round above the 3.6% estimate.
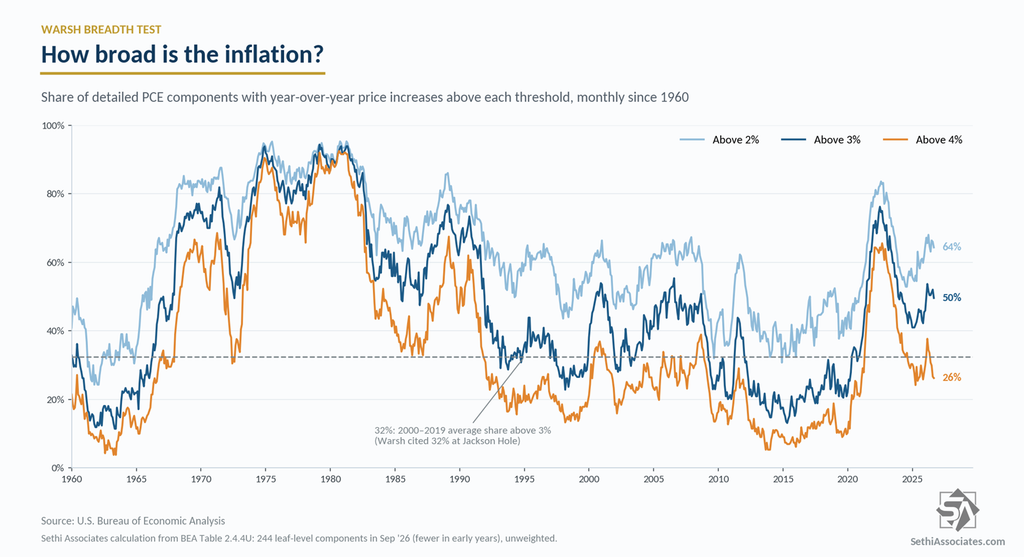
- Running the breadth test from Kevin Warsh’s Jackson Hole keynote across 244 detailed PCE components, 49.6% were up more than 3% year-over-year in September, the least since January, down from 52.0% in August, against a 32% average from 2000 to 2019. The share above 4% eased to 26.2%, the least since November 2025, while 64.3% were above 2%.
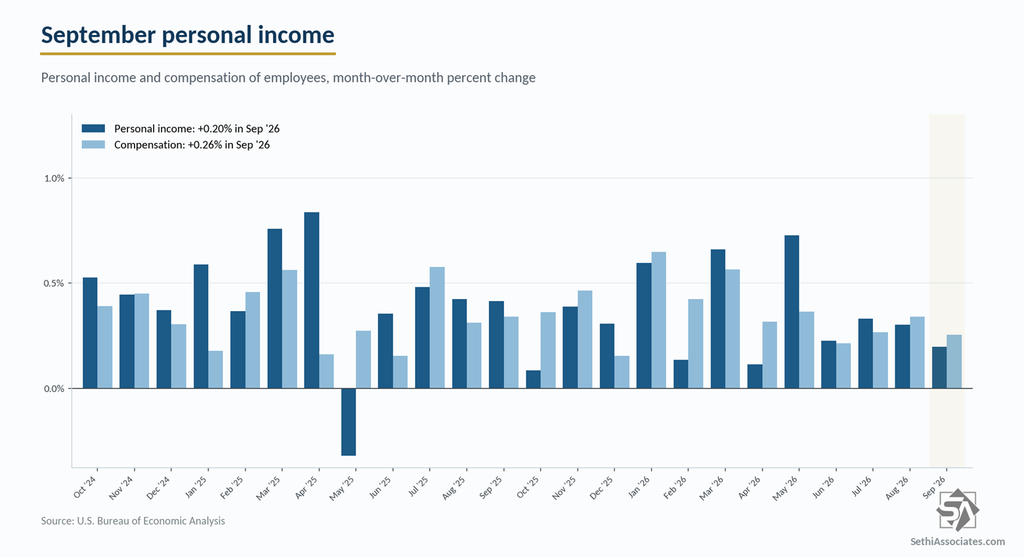
- Nominal personal income rose 0.20%, a tenth below the 0.3% estimate, after an upwardly revised 0.30% in August, but adjusted for inflation real personal income fell 0.29% and real disposable personal income 0.27%, both the weakest since April.
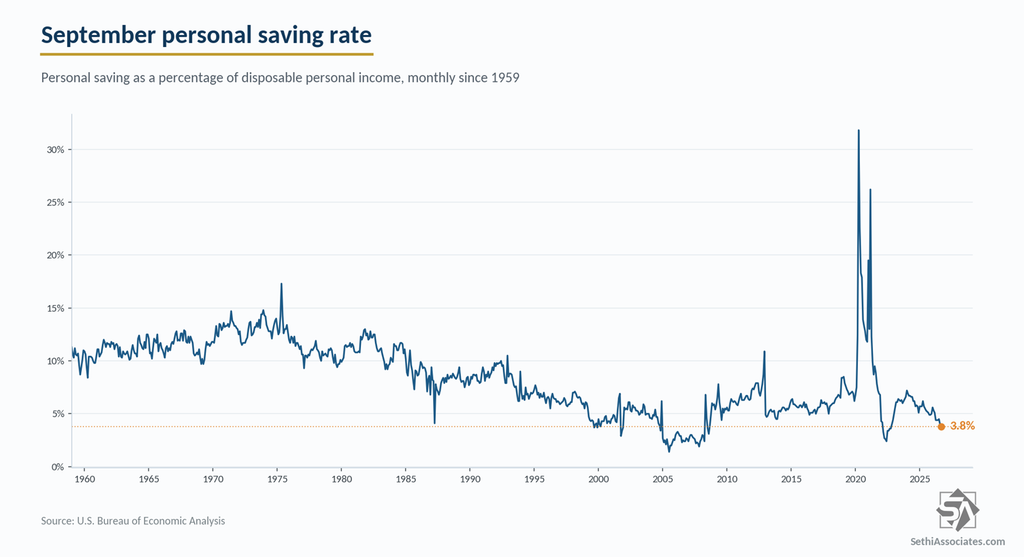
- Nominal spending rose 0.51%, a tenth below the 0.6% estimate, and real spending was essentially flat at 0.02%, the least since January, against a 0.1% estimate, as real goods spending fell 0.30%. The saving rate fell to 3.8%, the lowest since October 2022, from a downwardly revised 4.0%.
This report is our most wholistic look at prices, incomes and spending. I’ll go through them in that order.
PCE Prices
Core (excluding food and energy) September PCE prices came in as expected at 0.3% month-over-month, 0.317% unrounded and the most since February, after an upwardly revised 0.26% in August, while headline rose 0.49%, the most since March, also in line with expectations at 0.5%, after a revised 0.32%.
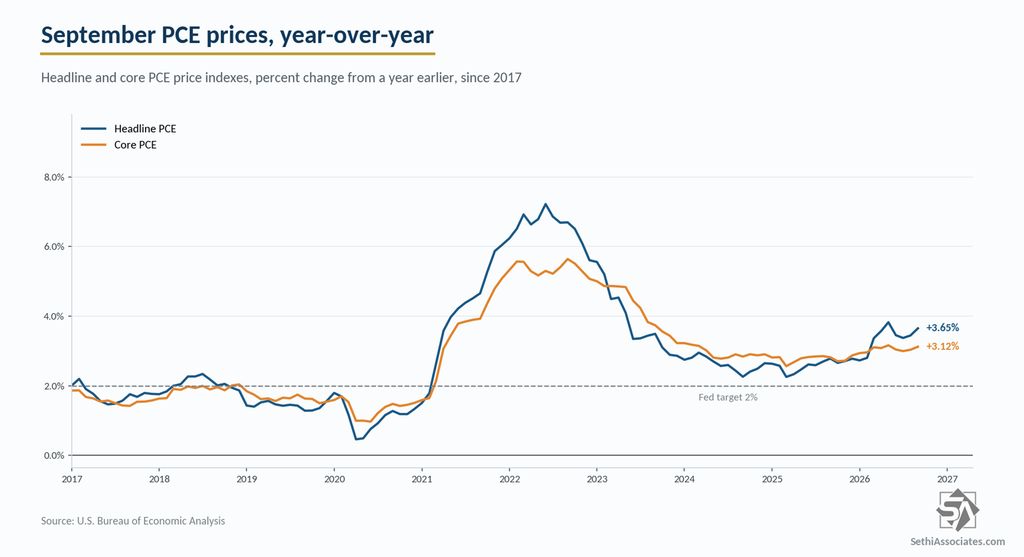
Looking from a year earlier, core rose to 3.12%, the highest since May, in line with the 3.1% estimate, from 3.03% in August, well above the Fed’s 2% inflation target. Headline was 3.649%, also the highest since May, up from 3.44%, in line with the 3.6% estimate but just shy of rounding up to 3.7%.
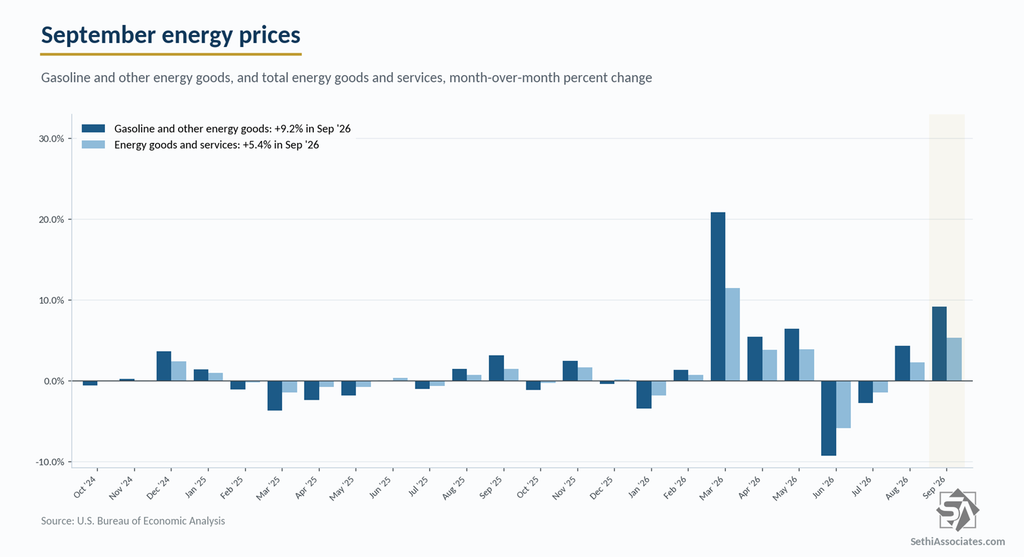
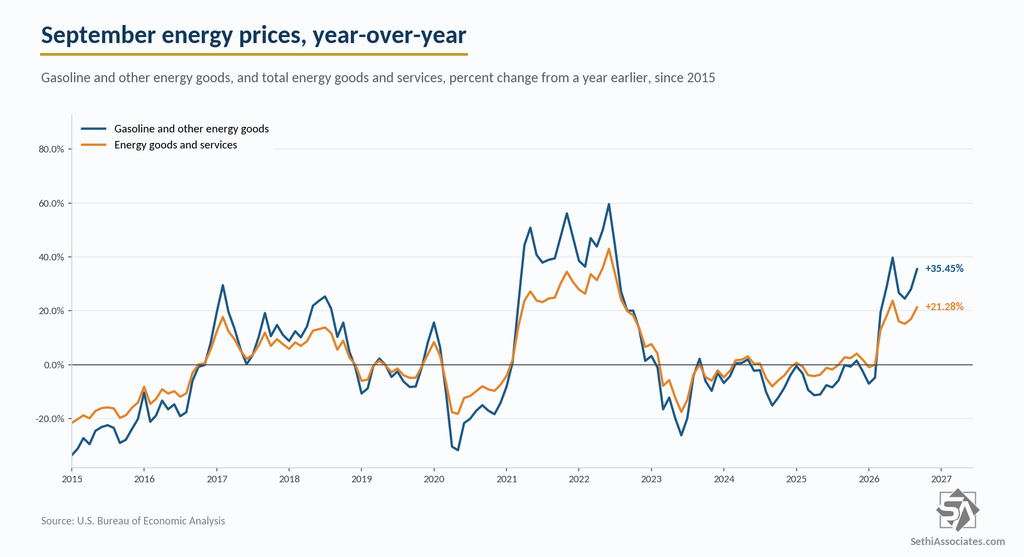
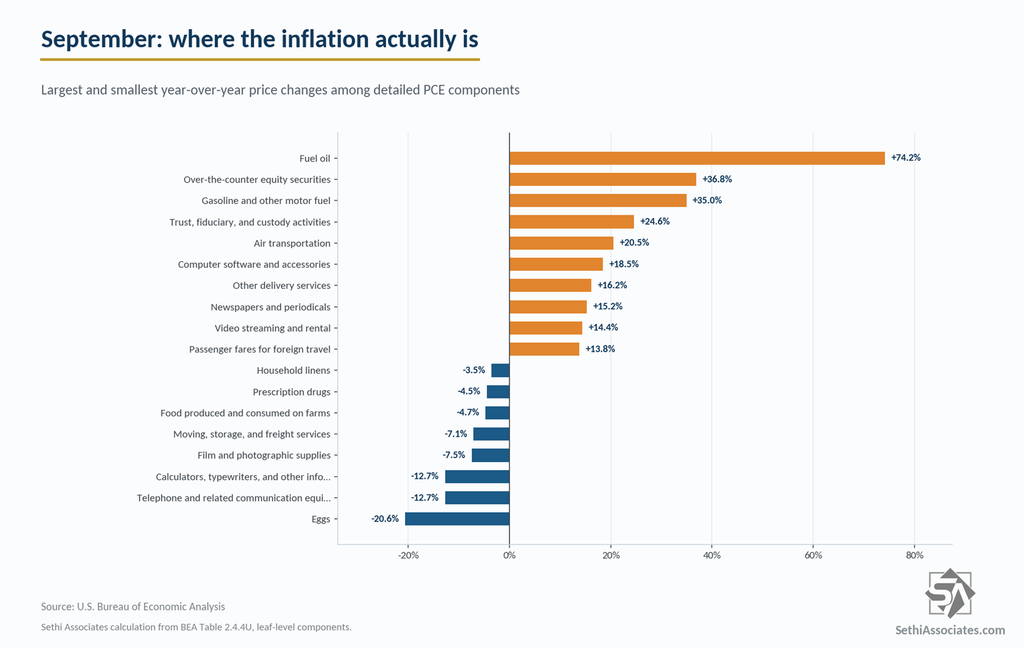
Energy jumped 5.36% month-over-month after 2.30% in August, with gasoline and other energy goods up 9.24% and running 35.45% above a year ago.
Energy goods and services are 21.28% higher year-over-year, the most since May, and the energy price index is at a record high in data back to 1959.
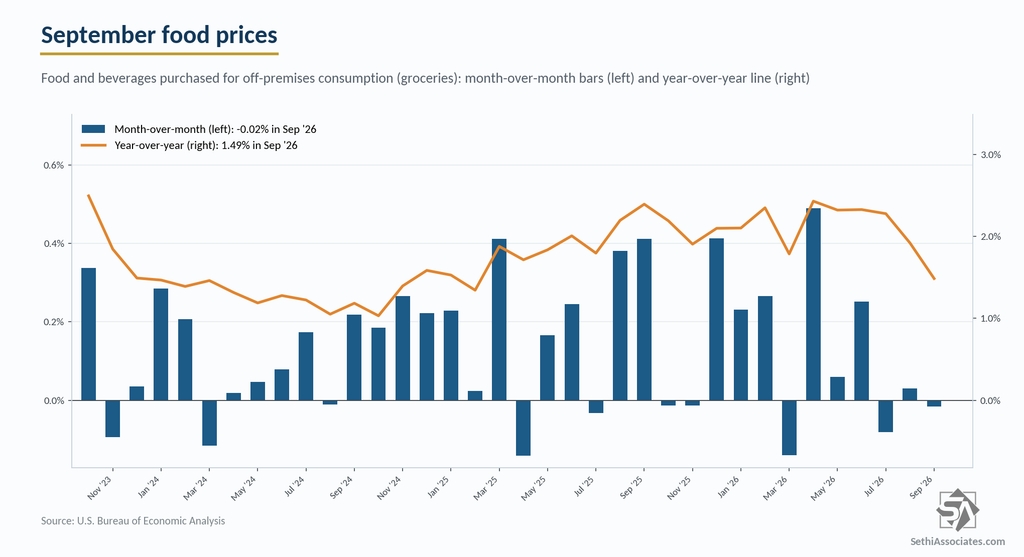
Food prices slipped 0.02% month-over-month and are 1.49% higher year-over-year, the least since February 2025.
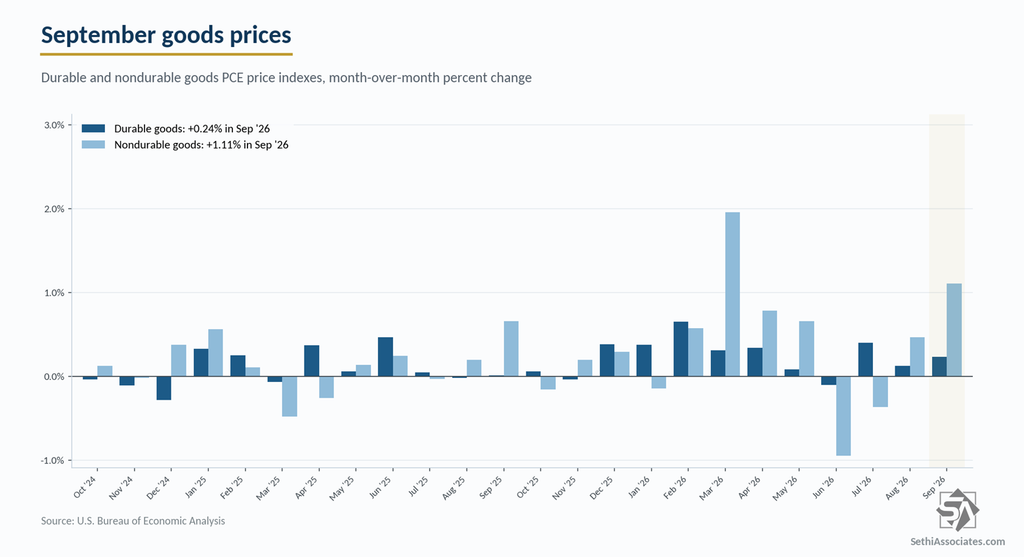
Goods prices rose 0.80% after 0.35% in August. Nondurables (led by petroleum) did most of the work at 1.11%, while durables were 0.24%, with motor vehicles up 0.26%, recreational goods 0.18% and other durables 0.72% against furnishings down 0.01%.
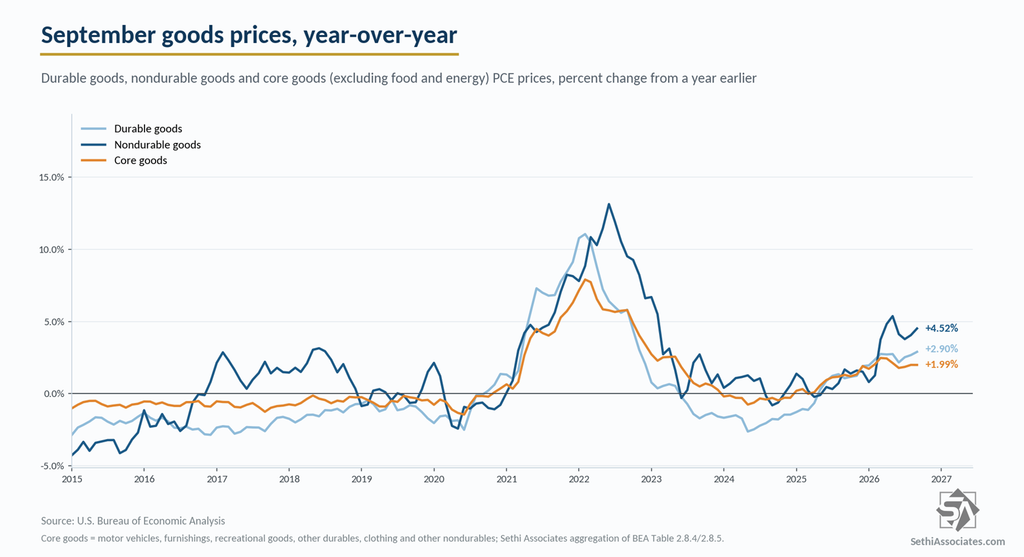
Year-over-year goods prices are 3.95%, with durables 2.90%, the most since November 2022, and nondurables 4.52%. Within durables, recreational goods prices are up 8.37%, the most since April 1975. Core goods prices, excluding food and energy, rose 0.20% month-over-month and are 1.99% year-over-year.
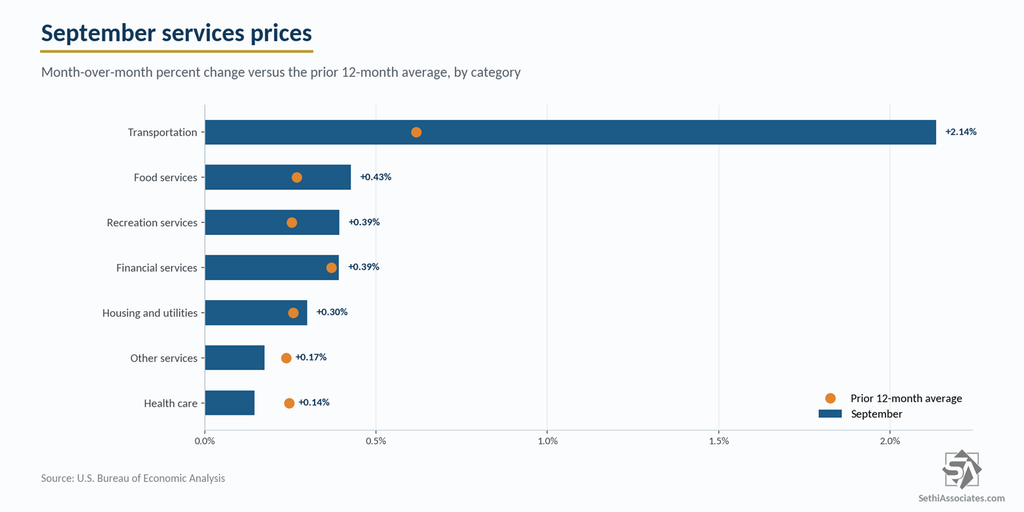
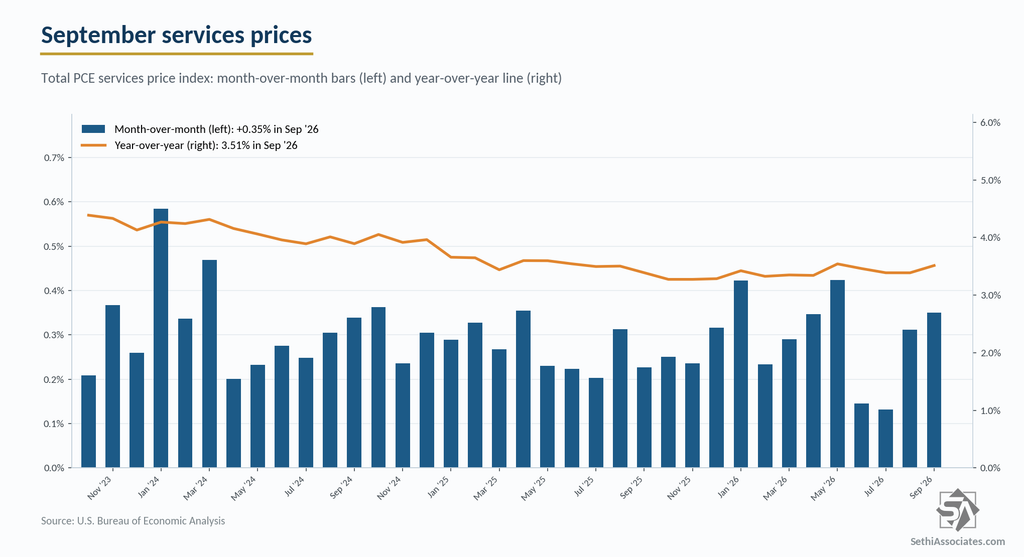
Services prices rose 0.35% after 0.31% in August, led by transportation at 2.14%, food services and accommodations at 0.43%, recreation services at 0.39% and financial services at 0.39%. Housing and utilities were 0.30%, other services 0.17% and health care 0.15%.
Year-over-year services are 3.51%, the most since May, with transportation at 9.21%, the most since March 2023, while financial services slowed to 4.41%, the least since November 2023.
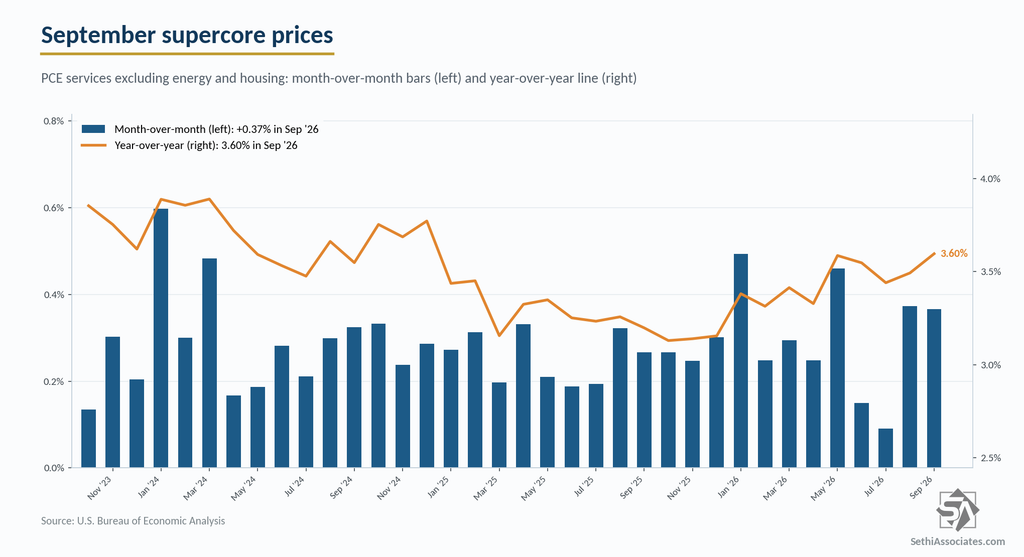
Supercore, core services excluding housing, a metric focused on by the Fed as evidencing underlying inflation pressures, rose 0.316% month-over-month after a revised 0.278% in August, lifting the year-over-year to 3.116% from 3.044%. On the narrower services excluding energy and housing measure (chart), prices rose 0.367% after 0.373%, with the year-over-year at 3.596%, the highest since December 2024.
Running the breadth test from Kevin Warsh’s Jackson Hole keynote across 244 detailed PCE components, 49.6% were up more than 3% year-over-year in September, the least since January, down from 52.0% in August, against a 32% average from 2000 to 2019. The share above 4% eased to 26.2%, the least since November 2025, while 64.3% were above 2%.
Incomes
Turning to incomes, nominal personal income rose 0.20% month-over-month, a tenth below the 0.3% estimate, after an upwardly revised 0.30% in August, with compensation up 0.26% after 0.34%, and private and government wages each up 0.23%. The Bureau of Economic Analysis said the increase “primarily reflected increases in compensation and government social benefits,” and “within compensation, the increase was led by private wages and salaries.”
Looking at other categories, small business income (nonfarm proprietors) rose 0.18% and farm income 0.12% after an upwardly revised 9.85% in August. Rental income added 0.10% and interest income 0.46%, while dividend income fell 0.65%.
Transfer receipts rose 0.28%, with government social benefits also at 0.28%. The increase in government social benefits “was led by Medicare,” per the Bureau of Economic Analysis, which rose 0.84% and is up 10.74% year-over-year, the most since December 2006. Social Security rose 0.17%, while Medicaid fell 0.16% and is up 2.16% year-over-year, the least since March 2020. Affordable Care Act-linked other government benefits fell another 0.09% and are down 9.84% from a year ago. Personal taxes rose 0.05%, leaving nominal disposable personal income up 0.22%.
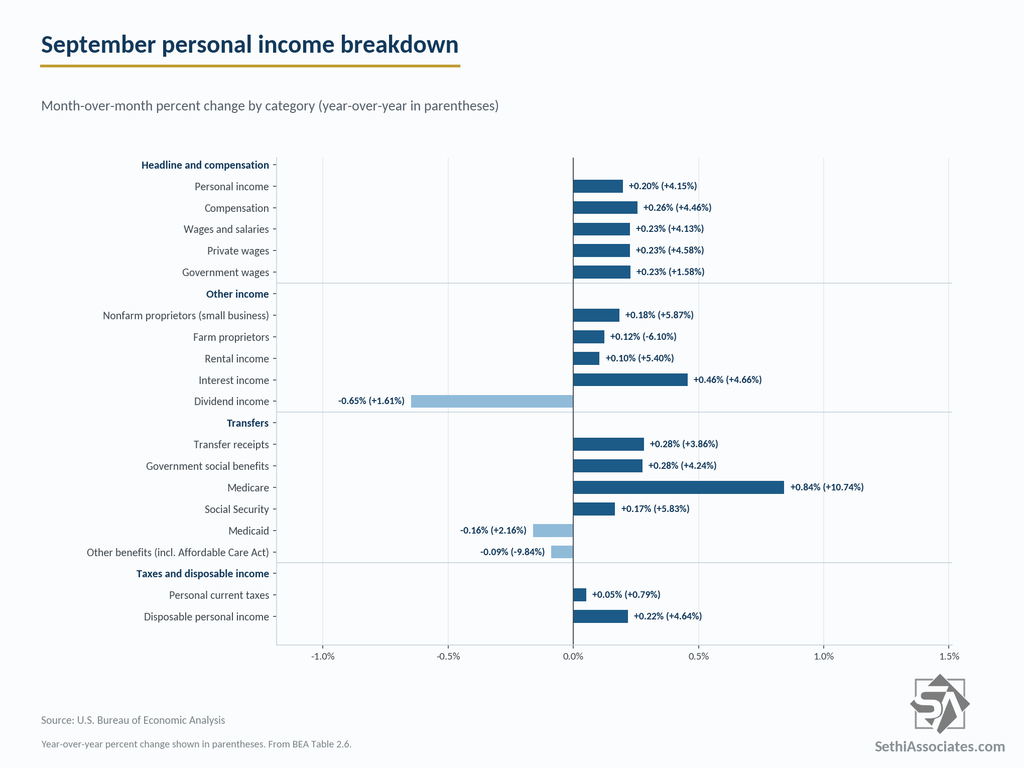
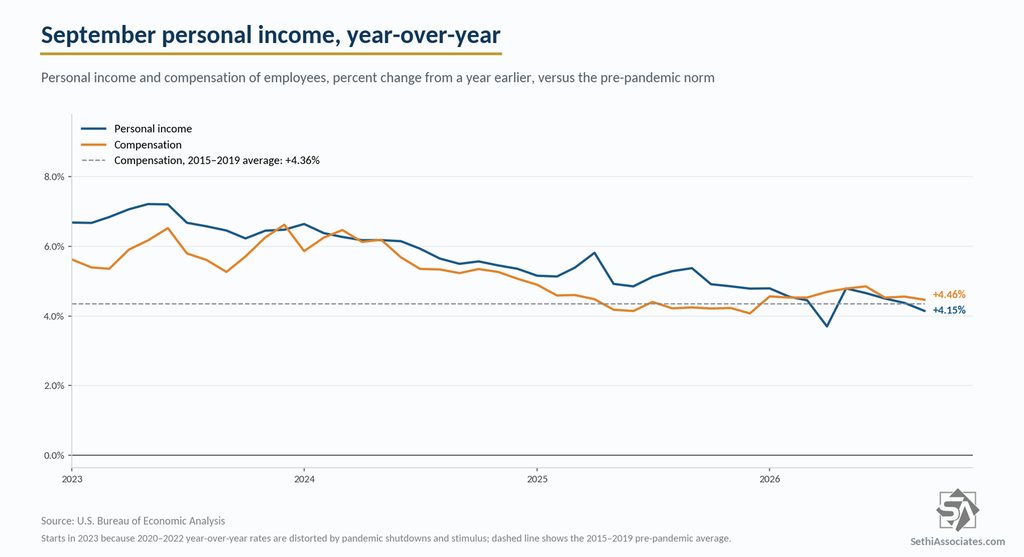
Looking year-over-year, nominal personal incomes are 4.15%, the least since April, and compensation 4.46%, the least since December 2025, with private wages 4.58% and government wages 1.58%.
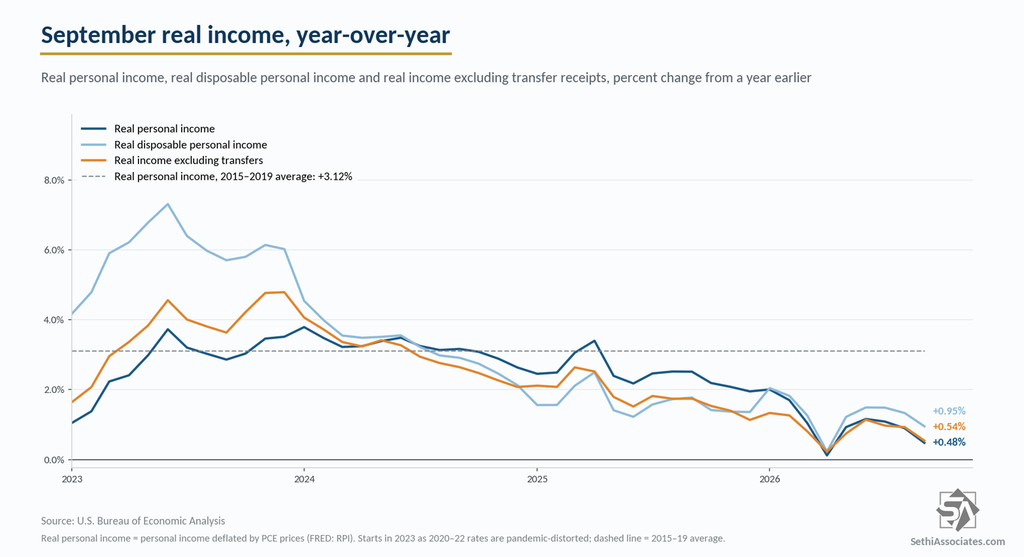
Adjusted for inflation though, incomes fell month-over-month, with real personal income down 0.29%, real disposable personal income down 0.27% and real personal income excluding transfer receipts down 0.31%, all the weakest since April.
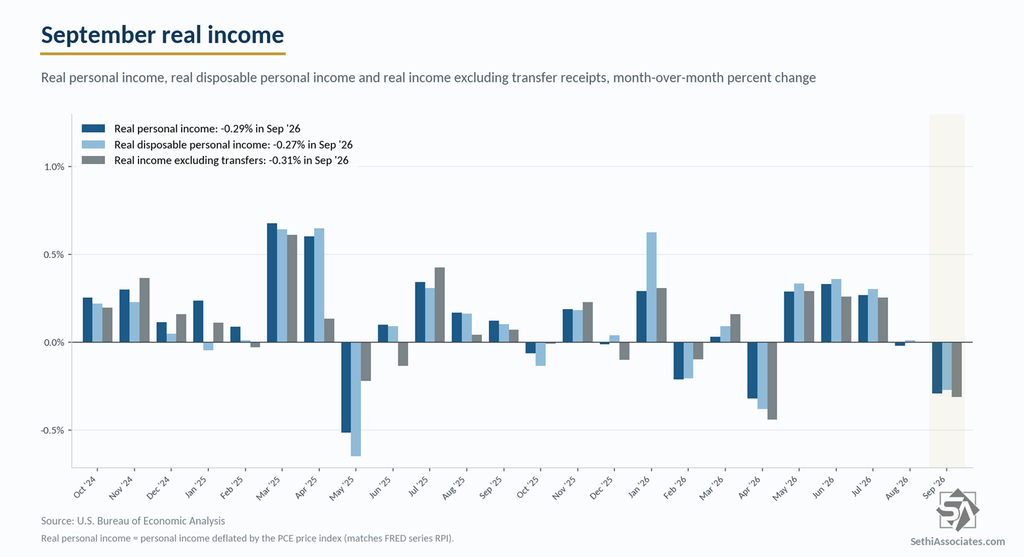
On a year-over-year basis the three stand at 0.48%, 0.95% and 0.54%, all the least since April, down from 0.90%, 1.33% and 0.93% in August.
Spending
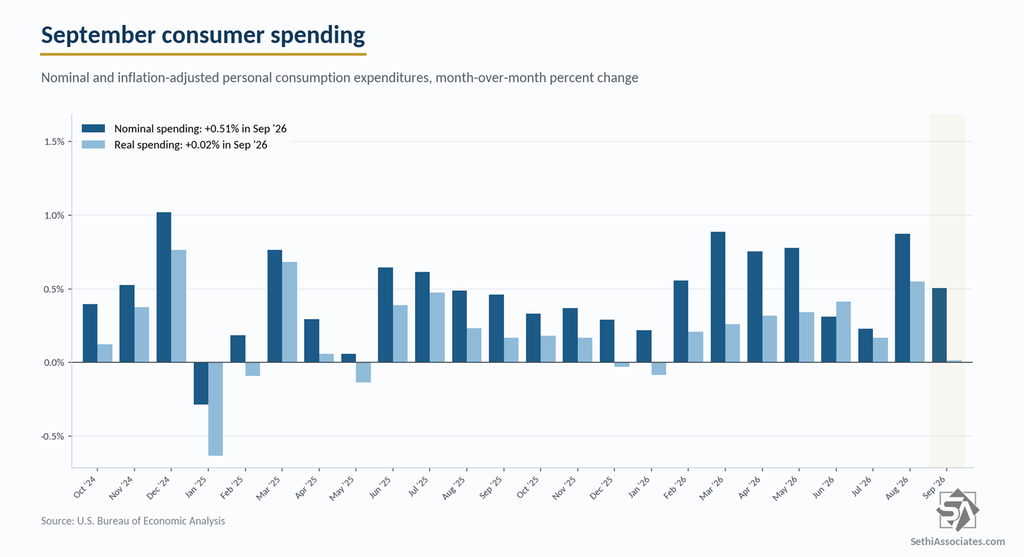
Turning to spending, personal spending rose 0.51% month-over-month nominally, the least since July, a tenth below the 0.6% estimate, but after an upwardly revised 0.87% in August. Per the Bureau of Economic Analysis, the increase “reflected increases of $35.1 billion in spending on goods and $78.1 billion in spending on services,” led by gasoline and other energy goods at $45.7 billion, transportation services at $18.4 billion and housing and utilities at $17.8 billion, while motor vehicles and parts subtracted $14.0 billion.
In real terms (inflation adjusted) though spending rose just 0.02%, the least since January, against a 0.1% estimate, after 0.55% in August.
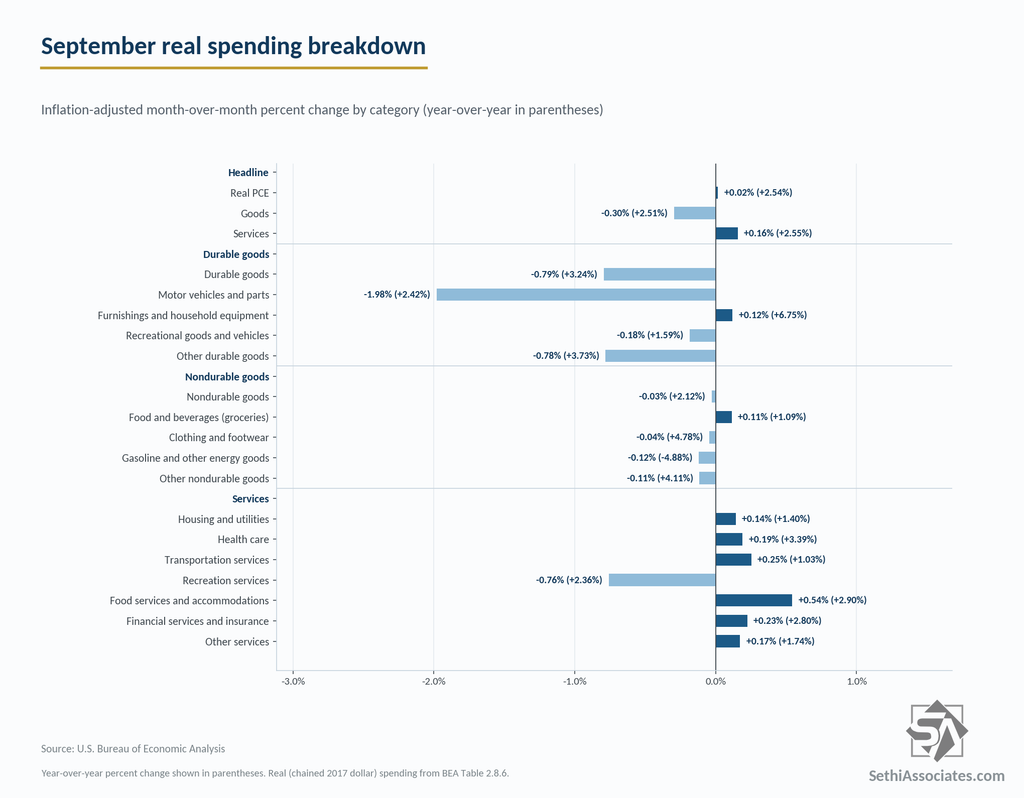
Real goods spending fell 0.30%, with durables down 0.79%, including motor vehicles down 1.98%, other durables 0.78% and recreational goods 0.18%, against furnishings up 0.12%. Nondurables slipped 0.03%, with groceries up 0.11% against gasoline volumes down 0.12%, other nondurables down 0.11% and clothing down 0.04%.
Real services rose 0.16%, with food services and accommodations at 0.54%, transportation 0.25%, financial services 0.23%, health care 0.19%, other services 0.17% and housing and utilities 0.14%, against recreation services down 0.76%.
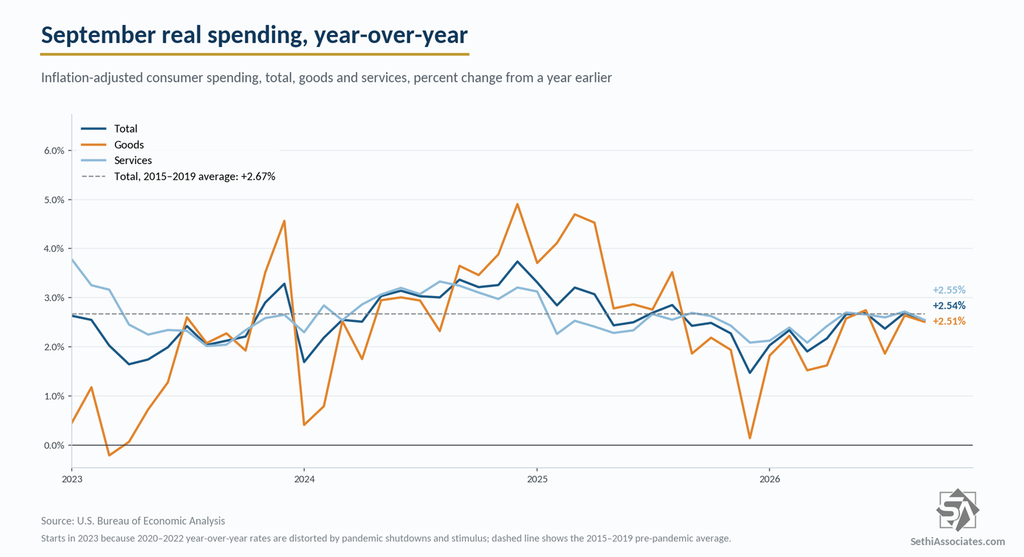
On a year-over-year basis headline consumption rose to 6.28%, the most since May, but real consumption fell to 2.54%, the least since July, with real goods at 2.51% and real services at 2.55%.
Within real goods, durables are up 3.24% spending on durables are 3.24%, with furnishings at 6.75%, other durables 3.73%, motor vehicles 2.42% and recreational goods 1.59%, while nondurables are 2.12% with gasoline volumes down 4.88%. Within real services, health care is 3.39%, food services 2.90%, financial services 2.80%, recreation services 2.36%, other services 1.74%, housing 1.40% and transportation 1.03%.
Saving Rate
The saving rate fell to 3.8% in September, the lowest since October 2022, from a downwardly revised 4.0% in August (originally 4.1%), with July revised to 4.5% from 4.6%.
Analyst Commentary
Bloomberg noted the September data “showed real personal spending stalled as the third quarter drew to a close,” with inflation-adjusted spending “little changed in September after an outsize increase the month before.” It added that “with the Fed’s preferred inflation gauge at 3.6% as of September, well above the central bank’s 2% goal, investors expect policymakers to raise interest rates at their December meeting.”
ZeroHedge said the jump in crude prices smashed “PCE Energy to record highs” and noted that “acyclical inflation is now hotter than cyclical,” adding: “In other words, inflation is becoming embedded.” On incomes and spending, ZeroHedge said “spending is accelerating while wage growth is decelerating,” which “dragged Americans’ savings rate tumbling to its lowest since Oct 2022… This is not good news… at all!”
Jim Bianco, president of Bianco Research, told the Financial Times “the more interesting number is the inflation number, which was hotter than expected . . . I’ll revisit my question from yesterday: why didn’t the Fed hike rates again?”
Reuters said “households also have been saving less and dipping into their nest eggs to fund spending. With average gasoline prices still above $4 a gallon as the US-Israeli war with Iran drags on, economists anticipated a slowdown in consumer spending.”
The Wall Street Journal pointed out that with consumer-price growth up and wage growth down, “average real hourly earnings have fallen for six straight months,” and “lower-income Americans, who tend to spend a bigger share of their income on gasoline, have been particularly hurt by rising fuel prices.”
All data from the Bureau of Economic Analysis; charts by Sethi Associates.