In 2024, the Trend Has Been Pullbacks to Kick Off Each Quarter
The first three-quarters of the year each had some sort of pullback at the beginning. Why should Q4 be any different?
You've reached your free article limit
You've read 0 of 1 free Pro articles.
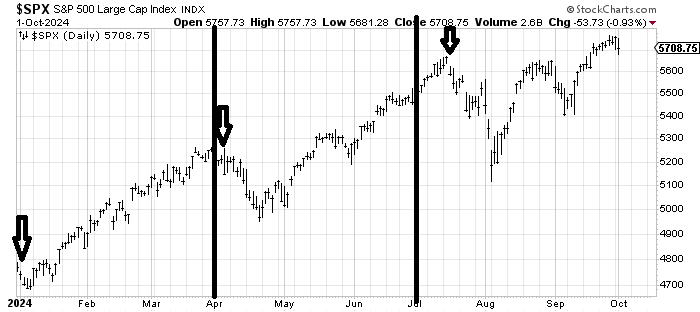
We began the first quarter of the year on a down note. We began the second quarter of the year on a down note. Only the third quarter began on an up note and that lasted two weeks before that turned south as well.
We looked at the market on a quarterly basis a week ago but let’s do it again. January’s decline lasted a week. April’s lasted three weeks, and July spent almost the whole quarter doing a back and forth dance. In other words, we’ve had no quarters this year that saw ‘nothing but up’ starting on Day One. They all had some sort of pullback. I doubt this one will be different.
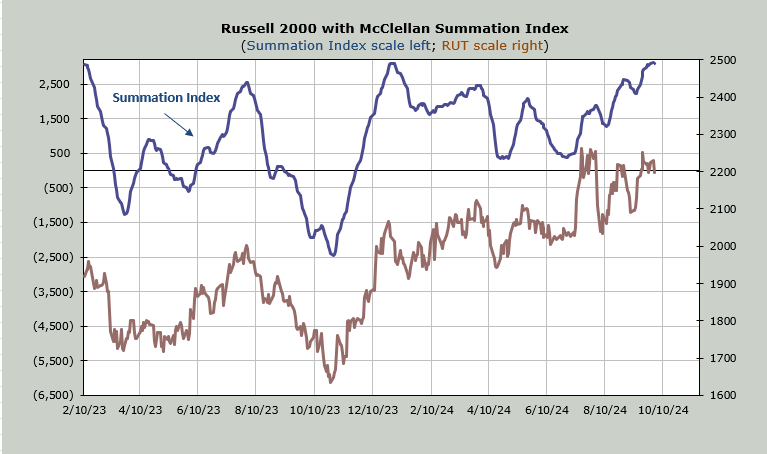
We’ve got the McClellan Summation Index trying desperately to turn down. It now needs a net differential of +700 advancers minus decliners on the NYSE to turn back up.
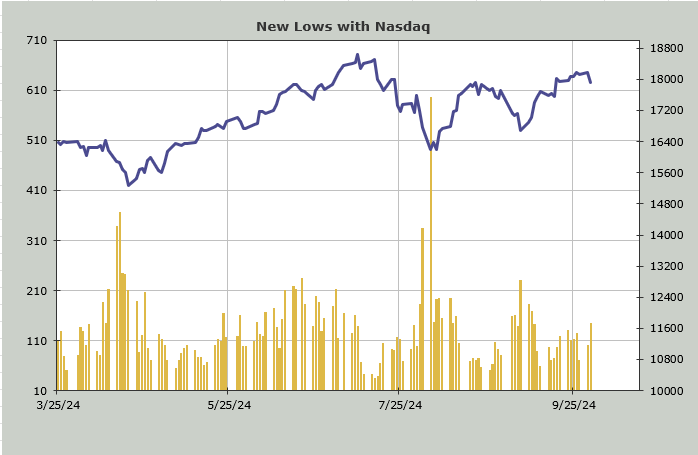
The Hi-Lo Indicator, which I showed here yesterday has turned south. And while the NYSE did not see a marked increase in stocks making new lows on Tuesday, Nasdaq’s new lows continue to expand. I will not rationalize an indicator but it is pretty standard for new lows to expand this time of the year as we see tax loss selling take effect.
We discussed sentiment in full yesterday, so just to review quickly: the put/call ratio’s ten-day moving average lines are all low and beginning to turn back up. Since there was not much selling and not much panic during Tuesday’s decline, the put/call ratio did not rise much and stayed subdued at .88.
We should, however, take a closer look at the Overbought/Oversold Oscillator today. The NYSE still has quite a way to go until it is oversold. Nasdaq on the other hand, has already slipped under the zero line.
That doesn’t make it oversold, although it is further along than the NYSE. Recall this is the ten-day moving average of net breadth, so we look back ten days to see what sort of numbers we are dropping. For five of the last ten trading days, (for Nasdaq) breadth has been red. Thus, it’s more chop than oversold.
The NYSE has had four days in the last ten that have seen breadth red (breadth has been very good on the NYSE and continues to be). That’s why this indicator is not close to oversold.
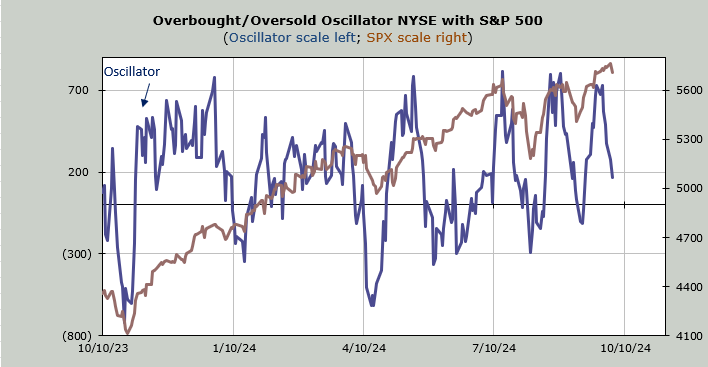
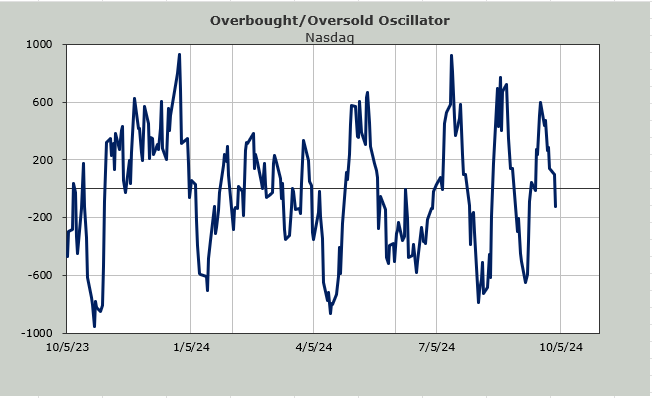
Then there is the 30-day moving average of the advance/decline line, a more intermediate-term Oscillator. It has done a good job of coming off the overbought level, but it, too, is not close to being oversold.
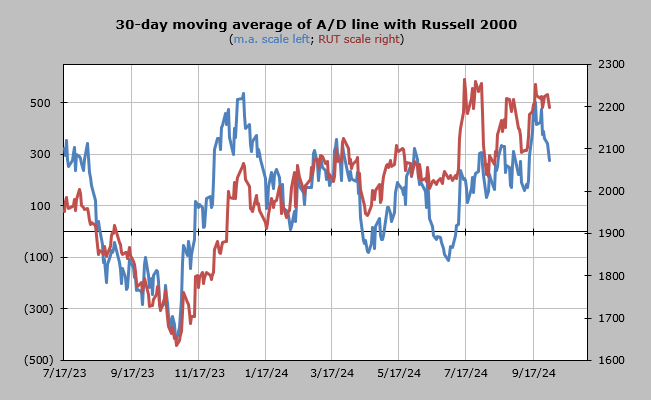
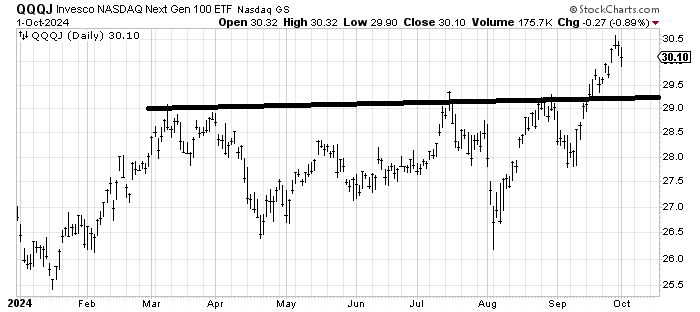
That probably means Nasdaq should begin to show signs of oversoldness first (when we get there). That is why I will continue to watch the chart of QQQJ, an etf for the Junior or Next Gen QQQs. I keep looking for a pullback toward that 29-ish level.
It would be nice if we can get back to an oversold condition and get some fear back in this market with this chart around 29. I hope that is not asking too much.