Deep Dive into an August Employment Report That Blows Past Expectations
A thorough look at the latest labor data, which stunned with the biggest beat of the year.
You've reached your free article limit
You've read 0 of 1 free Pro articles.

This post looks at the big picture of the Employment Situation report with a focus on jobs and incomes. My favorite metric for the economy from this report is at the end of this piece (aggregate weekly payrolls or total private worker take-home pay), so be sure you get down to it.
As a reminder, there are two surveys in the Employment Situation release. One is the more familiar survey of employers that asks how many people they paid in the survey week (this is where the headline “jobs” number and wage and workweek information come from). The other is a survey of households where they ask if people had a job in the survey week and other similar questions (if no job were they looking for work, etc.). Because of the different populations surveyed and the different question there can be very different answers. The household survey has a smaller survey size so is much more volatile. Many also consider it less reliable.
Executive Summary
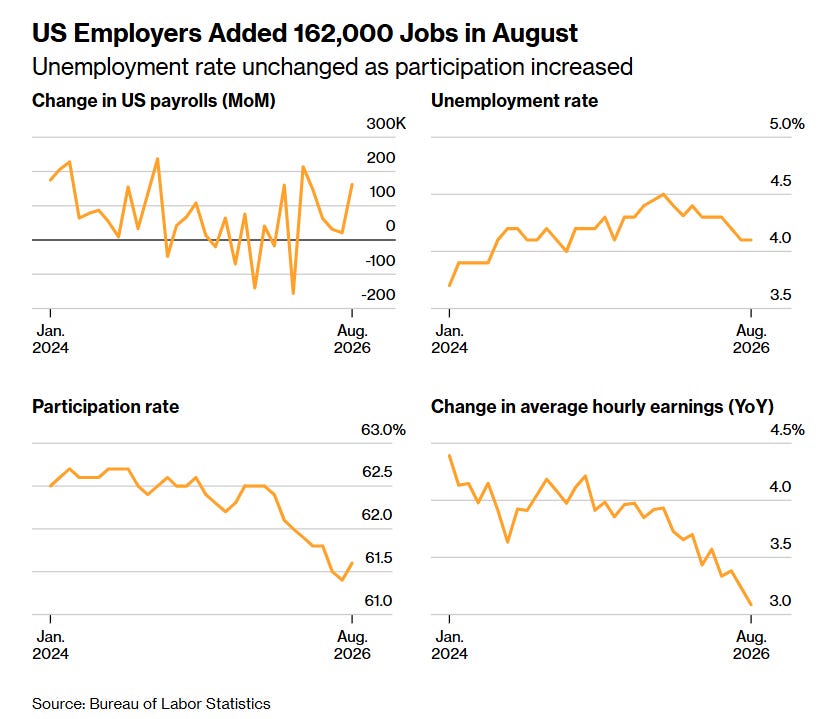
August payrolls surged +162,000, nearly three times the +55,000 expected and above every one of the 76 estimates in a Bloomberg survey — a 4-sigma beat, the biggest of the year — and more than five times the +31,000 average monthly gain of the prior 12 months. Revisions added +55,000. The three-month average rose to +71,000 and the six-month to +107,000.
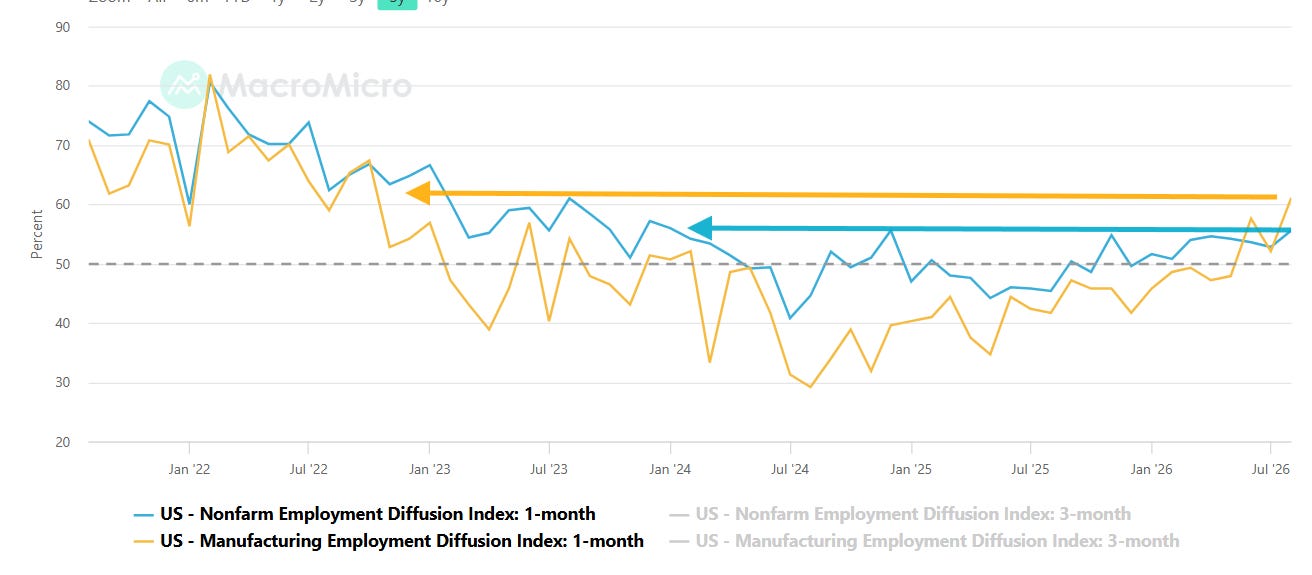
Fueling the NFP beat were reversals: food services and drinking places +59,000 (after -17,000 over the prior two months) and local government education +42,000, offsetting July’s -58,000. But the strength was broader than that — Goods-producing +41,000 with Manufacturing +16,000, the most since 2023, and Construction +22,000, the most since January— with the diffusion index jumping to 55.6%, the best since December 2024, and manufacturing to 61.1%, the best since October 2022.
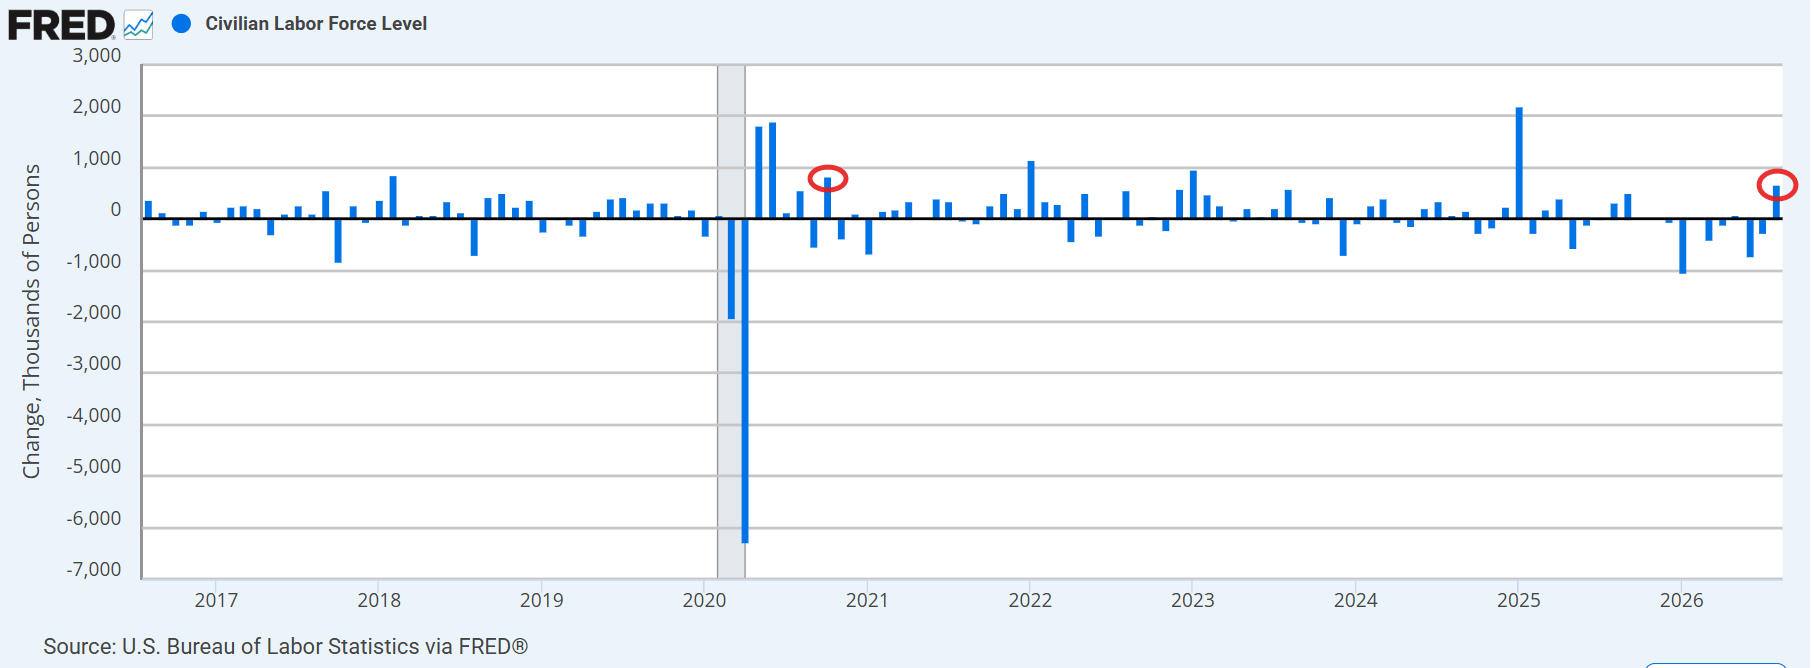
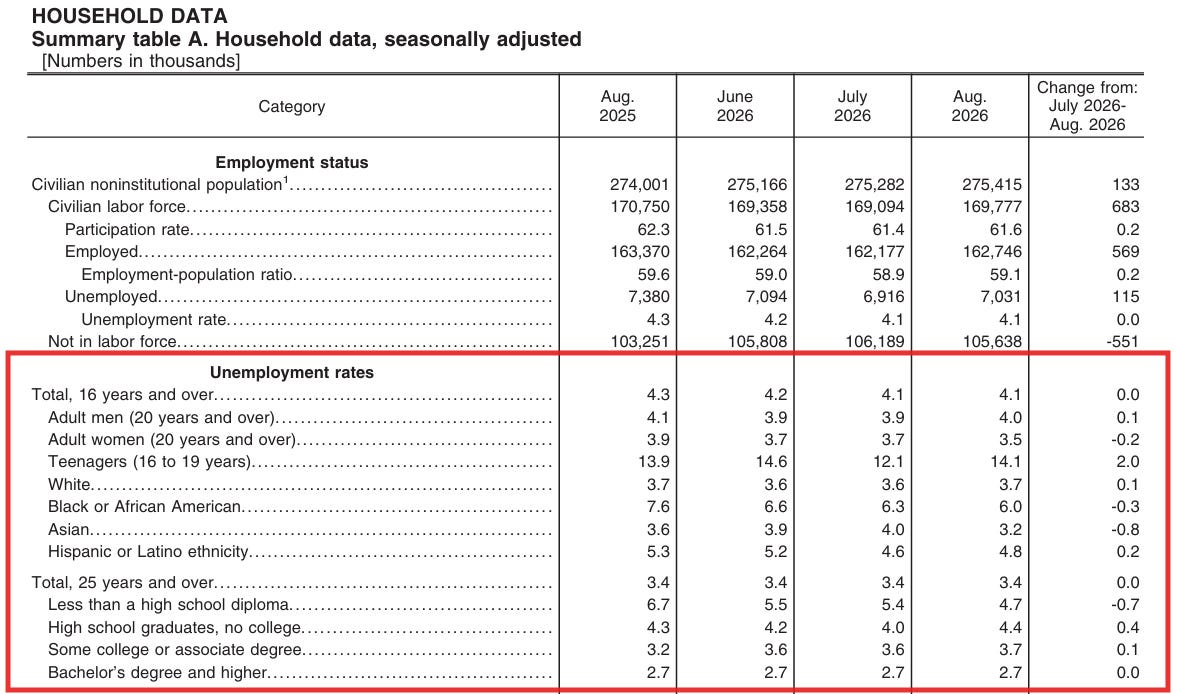
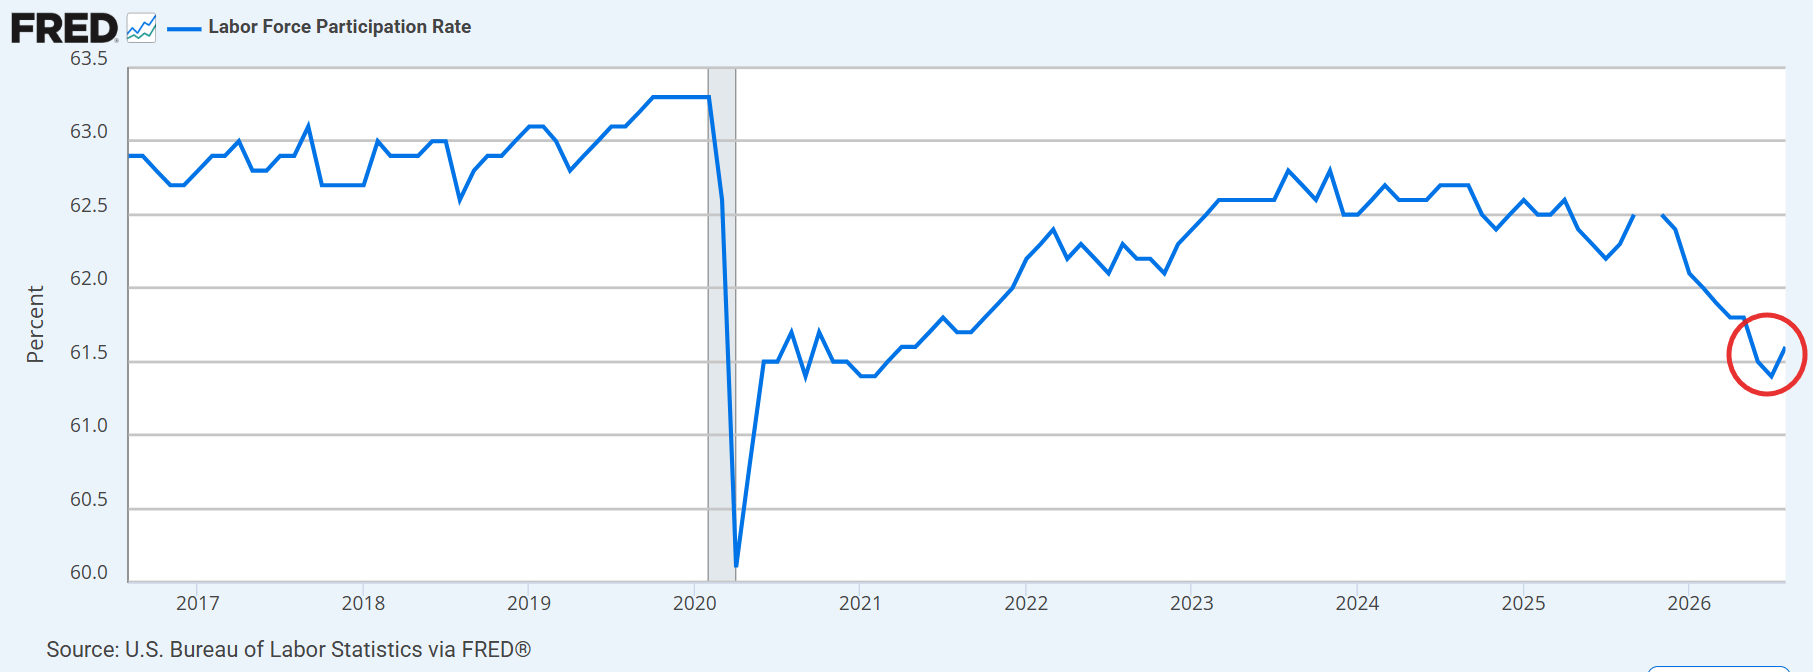
The household survey was also a standout, with employed rising +569,000, the best since November 2023 outside the January benchmark revision, and the labor force jumping +683,000, the largest jump since October 2022 outside of a benchmark revision. Participation rose to 61.6%, the first improvement in almost a year.
Full-time jobs +735,000, the most since December 2025 and the first gain in five months, part-time for economic reasons fell -414,000 to 4.39 million, the lowest since June 2024, and the U-6 rate dropped to 7.7%, the lowest since June 2025. The unemployment rate held at 4.1% (4.14% unrounded, up from 4.09%).
Some exceptions to the strength: Information -23,000, its worst month of the year, now down -370,000 from its November 2022 peak to the least since December 2020, while Financial Activities -11,000 is down -125,000 from its May 2025 peak to the least since July 2022. Health care +13,000 came in well below its +32,000 12-month average.
On incomes, the workweek rose one-tenth to 34.4 hours, the highest since March 2024, and average hourly earnings +0.27% month over month pushing aggregate weekly payrolls (total worker take-home pay) +0.67% month over month, the best since January, with the year over year at +4.34%, also the best since January — though the real figure was just +0.36% year over year as of July.
Now, let’s take a deeper look with lots (and lots) more details, metrics, charts and analyst commentary.
Employer’s Survey
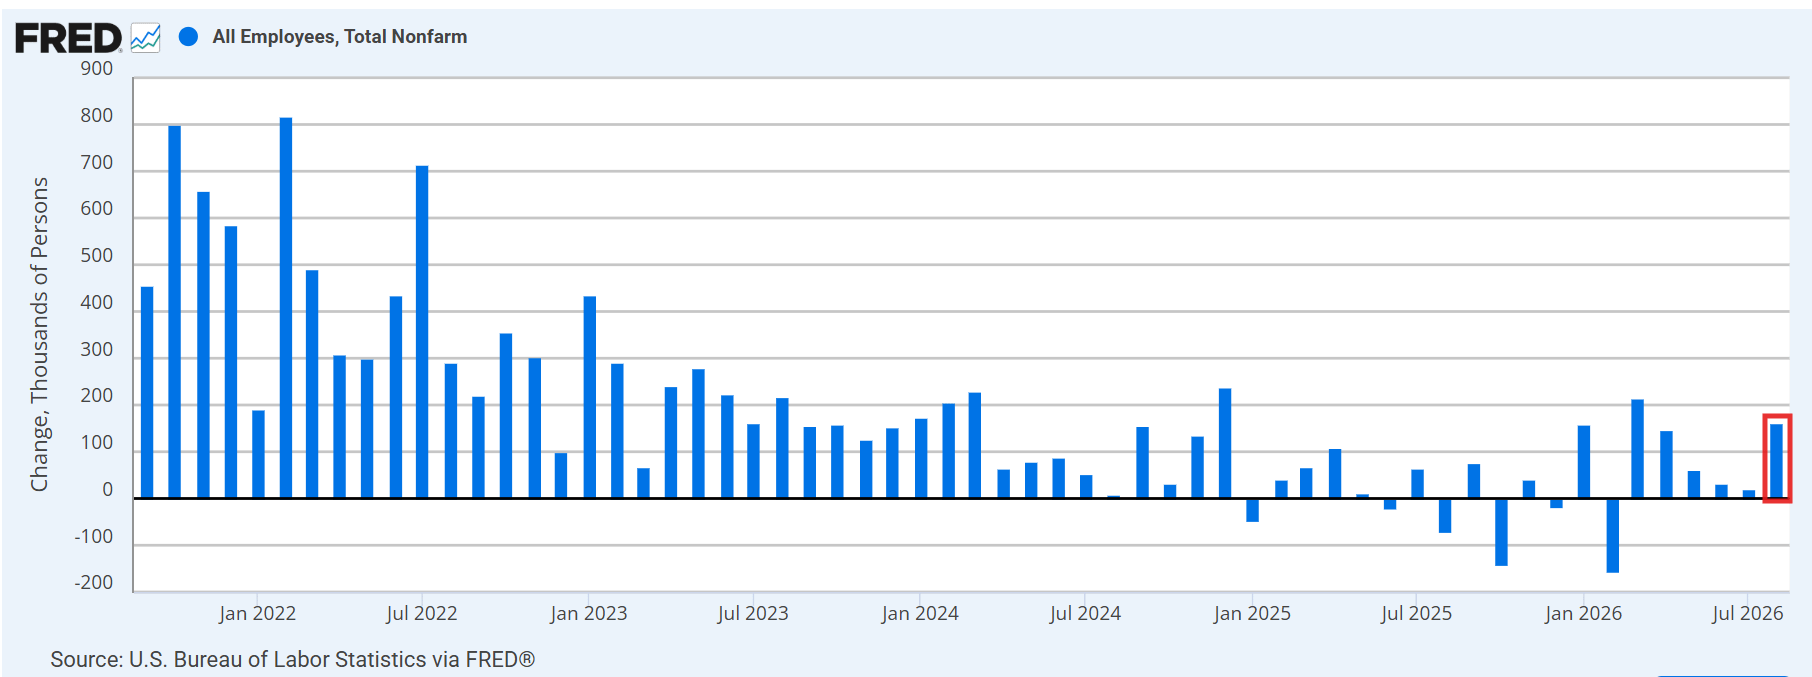
From the employer survey, August nonfarm payrolls rose +162,000, nearly three times expectations for +55,000 (in fact, above every one of the 76 estimates in a Bloomberg survey [highest +125,000]) — a 4-sigma beat according to Zerohedge, the biggest of the year. It was the second largest monthly gain of 2026 behind only March and more than five times the +31,000 average monthly gain of the prior 12 months.
Revisions were favorable, adding +55,000, with June revised up +11,000 to +31,000 and July up +44,000 to +21,000, meaning July’s headline job loss has been revised away. The three-month average rose to +71,000 from a revised +38,000, and the six-month average to +107,000. For the year, payrolls have averaged roughly +60,000 per month — a figure Federal Reserve Governor Waller cited Thursday — while private-sector hiring has averaged +84,000 per month in 2026, the fastest pace in more than two years.
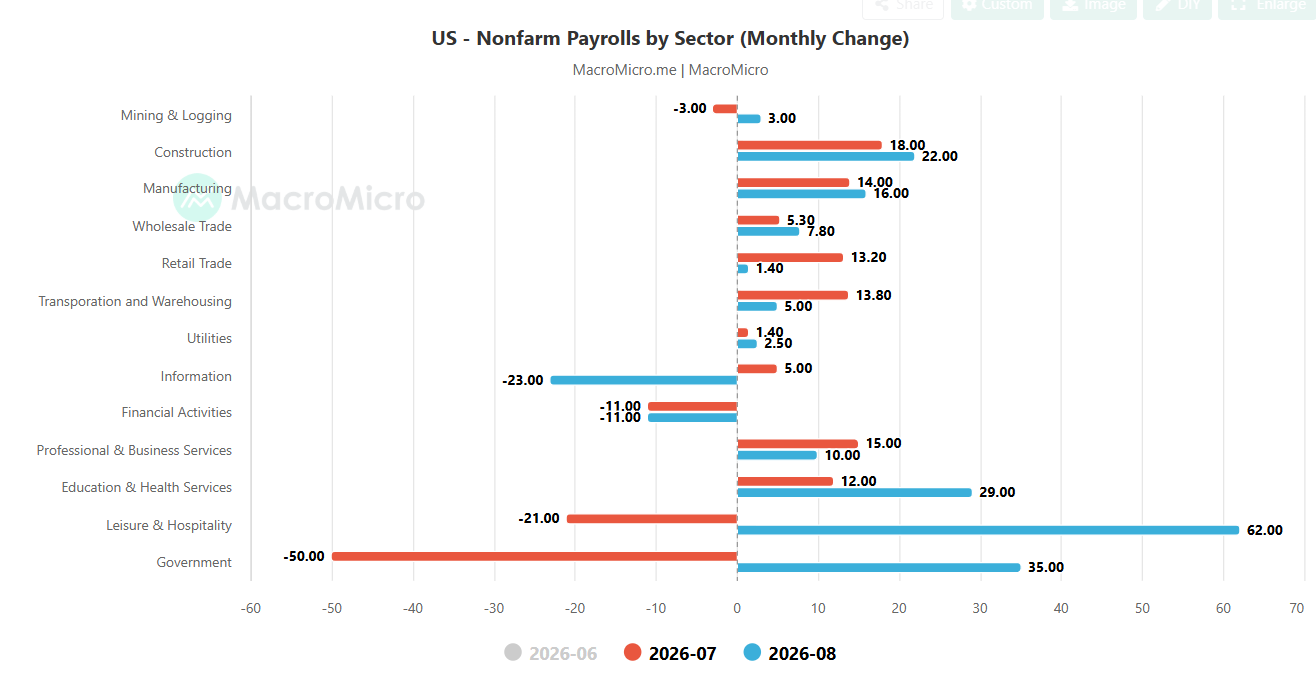
In looking at the composition, Services sectors added +86,000 after +42,000 in July, with the gain heavily concentrated in one category as we’ve often seen, but this month, it was not healthcare.
- Leisure & Hospitality jumped +62,000 after -21,000 in July, with the gain almost entirely in food services and drinking places +59,000. The gain was well above the +12,000 average of the prior 12 months, and follows -17,000 over the prior two months.
- Health care and social assistance added +28,000 combined, but healthcare at +13,000 was well below its +32,000 prior 12-month average, with home healthcare services +11,000 and hospitals +8,000. Social assistance +16,000. Healthcare has been a primary pillar of hiring the past two years.
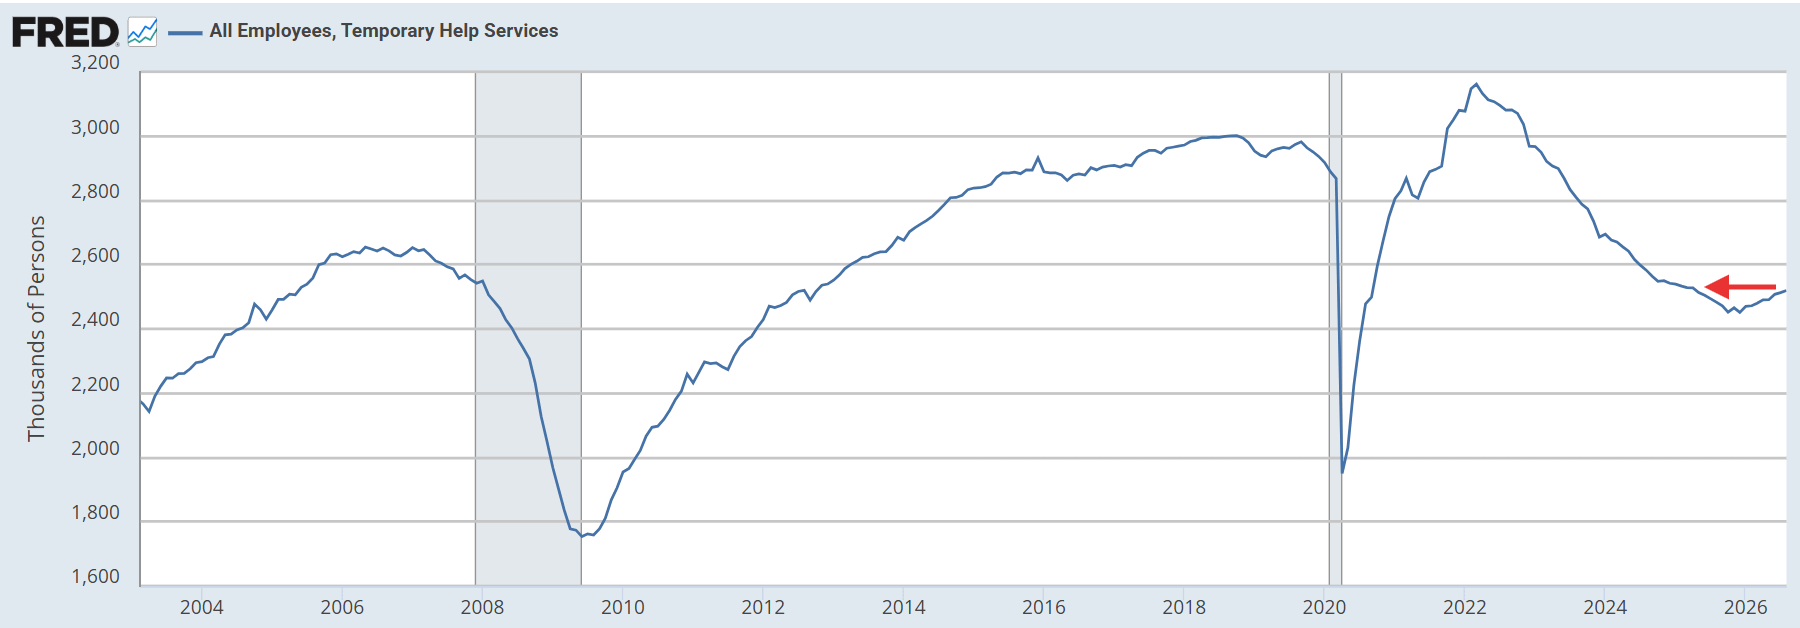
- Professional & Business Services added +10,000 after +15,000 in July, with temporary help services +6,800 to the highest since April 2025 (chart), a leading indicator that has now risen four straight months.
- Wholesale Trade was +8,000 and Transportation & Warehousing +5,000, while Retail was little changed at +1,000 after +13,000 in July.
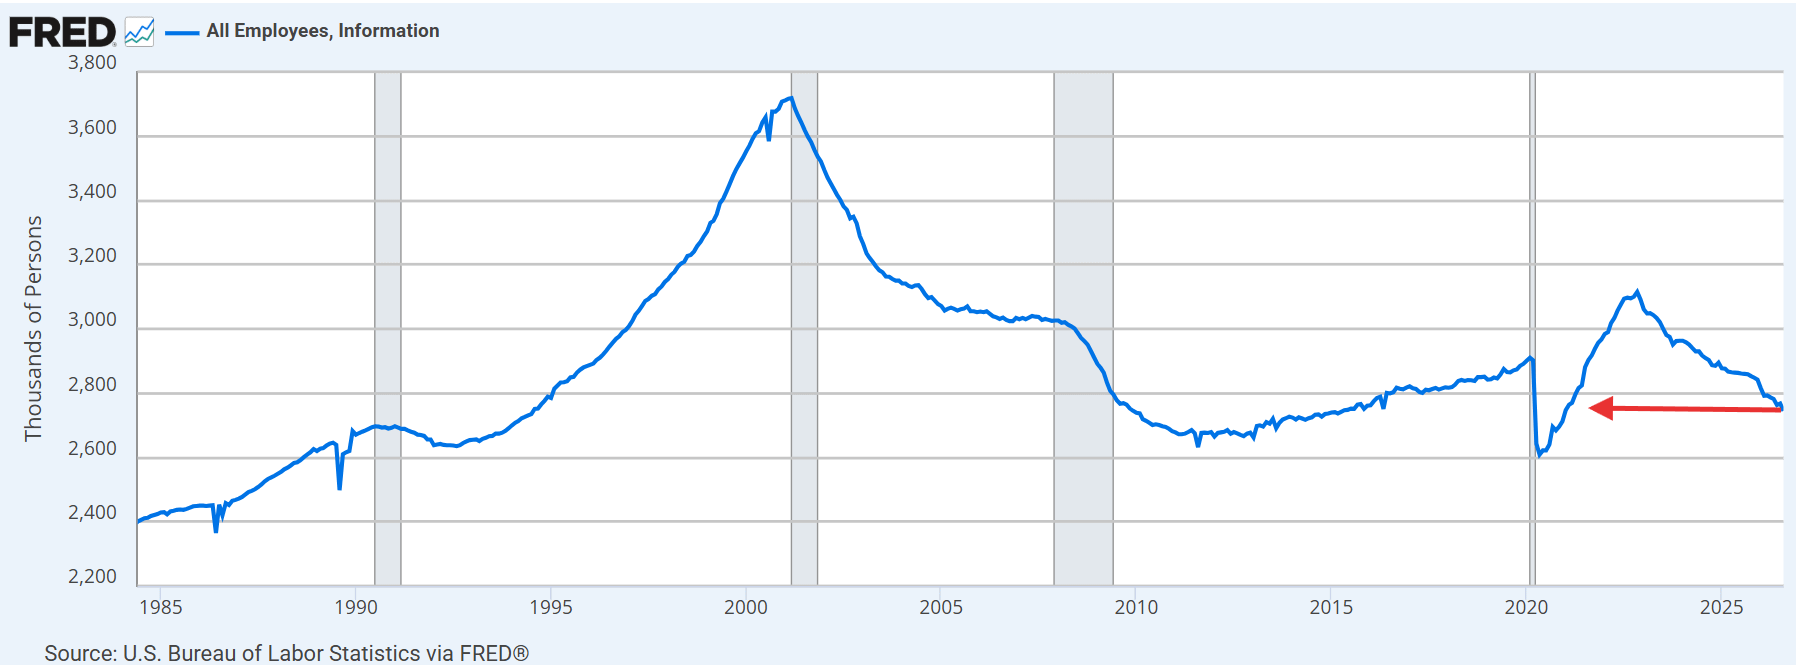
- On the negative side, Information fell -23,000 — its worst month of the year, against losses averaging -8,000 per month over the prior 12 — with computing infrastructure/data processing -8,000, publishing -7,000, and broadcasting -5,000. At 2,745,000 it is now down -370,000 from its November 2022 peak (chart) and the least since December 2020.
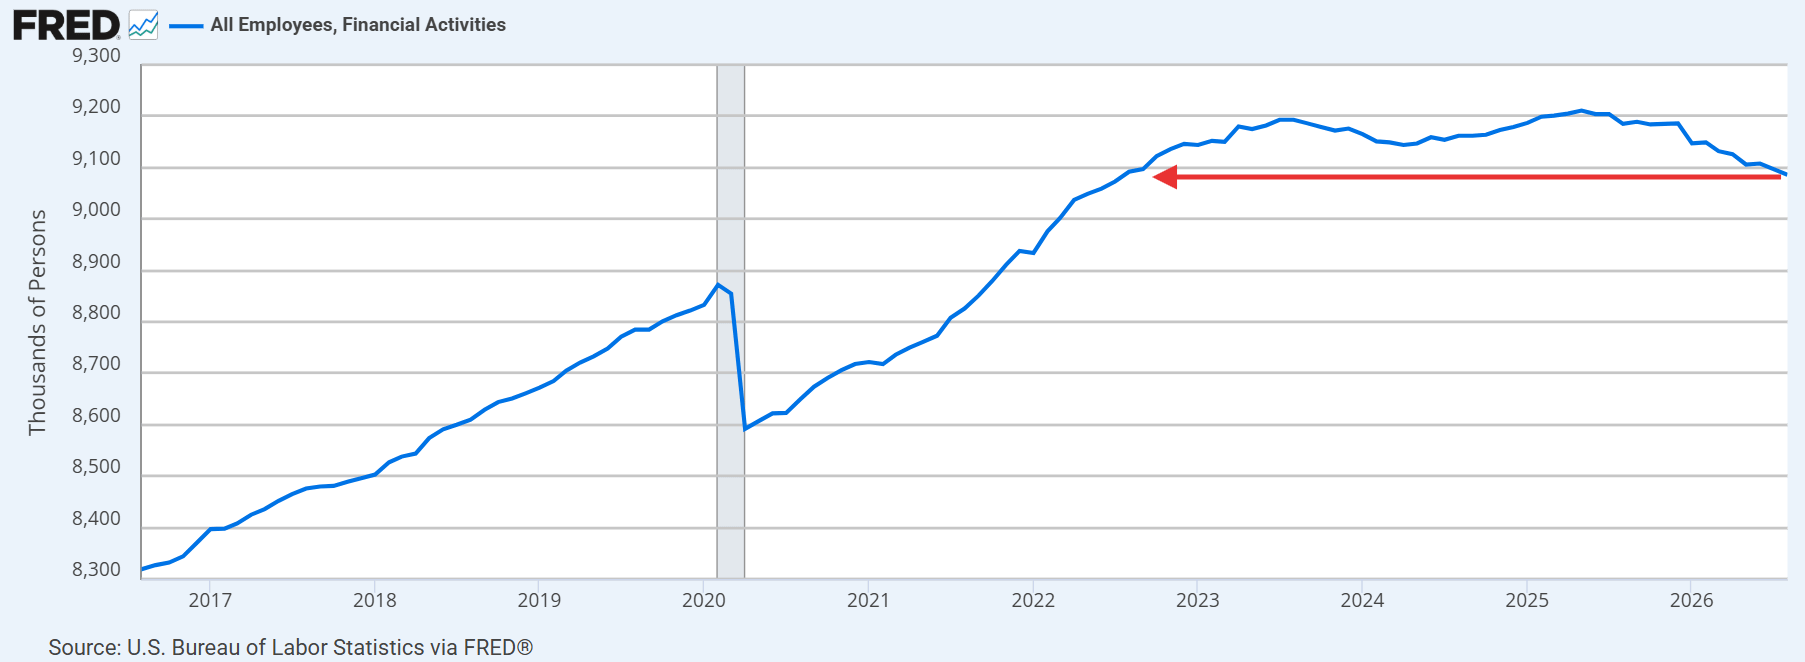
- Financial Activities fell -11,000, a third straight decline, and is now down -125,000 from its May 2025 peak to the least since July 2022 (chart).
Goods sectors added +41,000, the strongest month of the year.
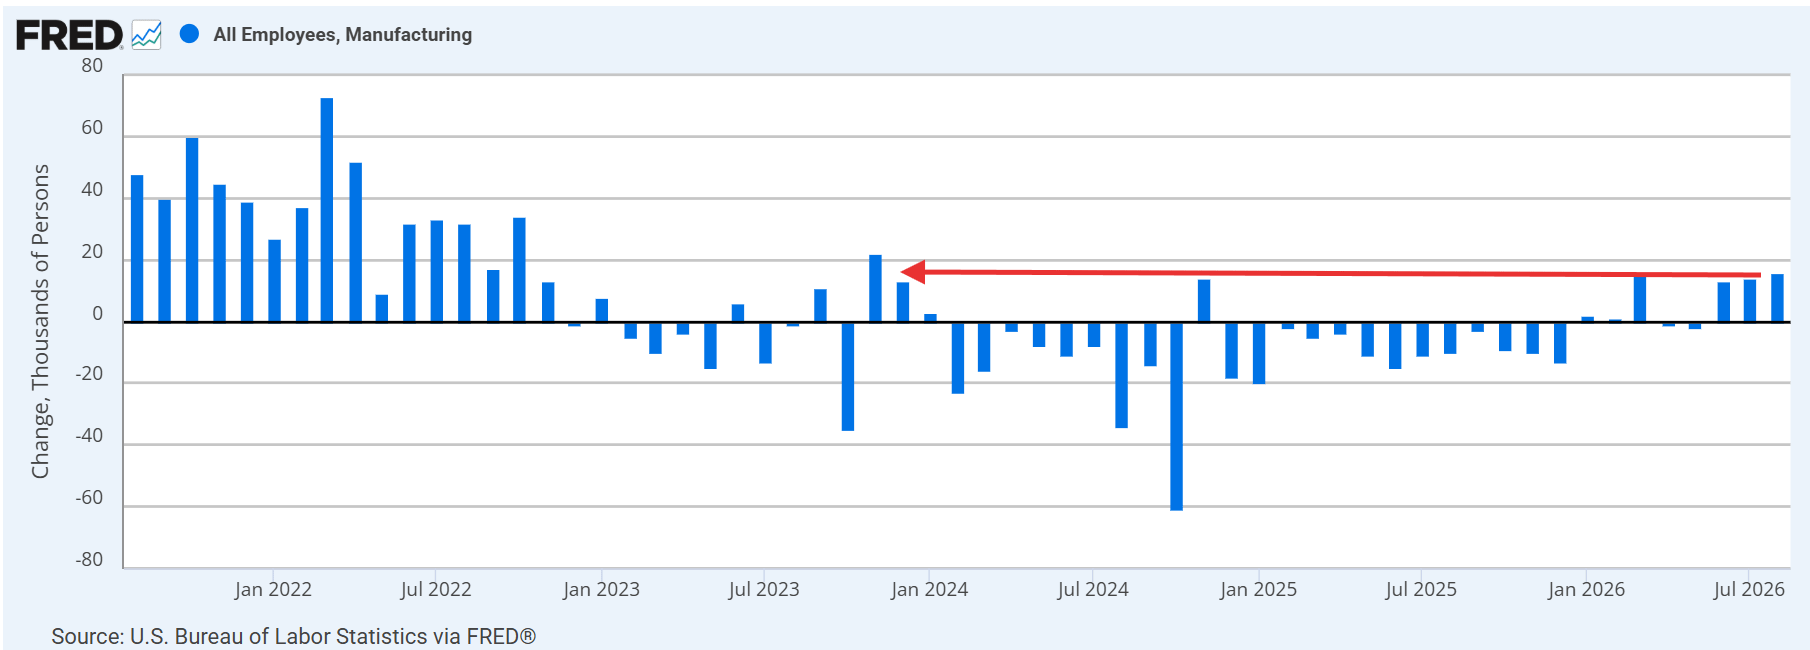
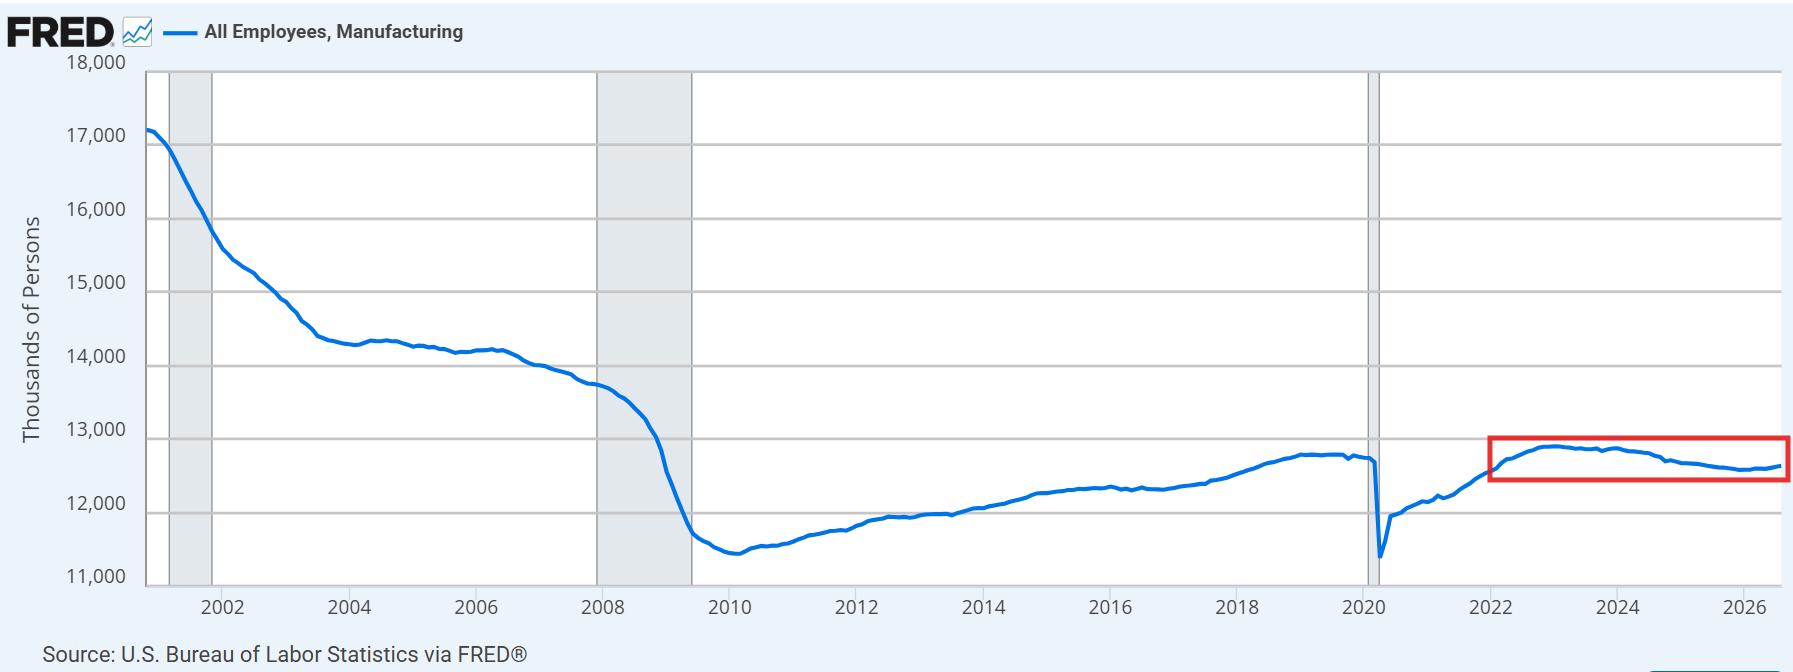
- Manufacturing +16,000, the most since 2023 (chart), and now up +58,000 since its recent low in December 2025 to the highest since May 2025 although overall in a narrow range since late 2021 (chart), led by machinery +6,000 and fabricated metal products +6,000.
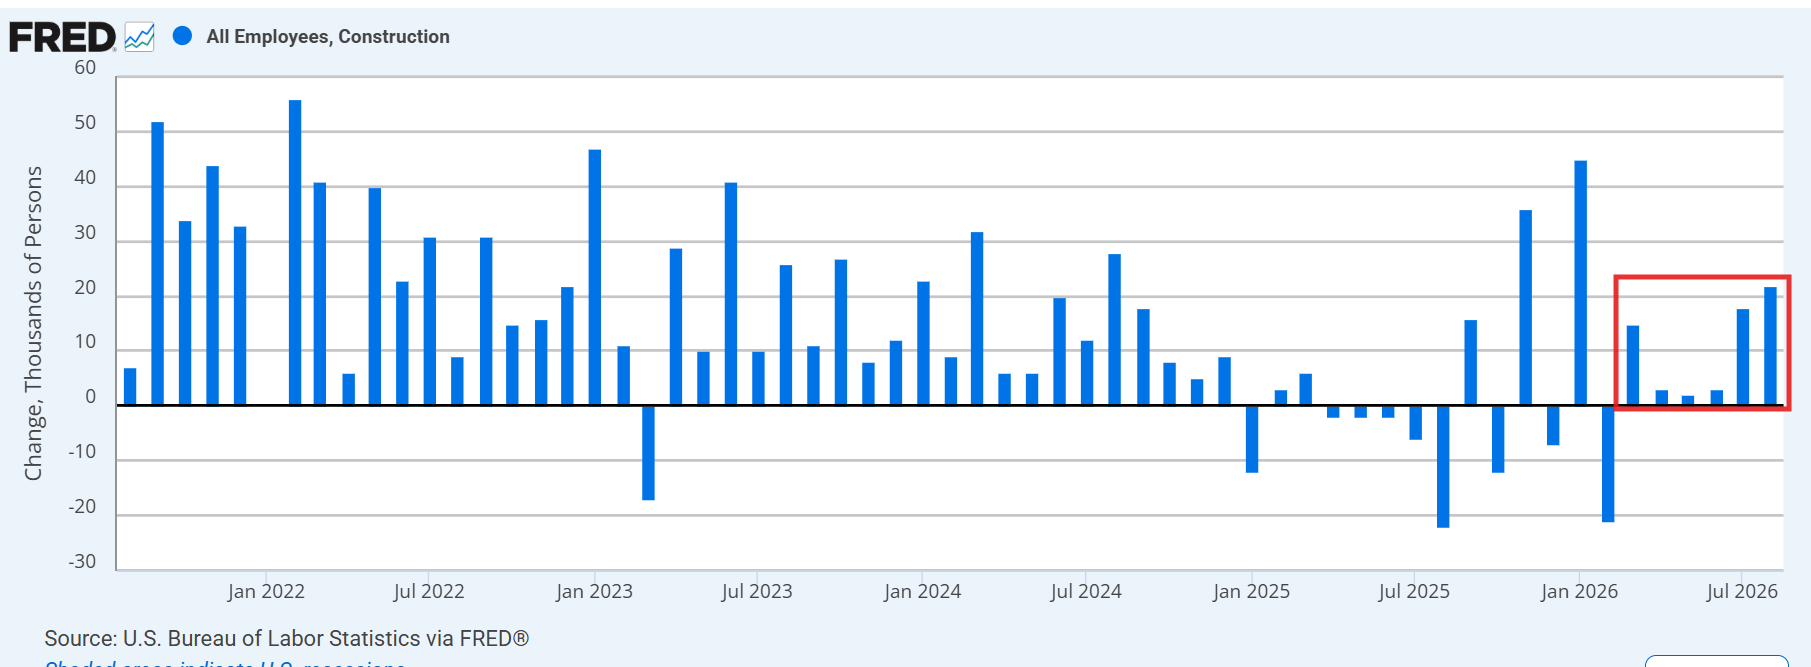
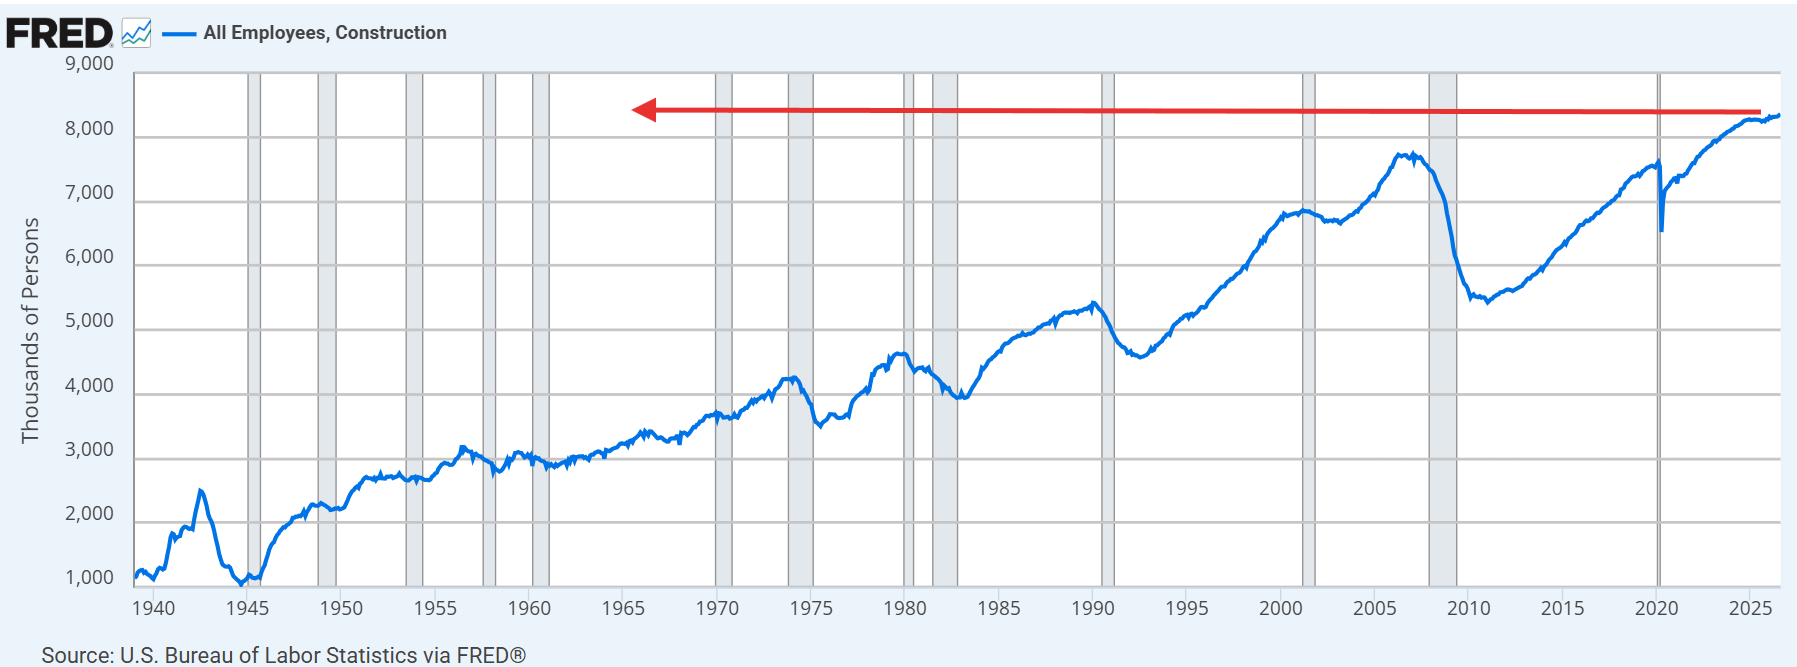
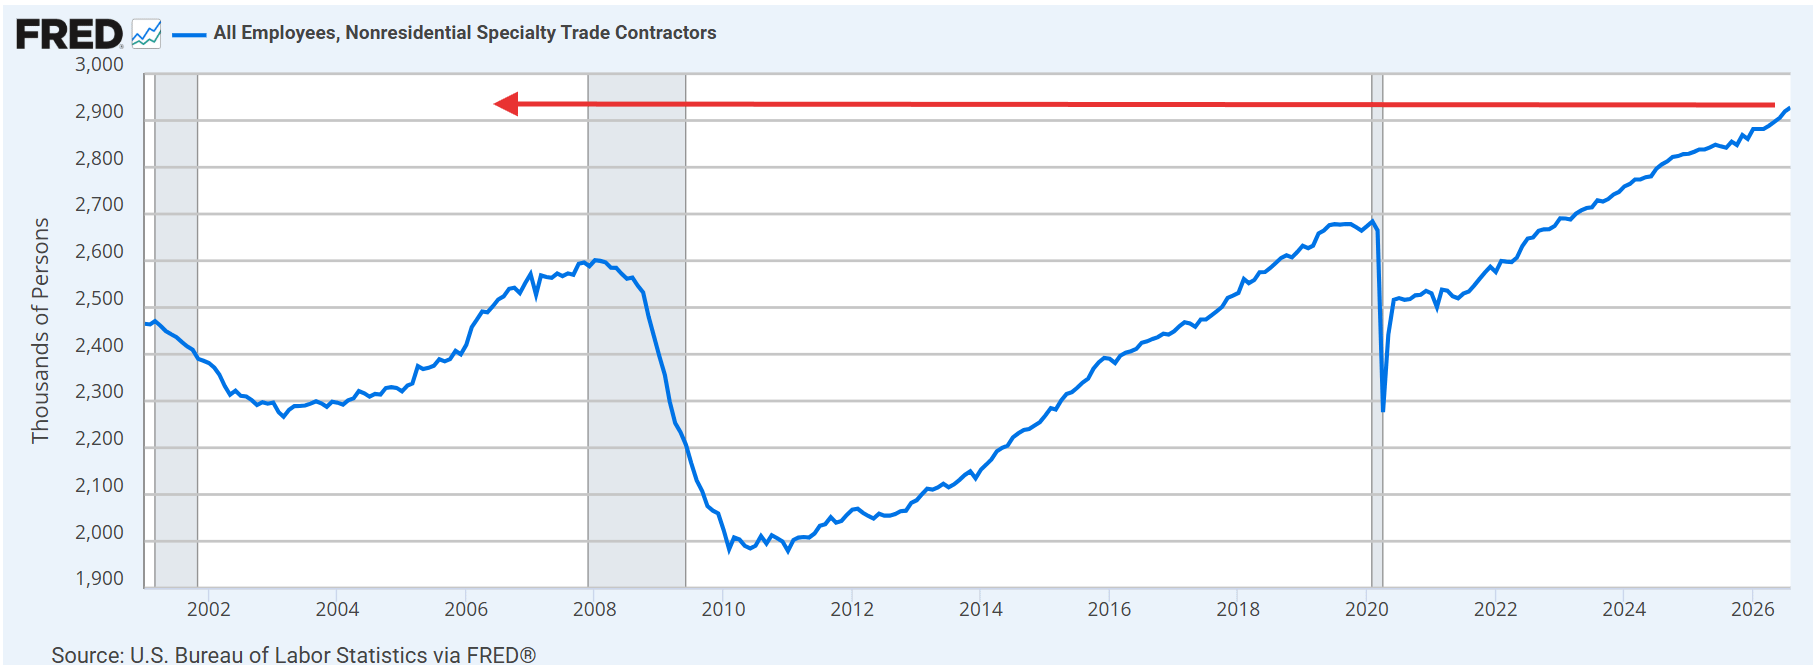
- Construction +22,000, the sixth straight monthly gain and most since January (chart) to an all-time high (chart), with nonresidential specialty trade contractors +8,000, also to an all-time high (chart), consistent with continued data-center buildout demand.
- Mining & Logging +3,000 after two months of declines
Government added +35,000 after -50,000 in July, but all from local governments which added +50,000 led by local government education +42,000, largely offsetting July’s -58,000 — BLS noted the category has shown little net change since January 2025, and the swings reflect summer seasonal patterns around teacher payrolls.
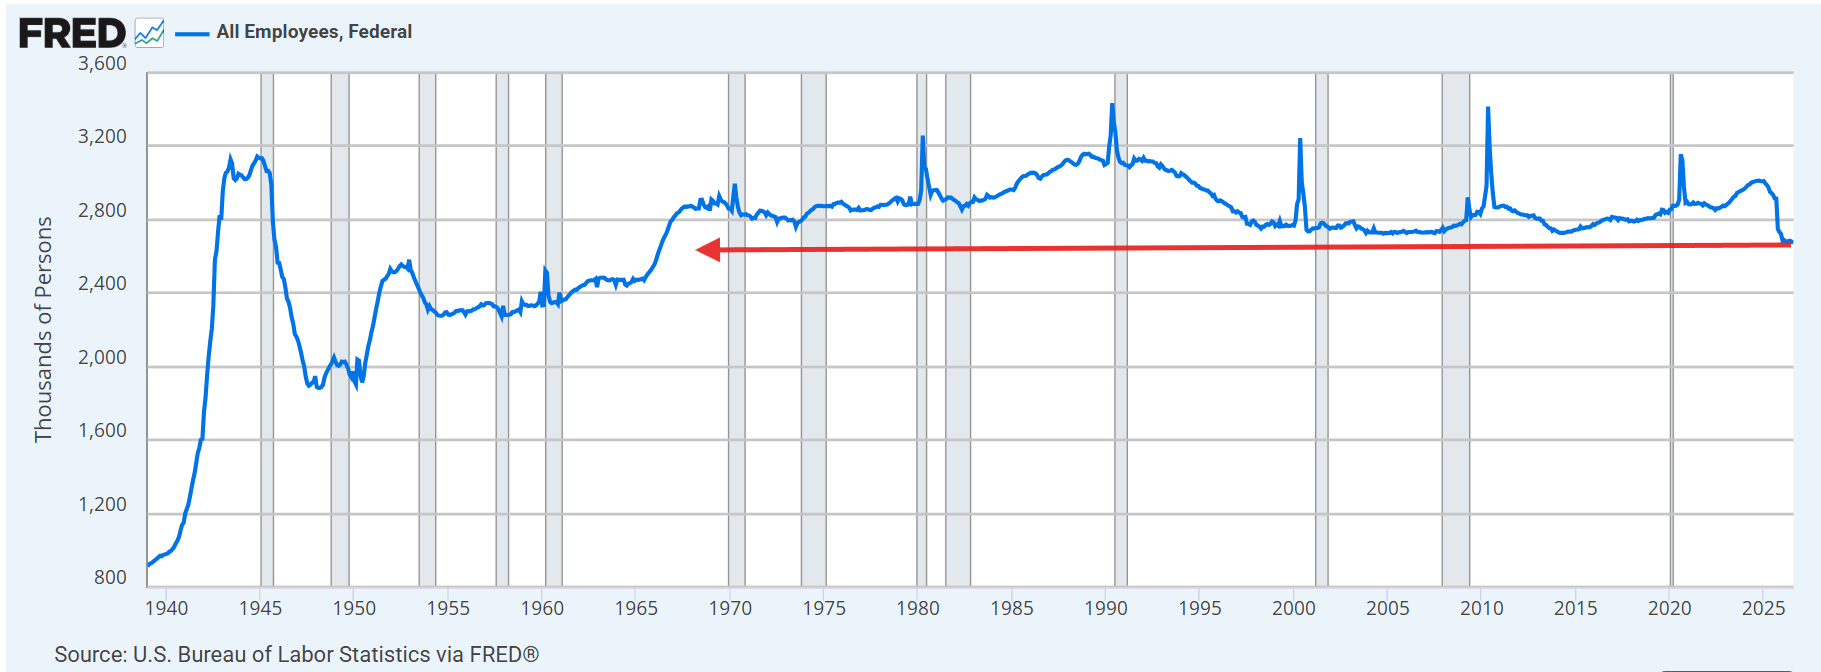
State Government fell -10,000 and Federal fell another -5,000 to 2.674 million, the least since May 1966, now down -339,000, or 11.3%, from its October 2024 peak (chart).
Private payrolls were +127,000, up from a revised +71,000 in July and the biggest advance since April. The three-month private average now stands at +75,000, up from +53,000 through July.
Also, positively, the breadth of hiring (diffusion index [the percentage of industries with employment increasing plus half of industries with employment unchanged]) jumped to 55.6%, the best since December 2024, from 52.8% in July, and for manufacturing it surged to 61.1%, the best since October 2022, from 52.1%.
Two things that it seems did not show up: roughly 350,000 Haitian refugees lost protected legal status at the end of July, which some economists had flagged as a potential drag, and ADP reported just +38,000 for August, a wide divergence from the BLS print.
Household Survey
Turning to the household survey, after a year of steady deterioration the picture reversed sharply. After falling in six of the prior seven months, the number of employed persons jumped +569,000, outside of the January benchmark revision, the best since November 2023.
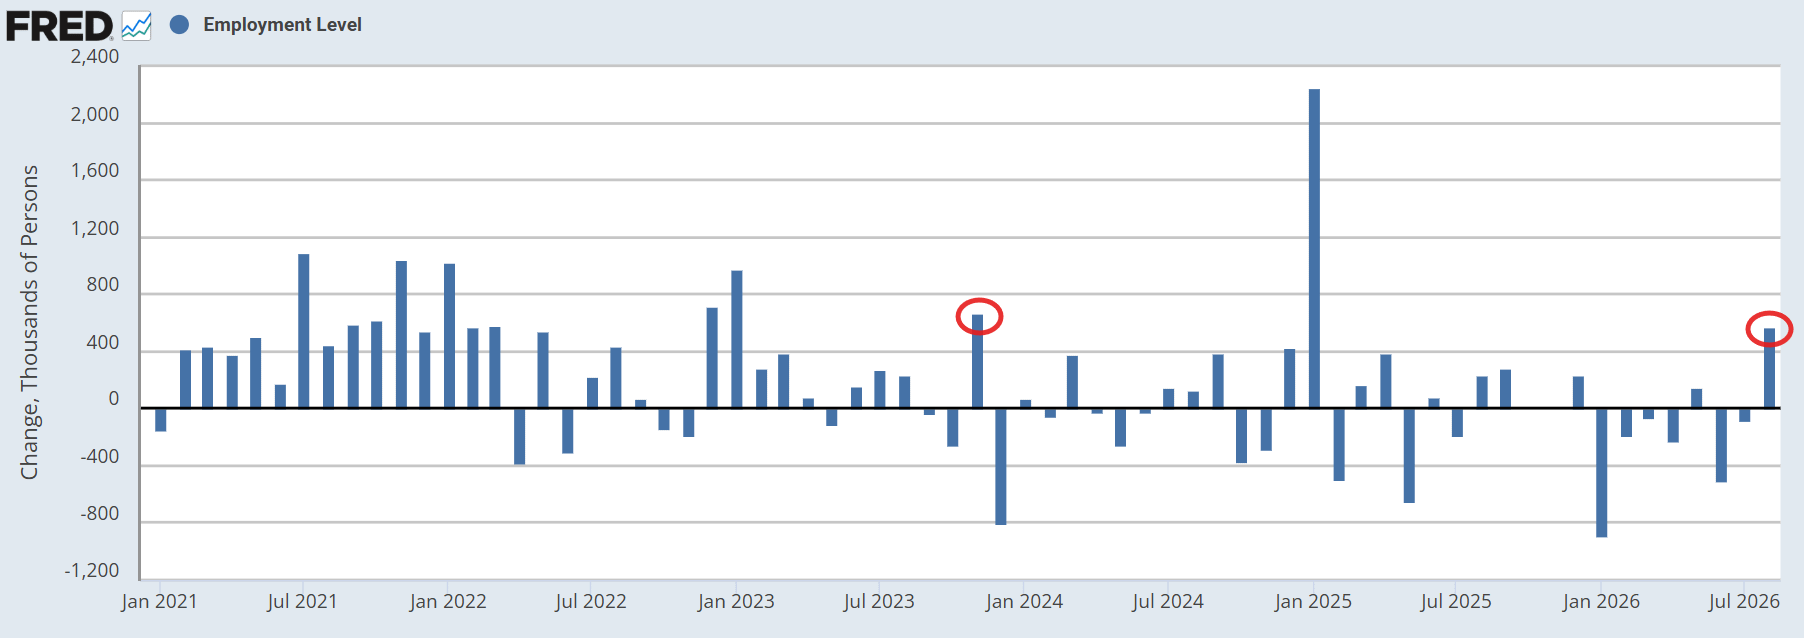
But the labor force grew even more +683,000 after falling in four of the prior five months. Outside of a January (benchmark revision) that is the largest jump in the labor force since October 2022.
With the growth in the labor force exceeding employment, the number of unemployed did increase +115,000, the first increase in four months.
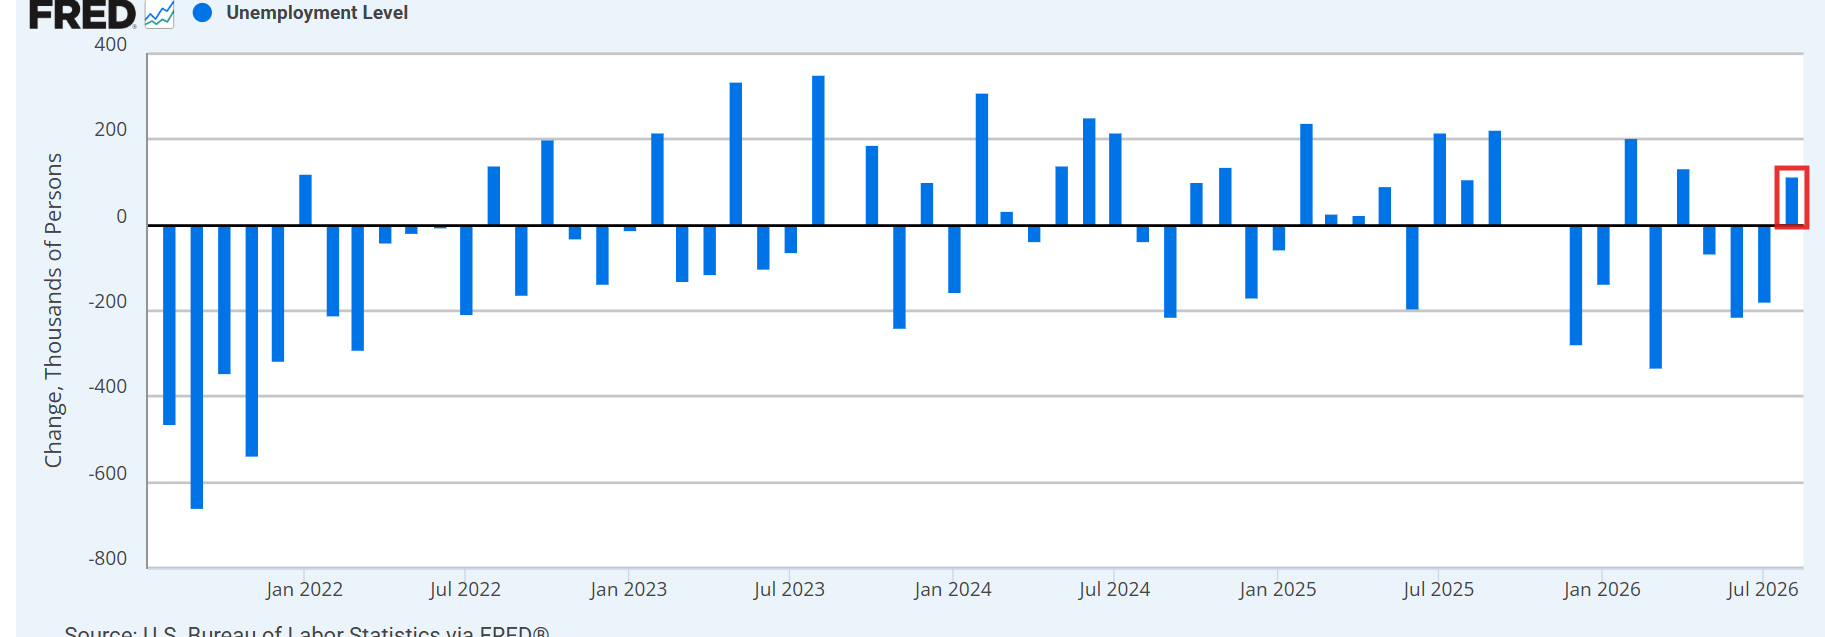
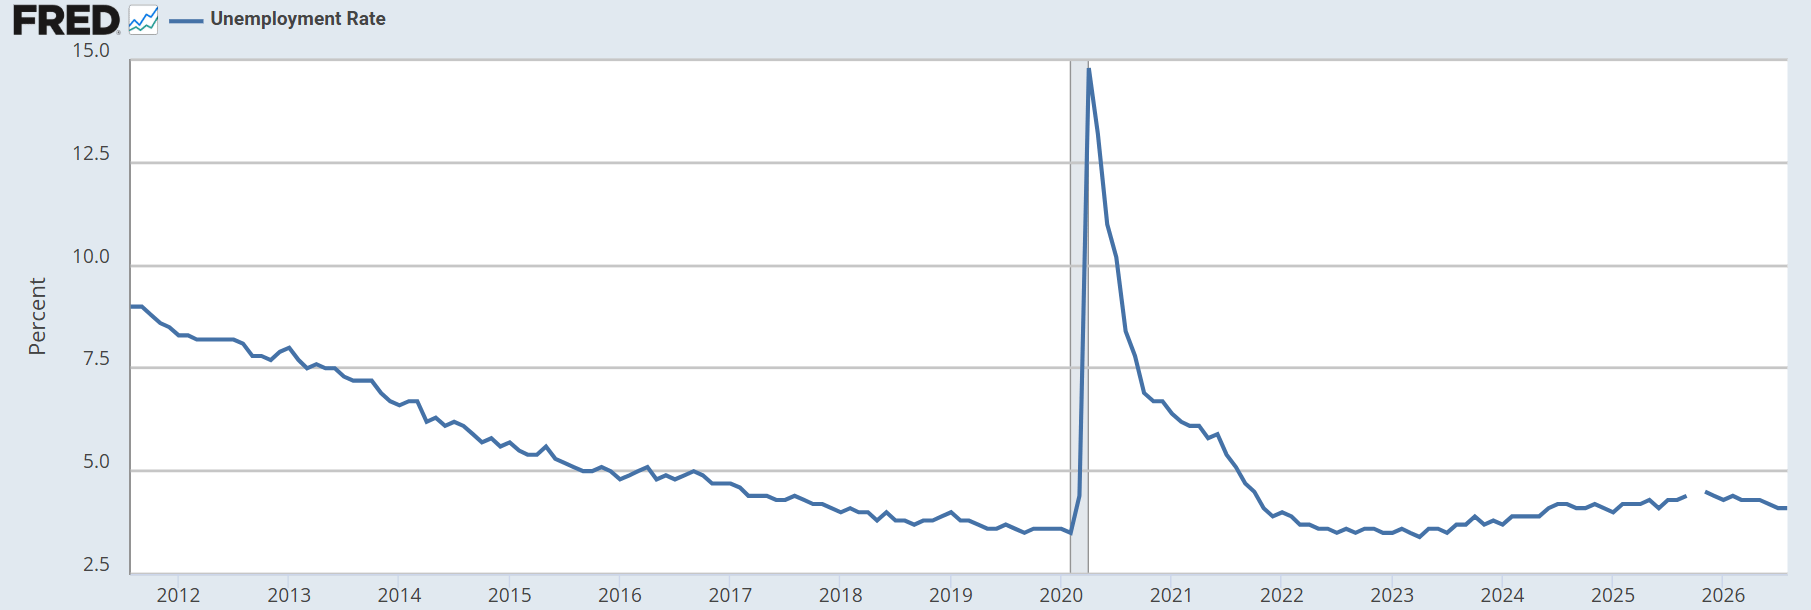
However, the unemployment rate held steady at 4.1% rounded (on an unrounded basis it edged up to 4.141% from 4.090% in July).
By group, Black unemployment fell to 6.0%, the lowest since February 2025, and Asian unemployment to 3.2%, the lowest since April 2025, while White (3.7%) and Hispanic (4.8%) rates edged higher.
With the jump in the labor force, the labor force participation rate rose two-tenths to 61.6% — the first improvement in almost a year from the least since February 2021 (chart) — though it remains down -0.5 pp since January.
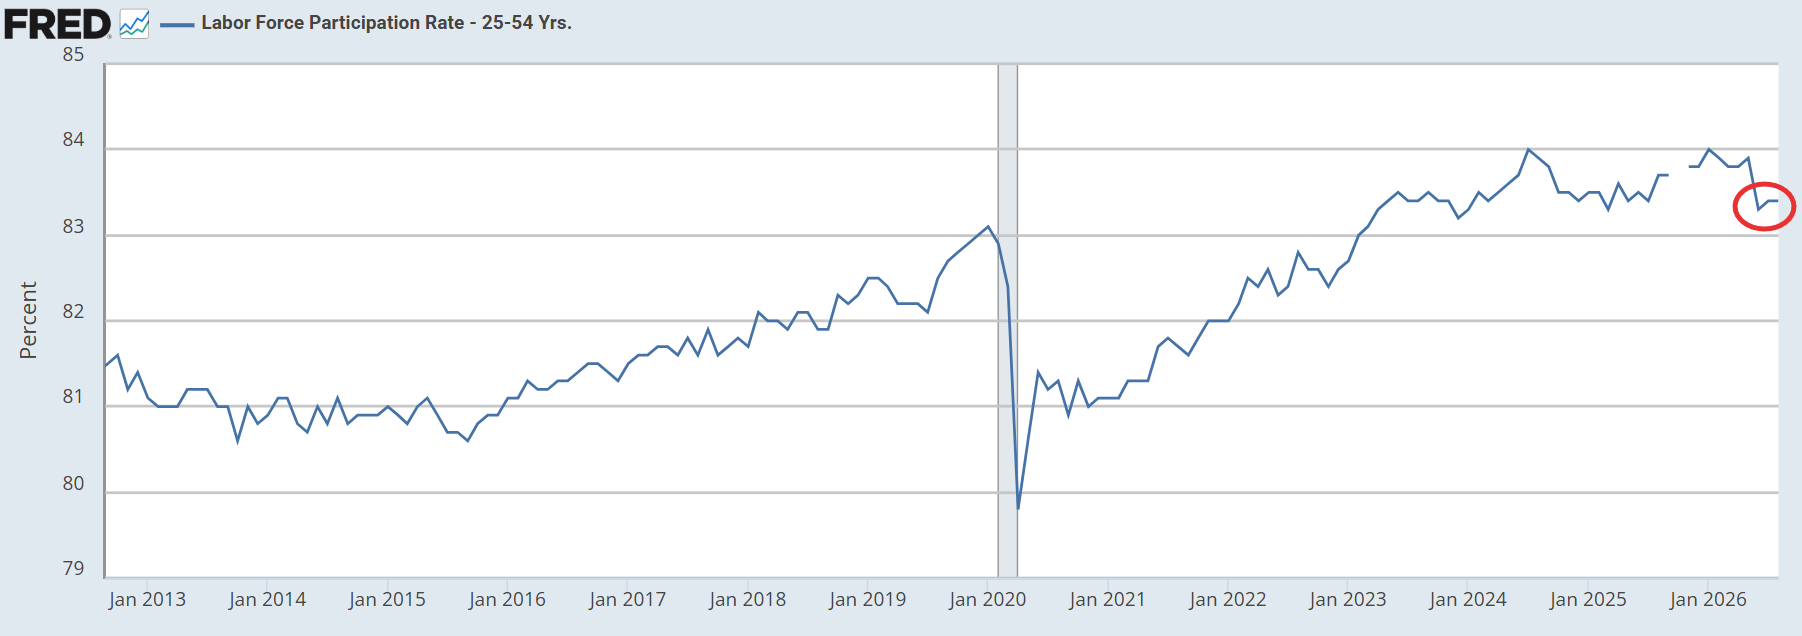
Per Bloomberg the increase was concentrated among younger and older workers, with prime-age (25-54) participation unchanged at 83.4% (second chart).
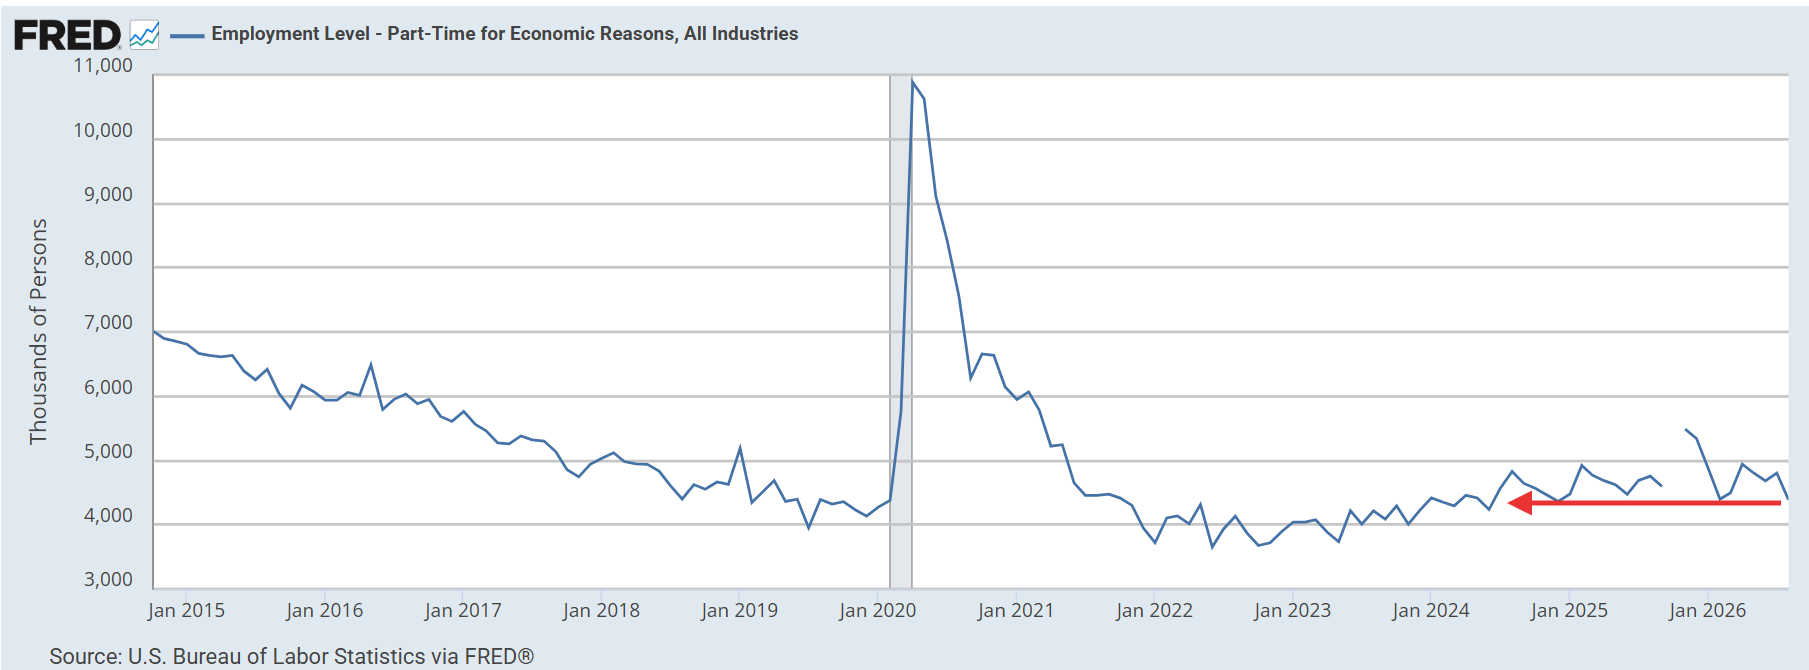
In another positive, part-time employment for economic reasons plunged -414,000 to 4.39 million, the largest monthly decline since February and the lowest level since June 2024 (chart).
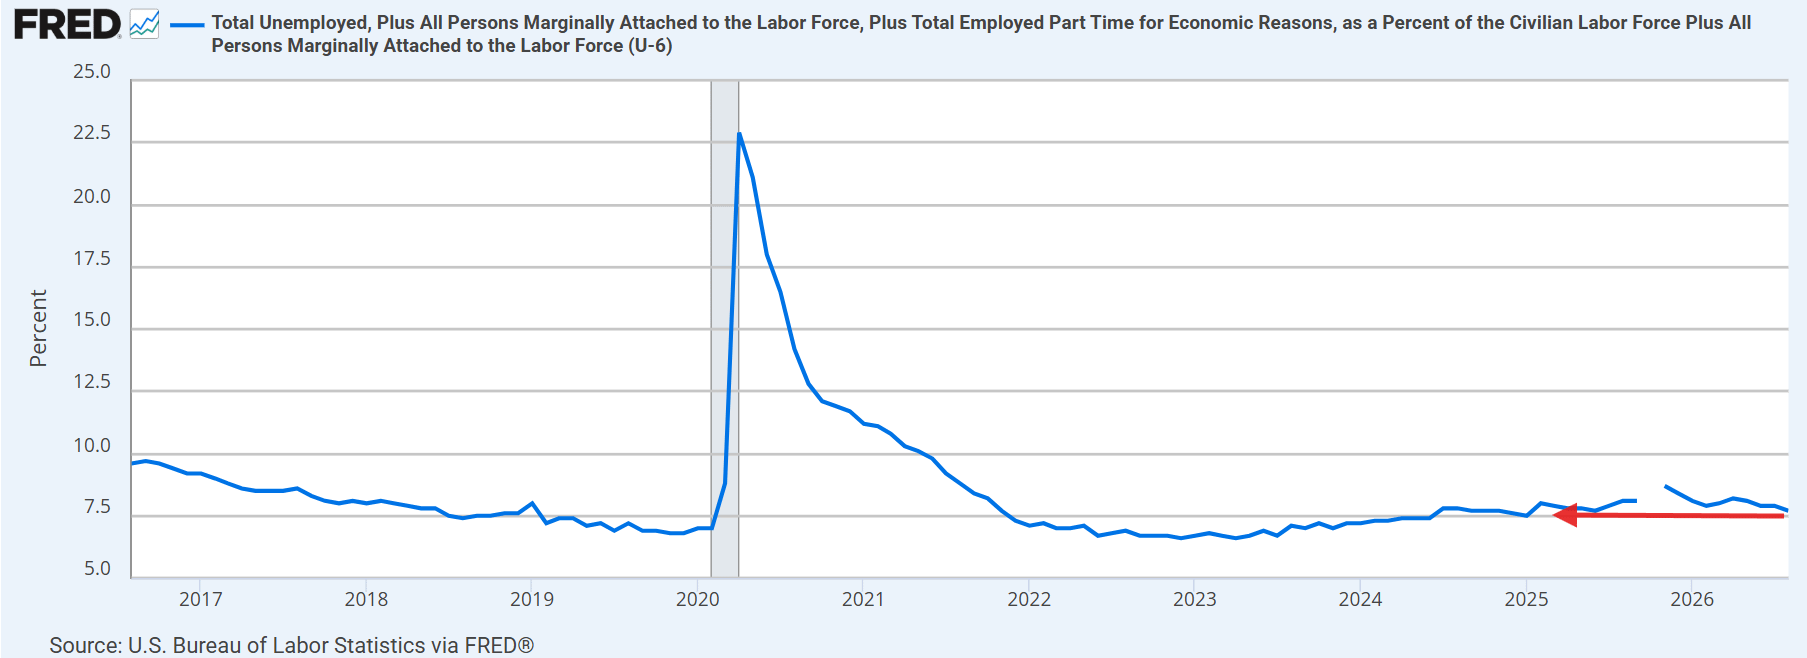
The U-6 broader unemployment measure fell two tenths to 7.7% (chart), its lowest since June 2025. Discouraged workers edged down to 441,000 and marginally attached to 1.70 million.
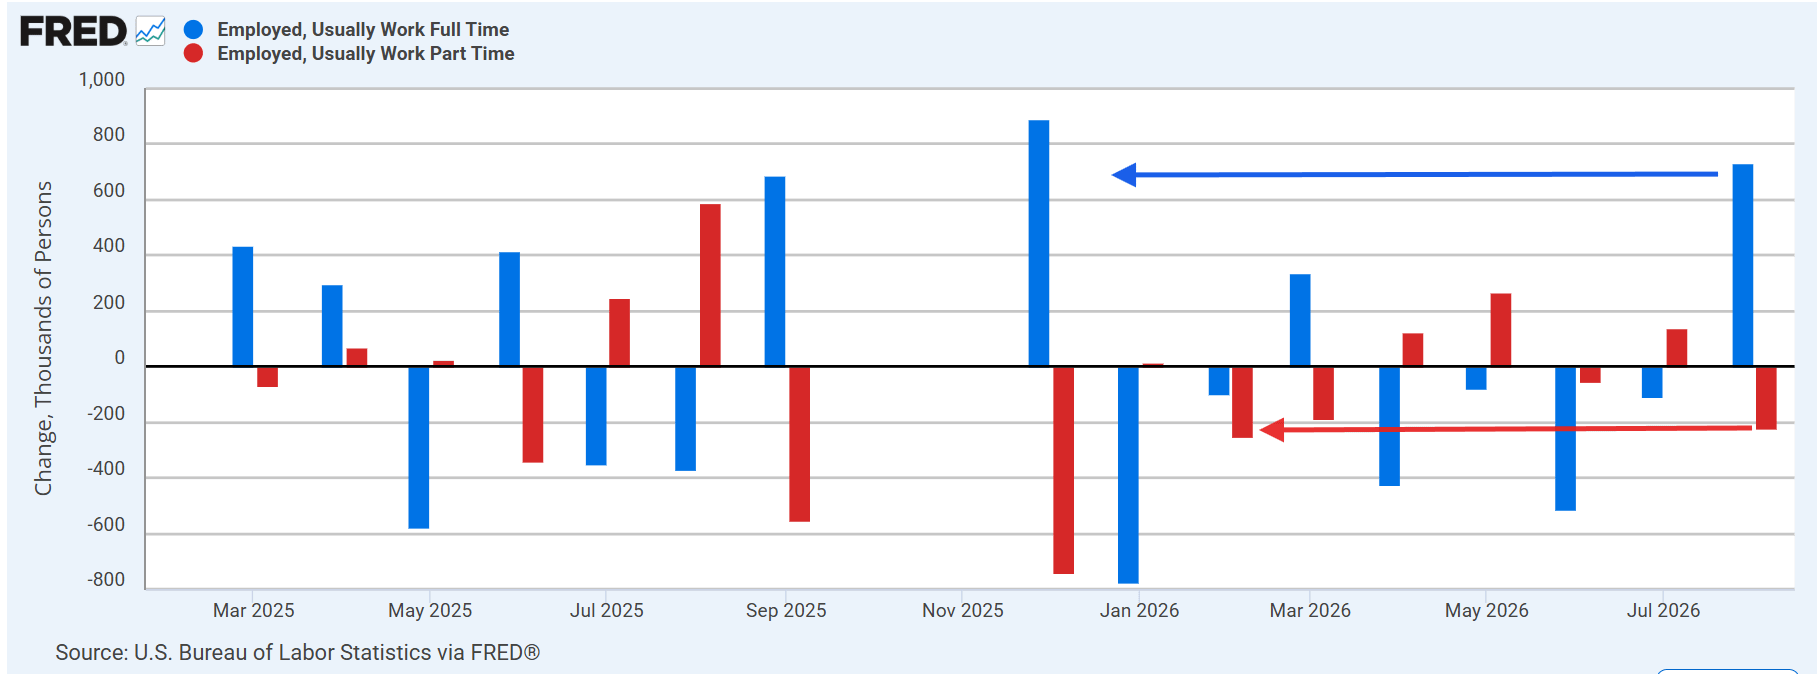
Also positively, the full-time/part-time split, full-time workers surged +735,000, the most since December 2025 and first in five months, while part-time workers fell -223,000, the most since February.
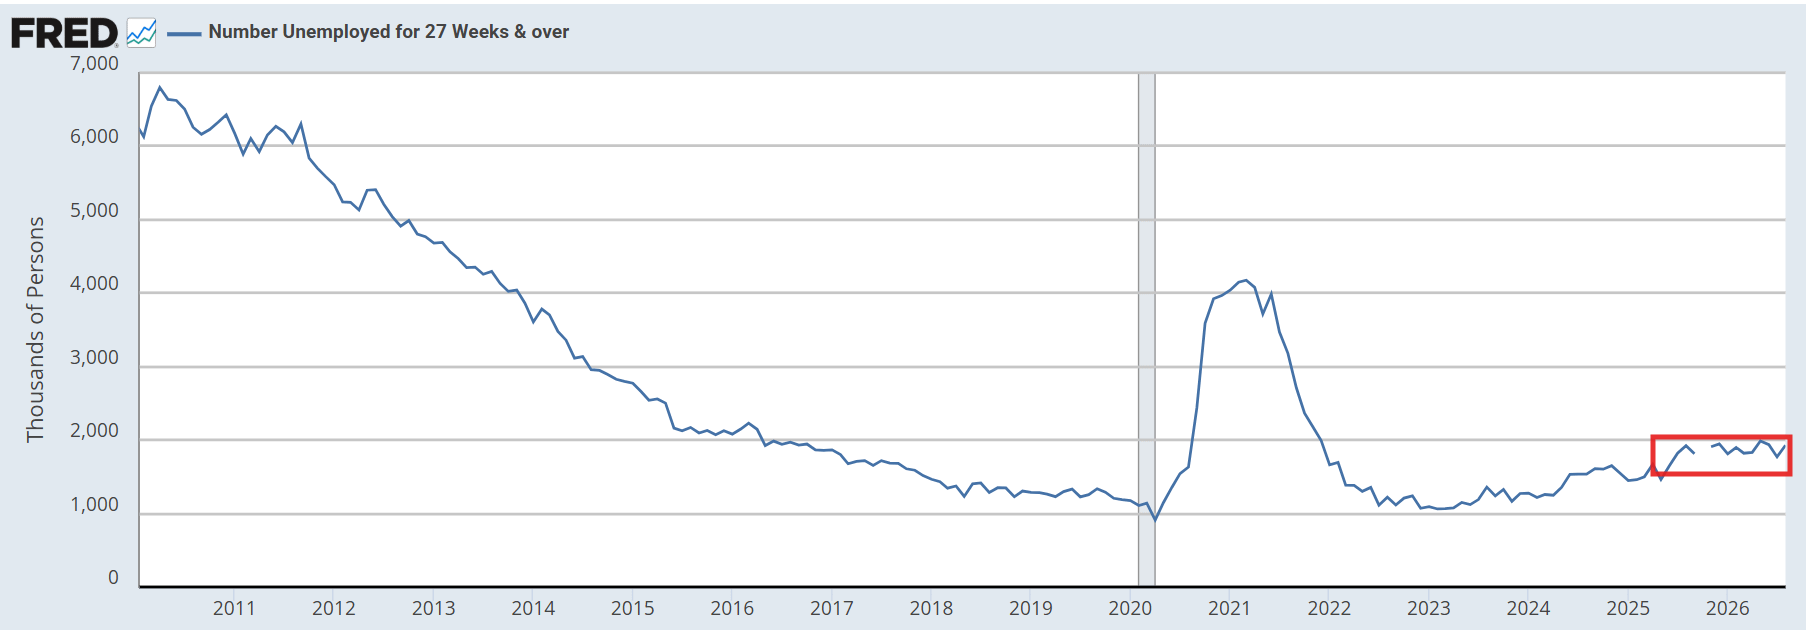
One quibble in the household data was on unemployment duration: those unemployed 27 weeks or longer rose +159,000 to 1.930 million (chart), still though down from 1.980 million in May and in the range over the past year, 27.0% of all unemployed, with the median duration of unemployment rising to 11.4 weeks.
Incomes
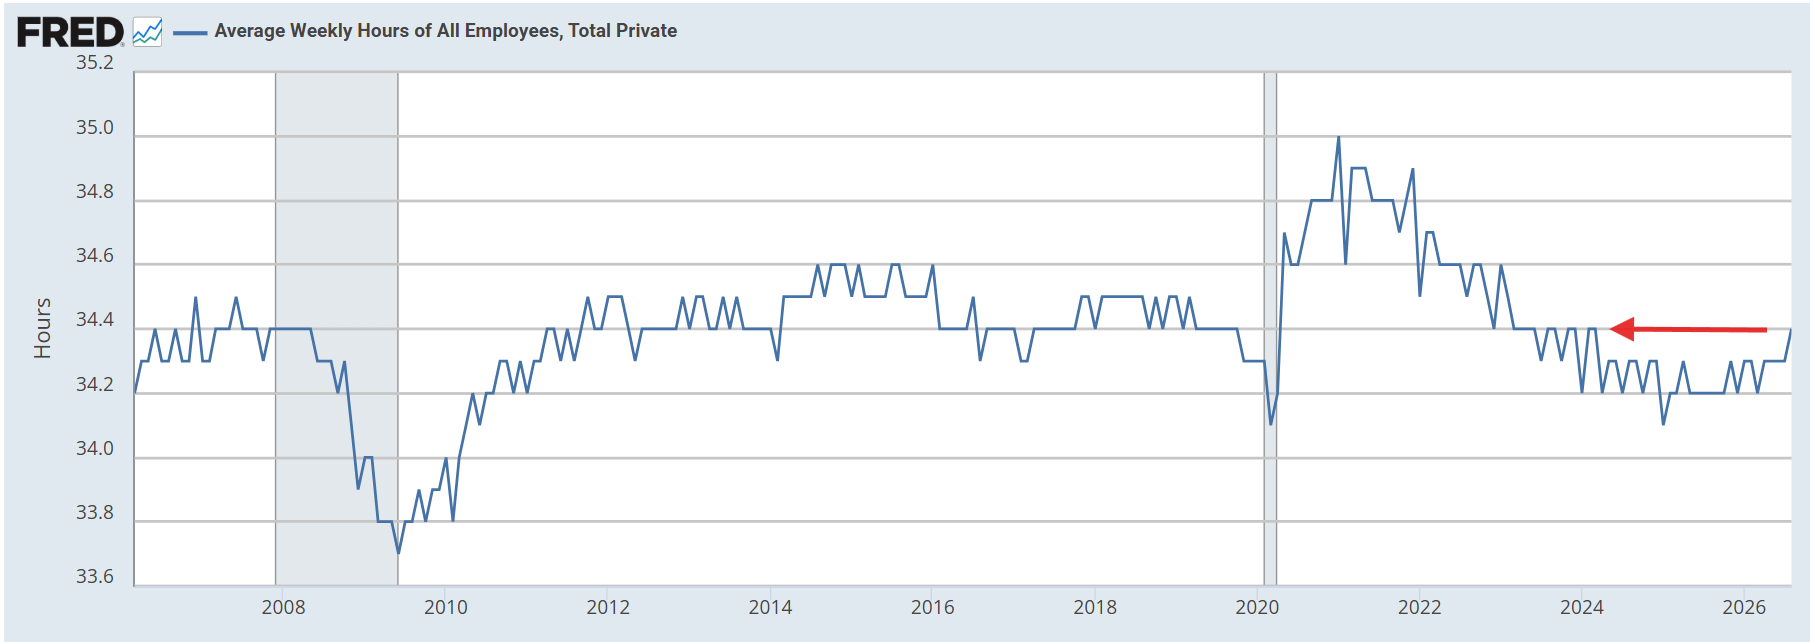
The average workweek rose a tenth to 34.4 hours, the highest since March 2024, though still below the pre-pandemic 10-year average. As Bloomberg noted, the longer workweek lifted weekly pay even with modest hourly gains, which could support consumer spending in the months ahead.
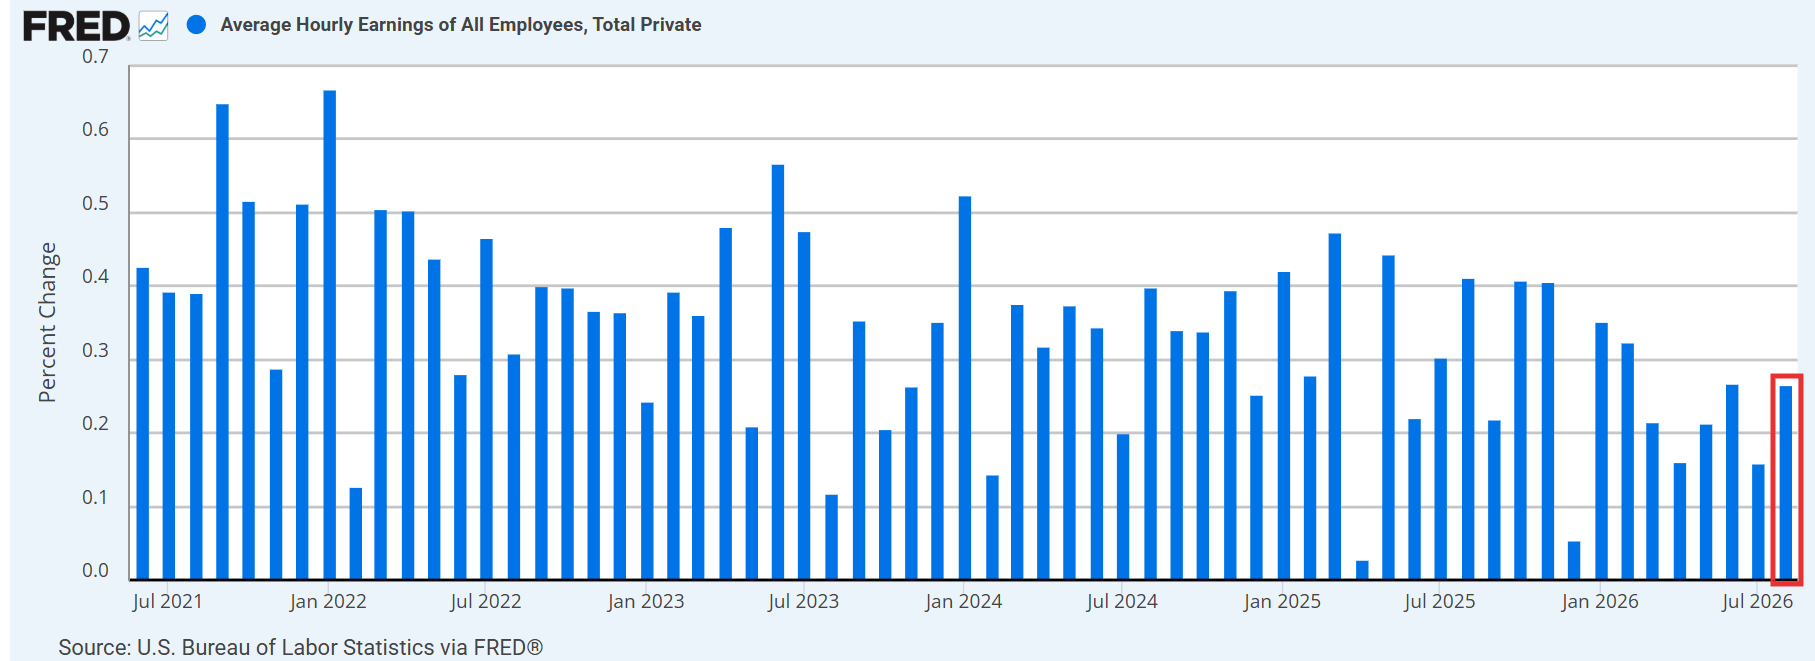
And average hourly earnings rose +0.27% from July (month over month), which rounded to the +0.3% consensus and was up from a revised +0.16% in July.
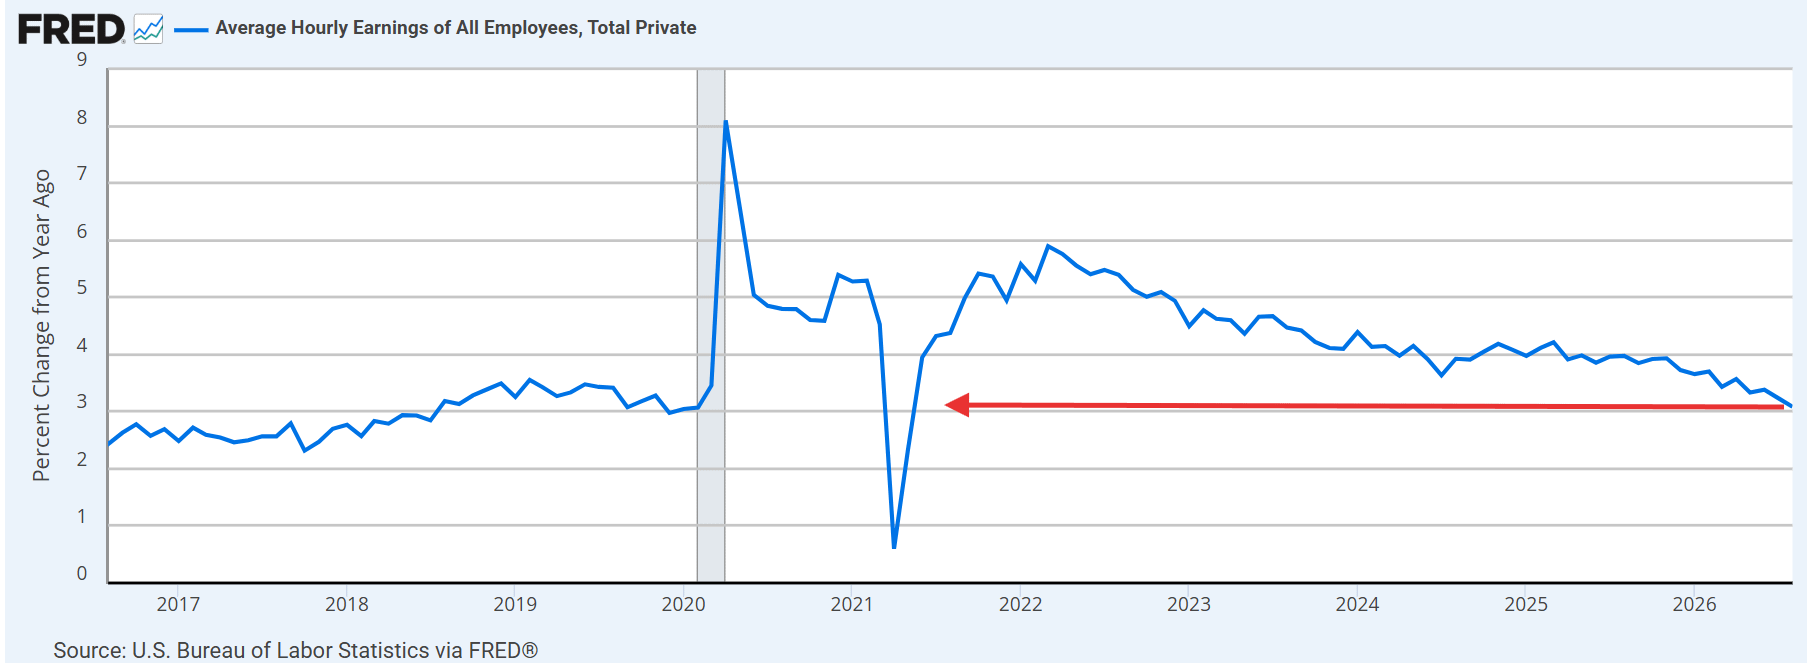
From a year ago (year over year) though average hourly earnings decelerated again to 3.09% from 3.15% in July, the slowest since May 2021. For production and nonsupervisory employees, though earnings were stronger at +0.34% m/m and +3.30% year over year.
BBG: Despite the blowout headline there is little sign of wage pressure here — and Chair Warsh said last week that “in tracking underlying inflation, wage growth has not proven a reliable indicator of future inflation for a very long time.”
Putting together the strong payroll gain, the longer workweek, and the modest pickup in average hourly earnings, the index of aggregate weekly payrolls* — which I consider among the most important metrics from this report as it represents the total take-home income of private employees — came in at a robust +0.67% month over month, the best since January and up sharply from July’s +0.19%.
*The number represents aggregate take-home income for all workers (it is just total # of jobs × hourly earnings × workweek; Nick Timiraos calls it “a good monthly proxy for nominal income growth and correlates well with nominal GDP growth”).
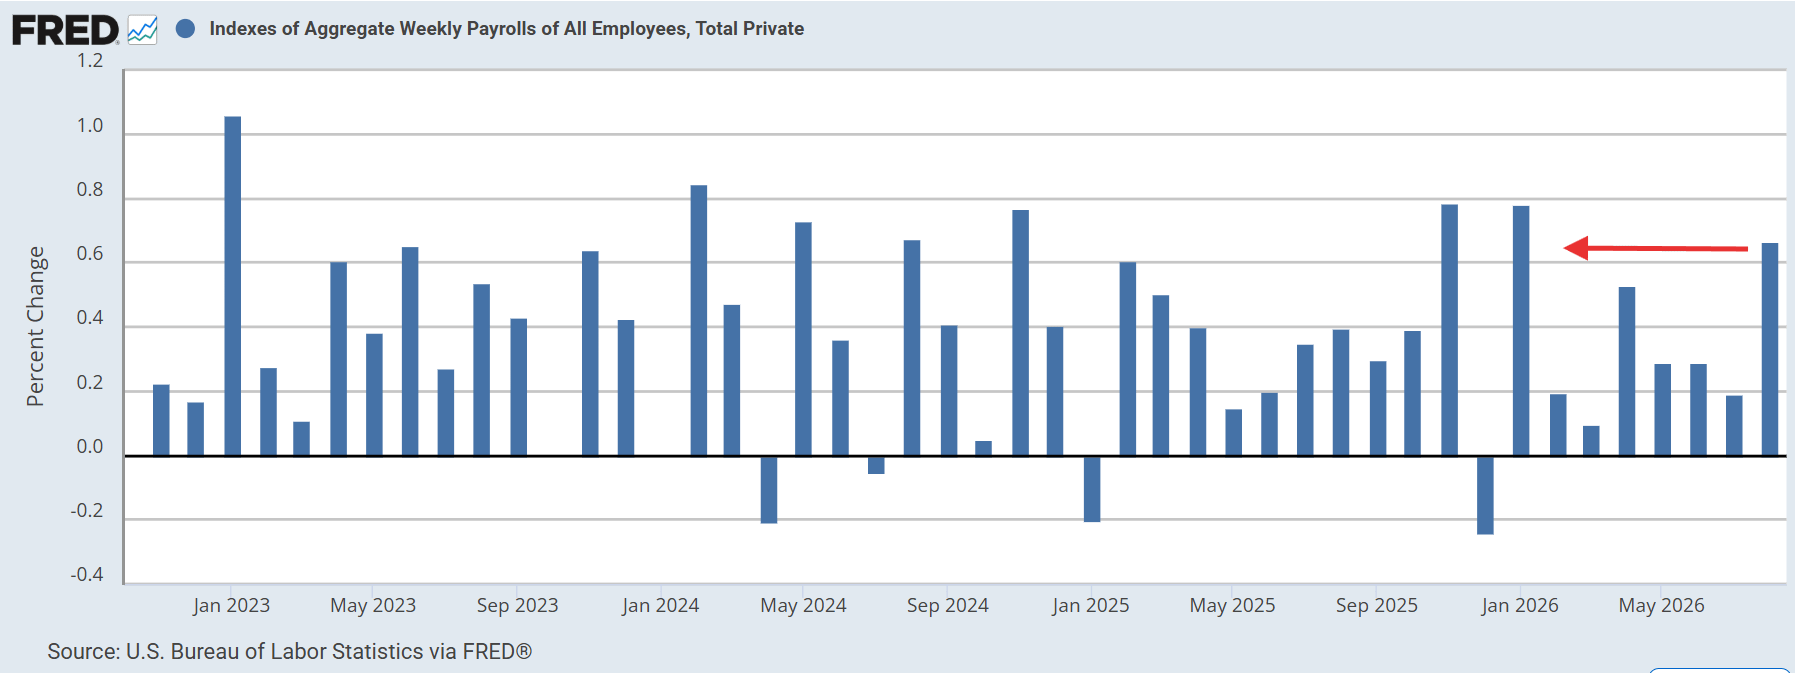
The year over year was +4.34%, also the best since January, although overall in its range over the past two years (chart).
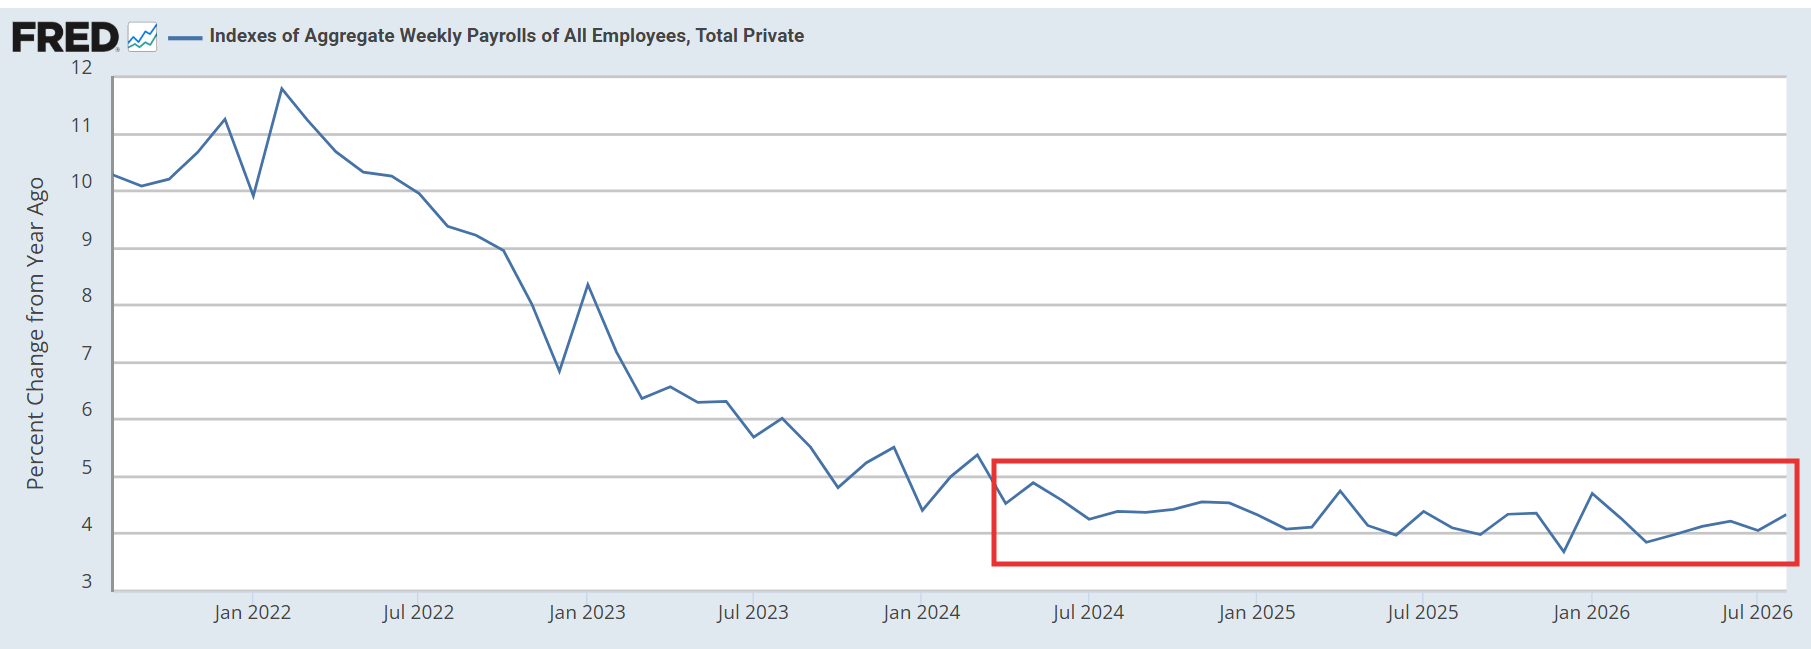
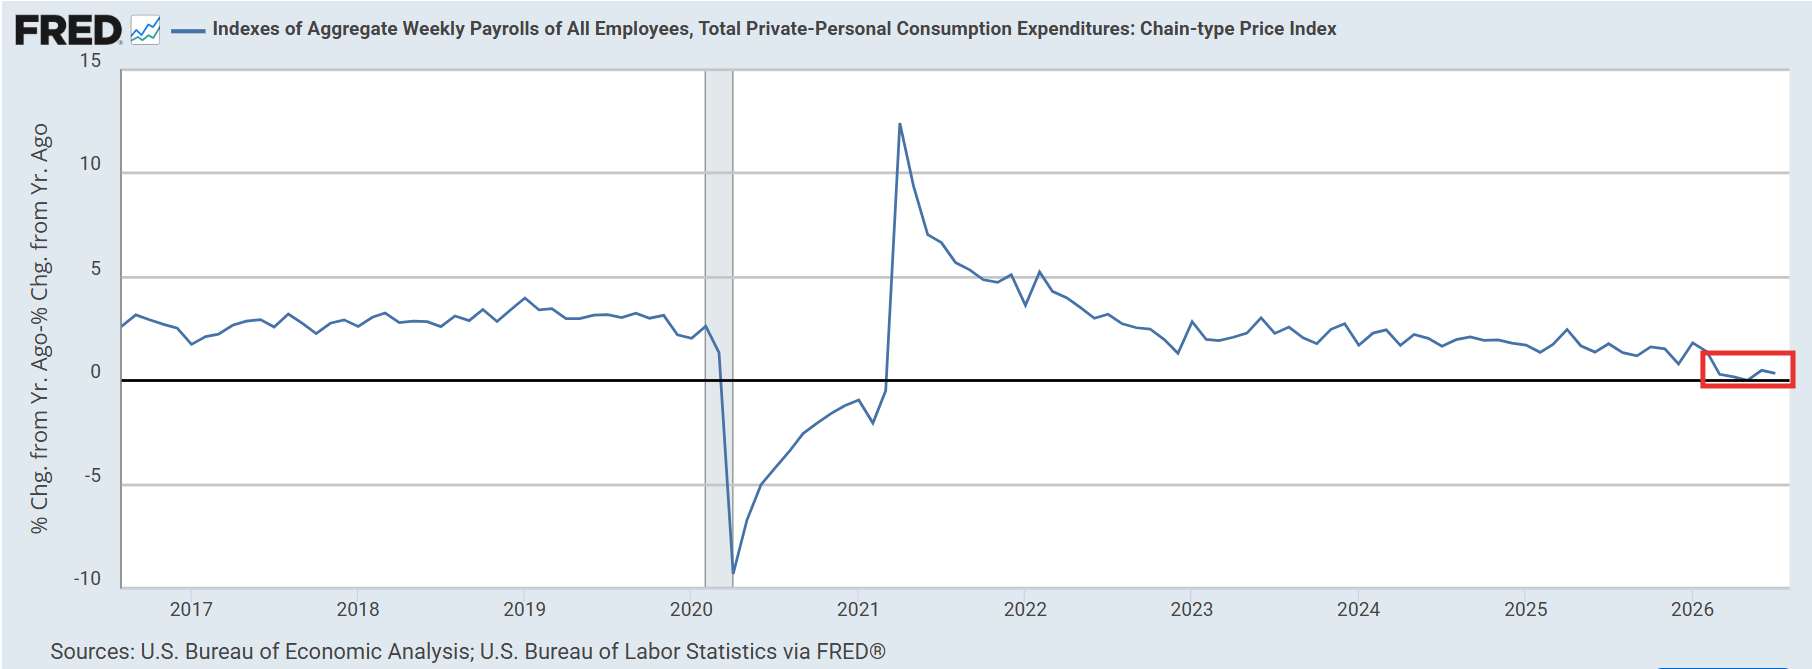
On a nominal basis that remains consistent with the 10-year pre-pandemic average, but with inflation running well above those levels the real figure is significantly lower— as of July, with CPI at 3.4% year over year, real aggregate weekly payrolls were running at +0.36% year over year (we’ll get the August CPI report on September 11).
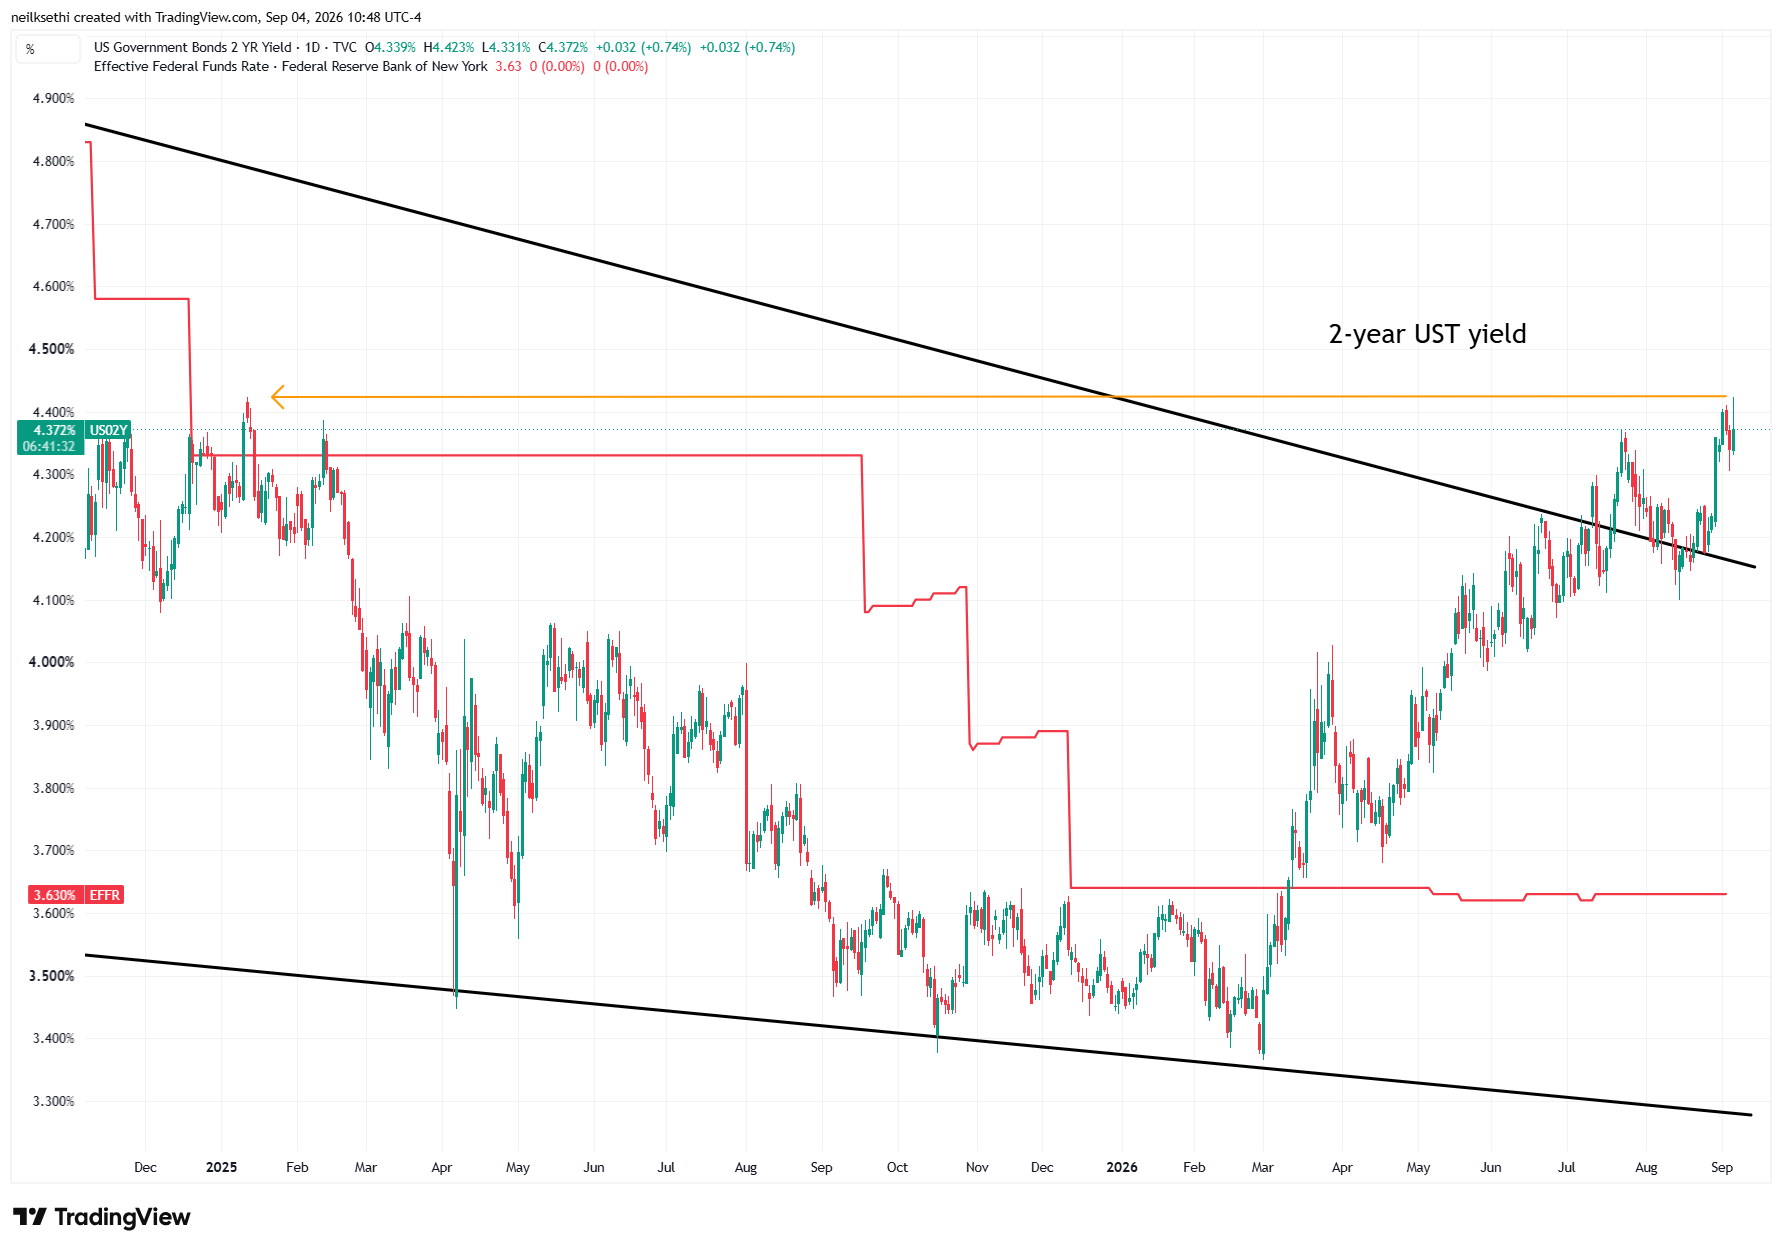
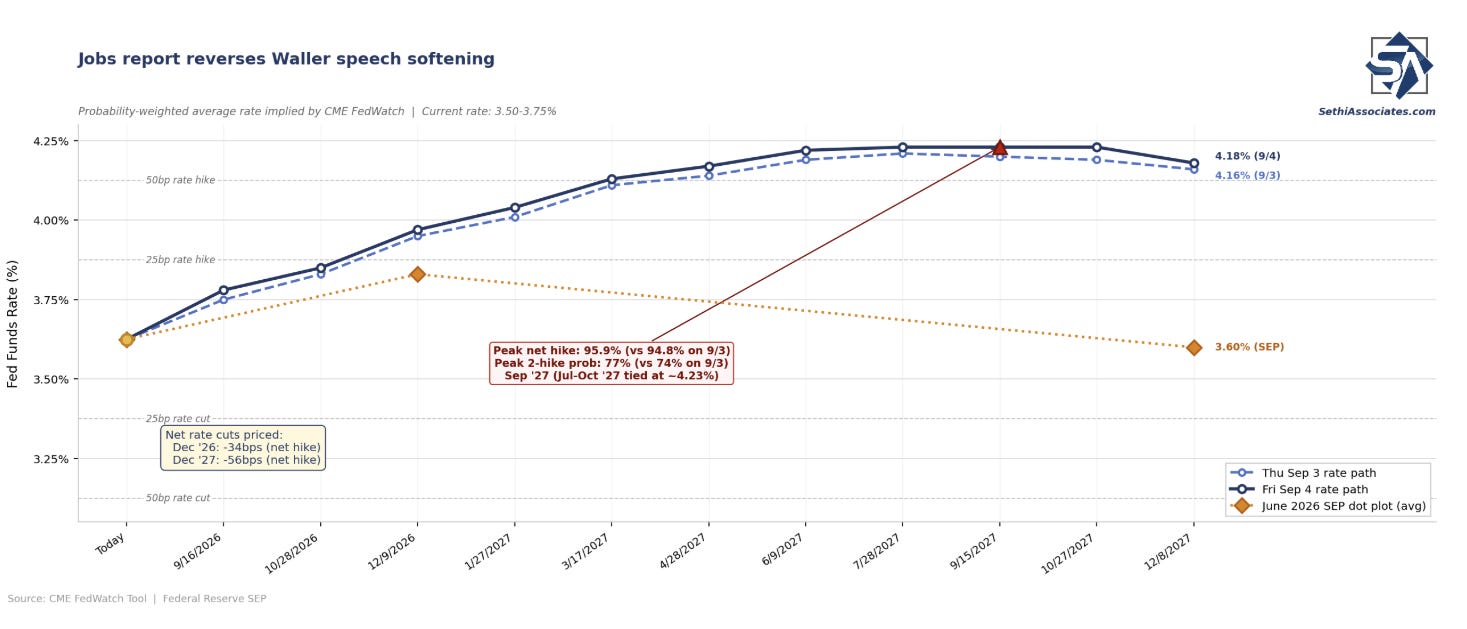
Market reaction: Treasury yields jumped and stock futures fell on the release, with the two-year up 7 BPS to 4.40% — testing its January 2025 peak, itself the highest since July 2024 — before easing back to +3 BPS as of 11 a.m. ET. The dollar rose 0.3% and the curve bear-flattened. Swaps moved September hike odds from roughly 50% to about 60%. Next week’s CPI and PPI remain the deciding inputs ahead of the September 16 decision.
Some Analyst Reactions
- Bloomberg Economics: “The strong August jobs report raises the risk of a Fed rate hike in September. It leaves the August CPI report (due Sept. 11) as the determining factor — and we expect that reading to be just borderline acceptable to the doves. The September FOMC meeting is shaping up to be a very close call.” -Anna Wong, Andrew Sacher and Eliza Winger
- Nick Timiraos of The Wall Street Journal: “Federal Reserve officials had made clear in the run-up to their Sept. 15-16 meeting that inflation data, more than anything else, would help them decide whether or not to raise rates after having held them steady this year. Even if the strong August employment report does not change that calculus, it does remove an objection to raising rates.”
- Olu Sonola, Head of U.S. Economics at Fitch Ratings: “This is an unequivocally strong report, which gives the Fed ample room to maintain that the labor market is stable and the economy remains at full employment. The Fed may want markets to ‘play the ball, not the referee.’ But a hot CPI print next week could be the whistle that pushes the Fed to move the policy rate higher.”
- Andrew Hollenhorst, chief U.S. economist at Citigroup: “On the margin, this report favours the Fed hawks. It keeps the labour market off the table as a concern and keeps the focus on inflation.”
- Stephen Brown, chief North America economist at Capital Economics: “Even the most committed dove would struggle to find anything in the August employment report to justify keeping interest rates unchanged.”
- Christopher Hodge, Natixis: “Most policymakers seemed sanguine about the labor market so inflation will clearly still be the primary driver of near term policy… the onus will continue to be on the doves to get a disinflationary print that justifies another hold — we are putting that bogey at about 20bps. Absent that, the Fed will likely hike in September.”
- On the other side, Wendy Edelberg of the Brookings Institution was skeptical of the data itself: “I think that these strong payroll numbers are absolutely going to get revised down. I think we don’t have the population growth to support this kind of payroll growth. I think the breakeven is closer to 20,000 a month, maybe zero, given what’s happening with arrests, deportations. I put very little weight on these payroll numbers.”
- Ira Jersey, Bloomberg Intelligence: “Hard to imagine the market not pricing a September hike after that big beat and the upward revisions. Bear flattening of the Treasury curve is not surprising.”



