Color by Numbers, Charting the S&P and Nasdaq, Good and Bad Macro, Jobs Week
Here's where we've been and where we're headed.
You've reached your free article limit
You've read 0 of 1 free Pro articles.
There was not a lot of surprise to be had across our financial marketplace last week. The market more or less did what was expected when it was expected and leaves us where we are heading into May "jobs week." You will likely recall that going into last week, we were looking for confirmation of a change in equity market trend to the downside, but we needed a pause of a day or two (or more) before we could acknowledge such confirmation. At least for the S&P 500, that scenario played out like a charm. Then, as the week wound down, we expected a broad portfolio manager-led markup as the month expired.
For those who don't really know how or why stocks closed on strength this past Friday after traders had sold hard into early strength inspired by a slightly soft print for May Core PCE, take a look at this intraday chart of the S&P 500 for Friday:
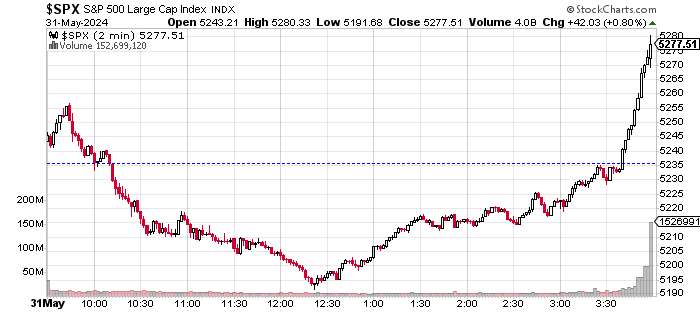
If the action looks choreographed from about 15:30 ET on, that's not because the mark-up was necessarily colluded on, it's more likely because everyone is using similar algorithms and there was a commonly desired closing price outcome across markets.
They say that "the trend is your friend." Well, when the trend is not clear, or potentially in transition, it is doing what seems natural on a day-by-day basis. The trend may or may not have evolved into something else last week, but we knew or thought we knew that there would be a pause in between the day of reversal (or Day One) and the day of confirmation (Confirmation Day). Then we knew, or thought we knew that Friday would close on equity market strength.
Just color by numbers and stay within the lines. Sometimes it's about going for the kill. Sometimes it's about not getting hurt.
Positive Macro
There was some sort of positive-looking macro released last week. According to the Conference Board, Consumer Confidence improved in May, while the Richmond Fed Manufacturing Index for May put an end to a six-month losing streak. Mind you, Richmond put a "zero" to the tape, which is not expansionary, but in this economy, anything on the manufacturing side that doesn't reflect outright retreat is considered worthy of celebration.
Staying with the positive, on Friday morning, headline April PCE hit the tape at month-over-month growth of 0.3%, maintaining a pace that had been set in February and held steady through March. The year-over-year headline print crossed at growth of 2.7%, also maintaining the pace of increasing consumer prices set in March. Those numbers both printed precisely on professional consensus.
Core PCE prices surprised just a wee bit to the downside, which put some early life in financial markets that traders sold into. At the core, April PCE inflation landed at month-over-month growth of 0.2%, below expectations for 0.3% and down from 0.3% for both February and March and from 0.4% for January. That's rather nice as it represents an actual slowing of core prices, though there is still some stickiness within. On a year-over-year basis, core PCE crossed at growth of 2.8%, which was expected, for a third consecutive month.
It might be sensible to keep in mind that while core PCE inflation did seem to relax just a bit on a month-over-month basis, the Atlanta Fed's measure for both headline and core "sticky" CPI both printed at year-over-year growth of 4.4% for April, and that kind of performance wins no awards from anyone.
Less-Than-Positive Macro
We could start here with the Chicago PMI for May, which badly missed expectations and printed in a state of contraction for the twentieth month in the past 21. Yikes. It's worse than that, May 2024 was the weakest month for Chicago area businesses since May 2020 when most large cities were basically shut down due to the pandemic. Outside of the pandemic lockdowns, May 2024 was the weakest month for Chicago area businesses since May 2009. Other than rapidly contracting economic activity, the Chicago area is just fine, I'm sure.
Yes, we could start with Chicago, but let's go straight to Thursday's Q1 GDP revision. Oh, yes... let's. This past Thursday morning, the Bureau of Economic Analysis revised that agency's estimate for Q1 GDP from growth of 1.6% down to 1.3% (q/q, SAAR). Within the report, the agency also revised the estimate for personal consumption expenditures down to 2.0% from 2.5% (q/q, SAAR). This is important. It shows that the first quarter was probably not nearly as strong as was the fourth quarter. (Maybe we should take another look at the Q4 data.) This occurred despite upward revisions to government spending. How interesting. Federal spending was revised up to growth of 1.3% from 1.2%, while state and local spending was upgraded to growth of 2.6% from 2.0%.
Here's my favorite part. GDI printed at growth of 1.5%, which is close to in-line with GDP. That's where it should be. Readers may recall back in Q3 2023, there was a mismatch between the two, in fact there was a mismatch throughout the first three quarters of 2023, despite the fact that GDP and GDI measure the same economic activity and are supposed to check one another. If you think, the reporting agencies are either inept and the financial media simply plays along, you're going to love this.
Annualized q/q growth for Q1 through Q3 for 2023 averaged growth of 3.07% when measured in GDP, but just 0.97% when measured in GDI. Now, bear in mind the huge downward revisions to 2023 job creation data that the Bureau of Labor Statistics has already let us know through their BED report in April are on the way. That's right, for Q2 and Q3 of 2023, 1.321M jobs reported as having been created simply weren't. Oopsies. Yup. That's going to leave a mark. The economy wasn't as strong as reported for much of 2023.
To quote Murray the Cop from the Odd Couple: "Yup, yup, yup, yup."
Estimates
After Thursday's nasty surprise print for the April Goods Trade Balance for April, the Atlanta Fed was forced to revise its GDPNow model for Q2 2024 GDP to growth of 2.7% from a ridiculous 3.6% (q/q SAAR). The GDP models for both St. Louis and New York Feds have been more accurate than Atlanta so far this year.
Among other regional Fed districts running GDP models for the second quarter, New York is at growth of 1.76%, St. Louis is at growth of 1.18% and Cleveland is at growth of 0.67%. Stagflation anyone? We already have what appears to be a rapidly decelerating economy, inflation remains problematic, and we now know the labor market was never as strong as was portrayed. This may not be 1970's style stagflation, but stagnant may be our potential right now with big, fat fiscal slap in the face on the way.
Losing in November might be better than winning for our two leading presidential candidates. The winner is going to have to deal with an economy facing immense headwinds almost immediately.
Marketplace
-- The S&P 500 closed up 0.8% on Friday, down 0.51% for the week, while up 4.8% for May and up 10.64% for 2024.
-- The Nasdaq Composite closed down 0.01% on Friday, down 1.1% for the week, while up 6.88% for May and up 11.48% for 2024.
-- The Russell 2000 closed up 0.66% on Friday, up 0.02% for the week, while up 4.87% for May and up 2.12% for 2024.
-- The Dow Transports closed up 1.75% on Friday, up 1.03% for the week, while up 2.21% for May and down 4.15% for 2024.
-- The Philadelphia Semiconductor Index closed down 0.96% on Friday, down 1.87% for the week, while up 9.63% for May and up 22.7% for 2024.
-- The KBW Bank Index closed up 1.75% on Friday, up 0.06% for the week, while up 3.77% for May and up 9.28% for 2024.
All 11 S&P sector SPDR ETFs closed up for the day on Friday, with Energy XLE leading the way at +2.51%. Nine of the 11 funds gained at least 1% for the session with defensive sectors taking four of the top five slots on the performance tables and growth sectors taking two of the bottom three. Eight of these SPDRs closed the holiday-shortened period in the green, still led by Energy, while Technology XLK led to the downside at -2.33%.
Earnings
Last week, it was Salesforce CRM that played the role of villain and put some excess pressure on technology shares. Then came MongoDB MDB and tech stocks really spit the bit. The group had been supported by Nvidia NVDA since that firm had reported solid earnings back on May 22nd while providing strong guidance, increasing the dividend and announcing a 10-for-1 stock split. Even last week, Nvidia outperformed its peers or near-peers as Jensen Huang's crew seems to be in a league of their own right now.
According to FactSet, which loyal readers know is my long relied upon earnings data resource, with 98% of the S&P 500 having reported for the first quarter, 78% of S&P 500 companies have beaten earnings expectations, while 61% have beaten sales or revenue projections.
First-quarter earnings are running at a blended (results & expectations) year-over-year growth rate of 5.9%, down from 6.0% a week ago. Revenue growth is still running at 4.2%, in line with last week. For the full calendar year, still leaning on FactSet's numbers, earnings are now seen growing 11.3%, on revenue growth of 5%. Calendar year 2025 is seen as even stronger than 2024.
To this point, Communication Services have run the hottest for the season, at growth of 33.9%, with Utilities in second place at +31.5%. Three sectors, Materials, Energy, and Health Care are all still suffering year-over-year earnings contractions of greater than 20%. Second-quarter earnings are currently seen growing at a 9.2% year-over-year pace on revenue growth of 4.7%. That outlook has been steadily improving over weeks.
The S&P 500 ended last week trading at 20.3 times forward-looking earnings, down from 20.7 times two weeks ago. This is still well above both the five-year average of 19.2 times and the 10--year average of 17.8 times for the index.
The Charts
Confirmation? It's there if you look for it.
Readers will recall that the Thursday prior to last Thursday both of our major indexes experienced a potential Day One (or day of reversal) of a change in trend.
Let's look at the S&P 500:
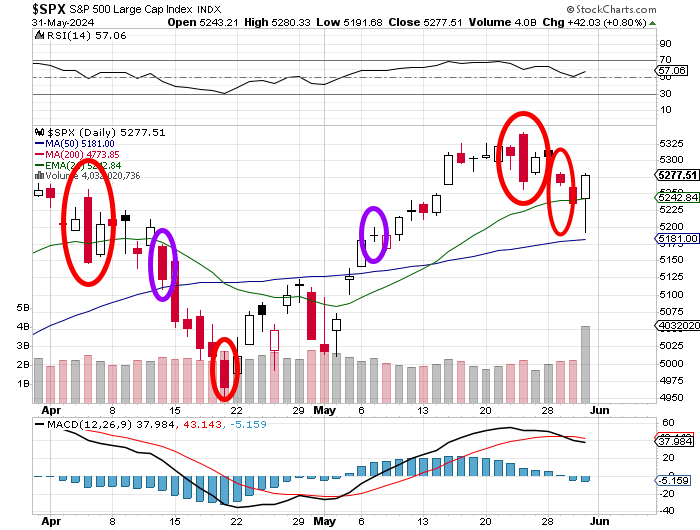
Readers will also see in the daily Moving Average Convergence Divergence (MACD), the crossing of our 12-day exponential moving average (EMA) below the 26-day EMA, as the histogram of the 9-day EMA drops below zero. These are bearish signals.
Readers can also see that trading volume increased on Wednesday and Thursday of this week, but especially Thursday. One can say that by the book, the S&P 500 indeed confirmed a downward change in trend last week.
Does the increased volume on Friday signal a "Day One" reversal to the upside? In all honesty, it might. It might also just mean that there was a lot of activity associated with the ending of the month.
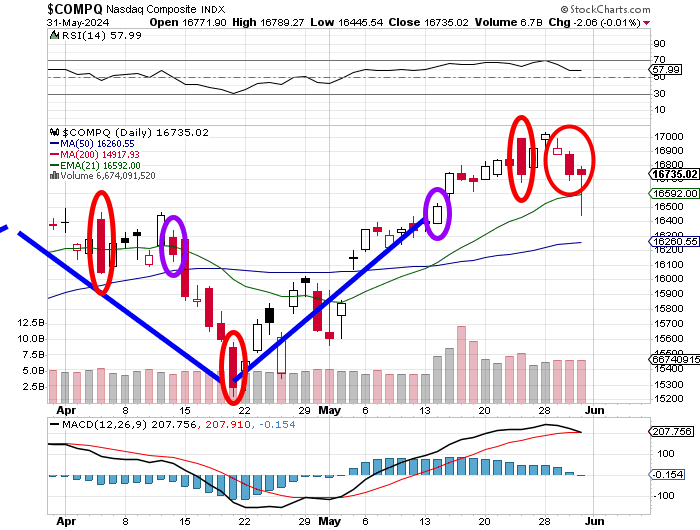
Confirming the downward change in trend for the Nasdaq Composite is trickier.
Here we have three red candle days on increased trading volume that would confirm, if not for the price discovery experienced this past Tuesday. See that, the high of that session apexed above the high of the day of reversal. Well, that certainly screws things up.
Additionally, though within the daily MACD, the 12-day EMA has met the 26-day EMA, this histogram of the 9-day EMA remains in positive territory. It is very difficult to say for sure whether or not we have confirmation of a downward change in trend for the Nasdaq Composite.
The Week Ahead
The earnings calendar sort of mellows out a bit this week. There will be a few names reporting, but this is "jobs week" and that's what will matter most for the week ahead.
Earnings... There are still a few headliners out that could keep traders busy. On Tuesday afternoon, we'll hear from Sarge-fave CrowdStrike CRWD, which is a name that I added to on weakness last week.
On Wednesday morning, Campbell Soup CPB goes to the tape along with Dollar Tree DLTR and Thor Industries THO. Later that day, Lululemon Athletica LULU will report.
On Thursday, we'll hear from J.M. Smucker SJM in the morning and DocuSign DOCU in the evening. There are no earnings to speak of set for this Friday.
Corporate... I don't see a lot on the conference scene this week. That said, Snowflake SNOW, Cisco CSCO, Precigen PGEN and Entergy ETR will hold investor/analyst events at one point or another this week.
The Fed... We have entered the Fed media blackout period ahead of the June 12 policy decision. That means that there will be no Fed speakers this week to jawbone the keyword-reading algorithms that control price discovery in this perverted era, one way or the other. Do be aware that the Bank of Canada and the European Central Bank will make policy decisions this week, on Wednesday and Thursday, respectively.
Macro... The Bureau of Labor will release their usually inaccurate twin labor market surveys for the month of May on Friday. Before we get there, we have to run through the ISM PMIs for both the manufacturing and services sides of the economy, and the ADP Employment Report, which has had a better track record over the past year or so since being reconfigured, than has had the BLS.
Economics (All Times Eastern)
09:45 - S&P Global Manufacturing PMI (May-F): Flashed 50.9.
10:00 - ISM Manufacturing Index (May): Expecting 49.8, Last 49.2.
10:00 - Consumer Spending (Apr): Expecting 0.2% m/m, Last -0.2% m/m.
The Fed (All Times Eastern)
Fed Blackout Period.
Today's Earnings Highlights (Consensus EPS Expectations)
After the Close: GTLB (-0.04)
At the time of publication, Guilfoyle was long NVDA and CRWD equity.
