You Did Not Make Money When You Sold. You Made the Money By Buying Low.
History shows buying unusually depressed, yet healthy companies, at extremely low points offers the best chance of great long-term results. Let me show you how that's working out for me.
You've reached your free article limit
You've read 0 of 1 free Pro articles.
One of the toughest concepts in investing is highlighted in my headline.
We all tend to measure success or failure on our trades after they are closed. At that point profits or losses are locked up. From that moment forward those figures will never change.
Anyone who has invested for a while knows that many shares went up further after getting out. Almost every stock we ever bought could probably have been purchased cheaper at some time after we established our position.
Neither one of those events are meaningful to our actual net worth. The only thing that counts on that score is how well we do over our true time horizon. In every case that horizon is truly “the rest of our life.”
We do not need to bat .500 to make great gains over time. There is no limit to how big potential gains can be. The most you can lose on any specific purchase is 100% of what you put in.
Mathematically, the multi-bagger gains will almost always more than offset the inevitable losers.
2024 was going well for me through March. I was still nicely ahead in early May. Then, a massive selloff in smaller-cap names and even some mid- and large-cap “value” shares knocked the crap out of my account values.
May through early July reminded me of what took place from late July 2023 through October 29, 2024.
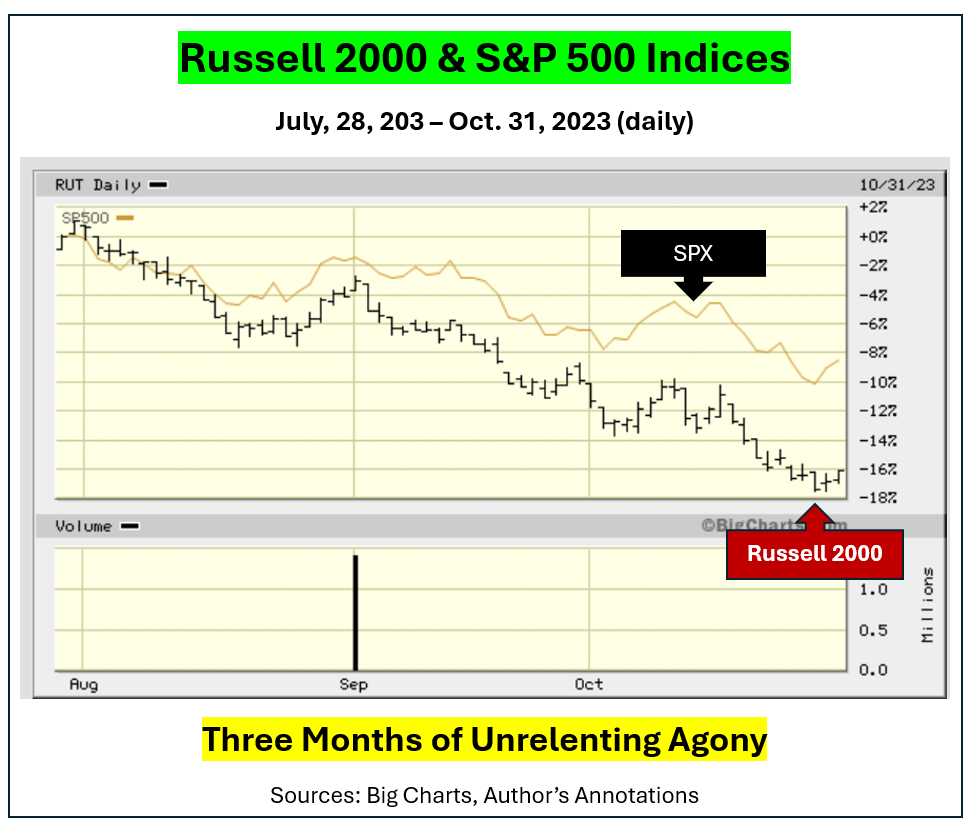
Both large-cap and smaller company shares took a beating. It went on for about three full months. Most day’s optimism ended with portfolios that were worth less than if you had sold, a day, a week or a month earlier.
It takes incredible confidence in your own analysis of what your stocks are worth to avoid caving in and selling at what you feel are crazy low prices.
Could the whole world really be wrong in selling or shorting the shares you liked best? You bet it can. History shows buying unusually depressed, yet healthy companies, at extremely low points offers the best chance of great long-term results.
Right as most media talking heads were advising giving up on ‘Value” the market did a complete 180-degree pivot. From Oct. 29, 2023 through March 28, 2024 both the Russell 2000 and S&P 500 turned sharply higher. November and December of 2023 were incredibly profitable for those who held tight or averaged down on their out-of-favor favorites.
Just before year-end 2023 the Russell had gained greater than 25% while the S&P was up around 13.8%.
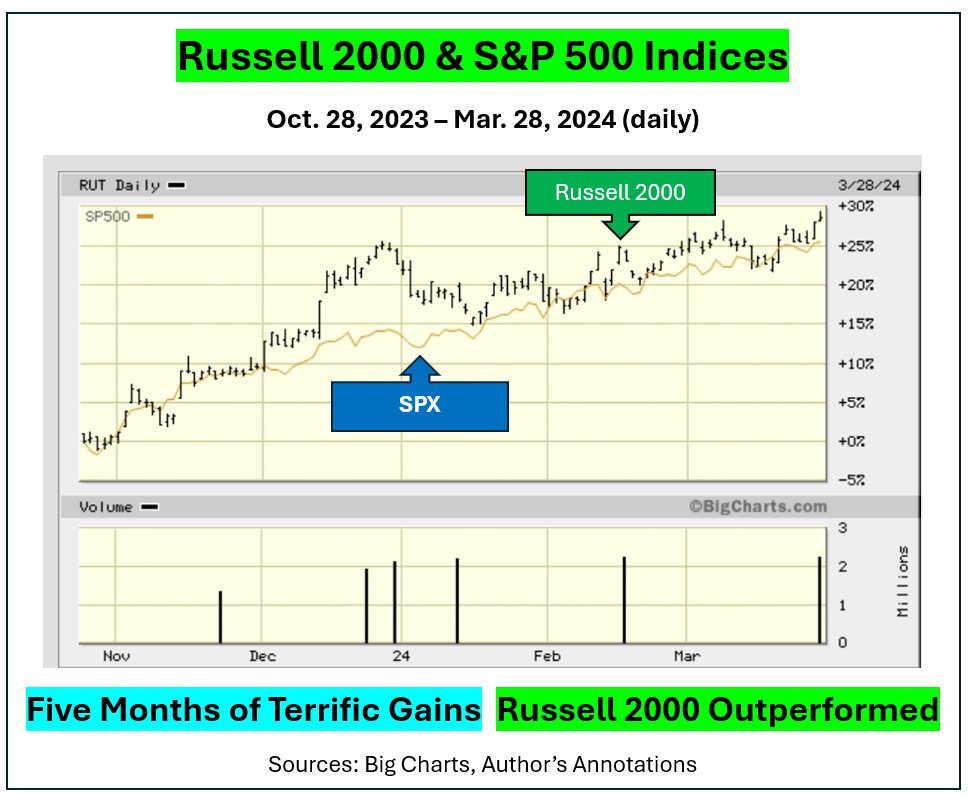
Shares bought cheaply, in the face of amazingly poor momentum and against all media advice were the biggest winners.
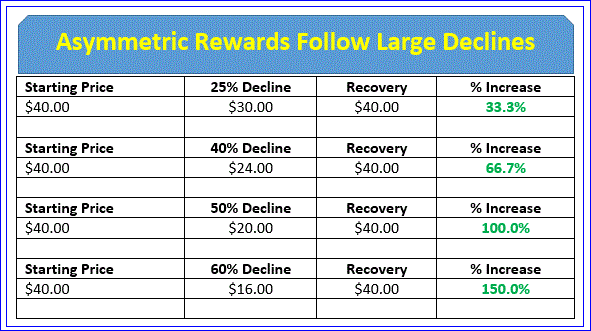
The Law of Asymmetric Rewards once again proved its eternal message. Large percentage selloffs offer huge upside merely by returning to their pre-selloff price levels.
Thursday July 11, 2024 seemed to be the day when “somebody flipped the switch” on owning small-cap and value-oriented shares.
The Russell 2000 index was up over 3% for the day while the S&P 500 index declined. That was only the second time in history that took place.
One previous data point cannot tell us much statistically speaking. That said it occurred deep in 2008’s financial crisis when most shares were very depressed and small-caps were hurt more than “quality” names.
Owning lesser-quality names back then turned out to be a great strategy. I believe this month’s historically wide discrepancy between small and larger names will be arbitraged away just as it was after March 2000 and March of 2009.
Most brokerage firms now give clients the chance to see year-to-date realized profit and loss on each account. The following data is from my three accounts — one margin account, a traditional IRA, and a Roth IRA.
The realized net gains shown are from positions bought during previous downturns and sold so far in 2024. Most of the gains came from American Woodmark AMWD, which became my single largest dollar holding during June 2022 after falling from an all-time peak north of $148 (during 2018) to south of $41.
Many of my short-term realized gains came from short put and covered call options which were closed or expired this year although they were written (sold) in previous years.
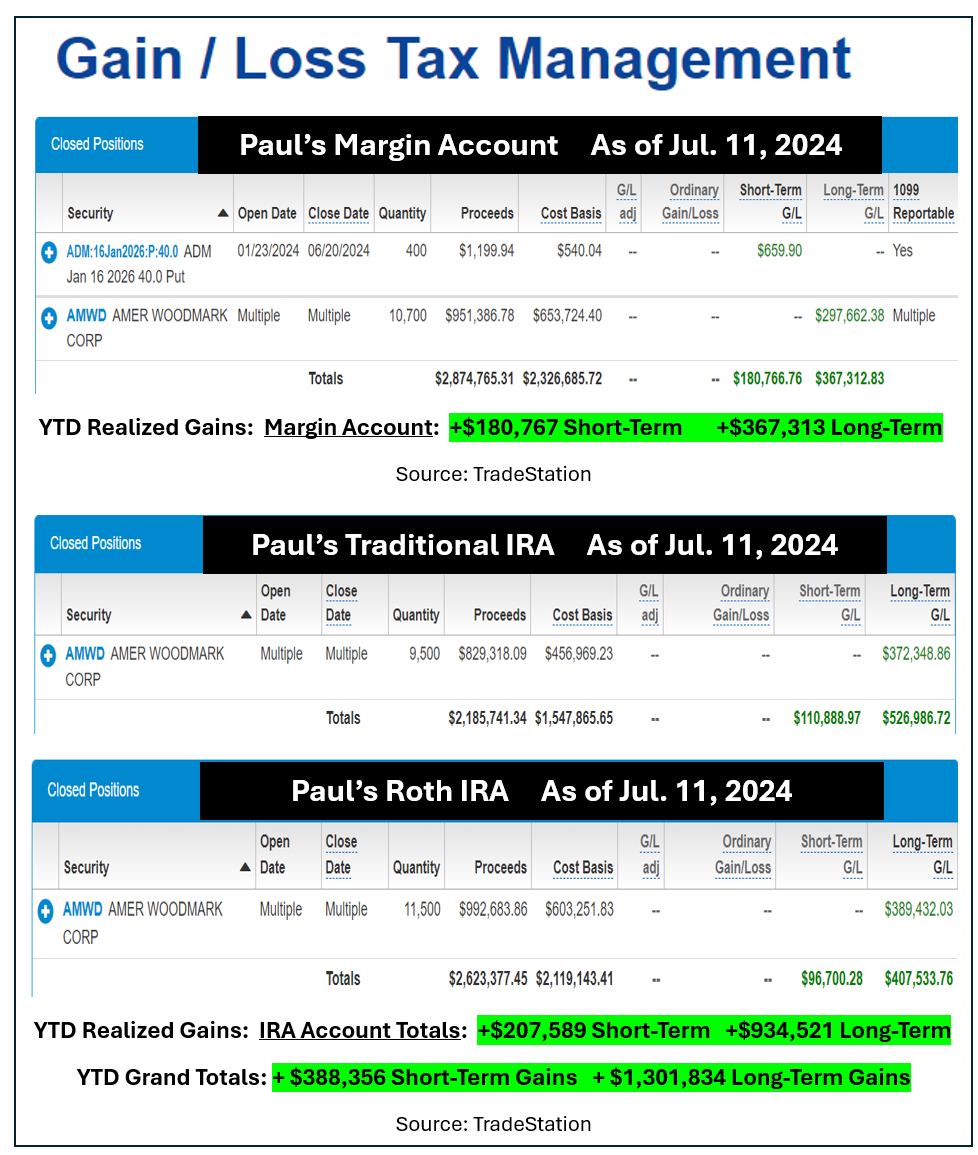
The bulk of my margin account’s gains qualify for favorable long-term capital gains tax treatment. $637,8876 in YTD gains were realized in my traditional IRA account. All tax due will be deferred until I finally withdraw money from that IRA.
The $504,234 realized YTD gains in my Roth IRA are tax-free due to the rules regarding Roth IRAs. All future gains on this now quite large account will continue to benefit from its tax-free forever status.
Roth IRAs are the single best wealth creation investment vehicle ever offered to the American taxpayer.
If your are eligible to have one you are crazy not to fund it immediately either through new contributions or conversion from an existing traditional IRA.
Market volatility and the pain of inevitable bear markets is the price you pay for long-term investment success.
In the end remaining 100% invested in equities is the surest path to accumulating true wealth.
My highest conviction stocks over the years were the ones which became my largest dollar holdings. Since 2020 they included Caleres CAL, Tractor Supply TSCO, and American Woodmark AMWD.
All three worked out brilliantly over time. I averaged down repeatedly on those on the way to their becoming huge positions.
More Paul Price:
- Short-Term Variations Make Us Crazy. They Also Create Opportunities.
- Investing Is a Marathon. Trading Is a Sprint.
- Fun Facts That Help Investors Make Money
Right now my largest holding is Jack in the Box JACK. My conservative fair value estimate for JACK is $104. It would not surprise me to see it reach $120-$160 within 12 to 24 months. At this week’s low of $46.10 it yielded 3.82% while selling for just 7.1-times calendar 2024 EPS estimates.
Value Line says JACK’s 10-year median multiple has been 19.0x along with about a 1.61% typical yield.
Jack sold for $100 as far back as 2015 when EPS were on track for $3.00. It fetched at least $113 during both 2016 and 2017 on final EPS of $3.88. It carved out an all-time high of $124.50 in 2021 when EPS hit a stimulus-check fueled $7.19.
Estimated CY 2024 EPS are expected to come in at $6.50.
JACK is in the midst of a major expansion from West Coast states into Eastern U.S. territories such as Chicago, Virginia, Florida, Georgia and Michigan. Management says they will be represented in forty of the fifty states by 2030.
Money invested in JACK this week at from $46-$49 per share is likely to show up down the road as enormous, realized gains in all three of my accounts. I will keep you posted as things progress.
At the time of publication, Price was still long part of his AMWD and CAL positions; long JACK shares and short JACK options; short AMWD covered calls; and short CAL covered calls and naked puts. He has no current positions in TSCO.