Friday’s After-Hours Advancers and Decliners
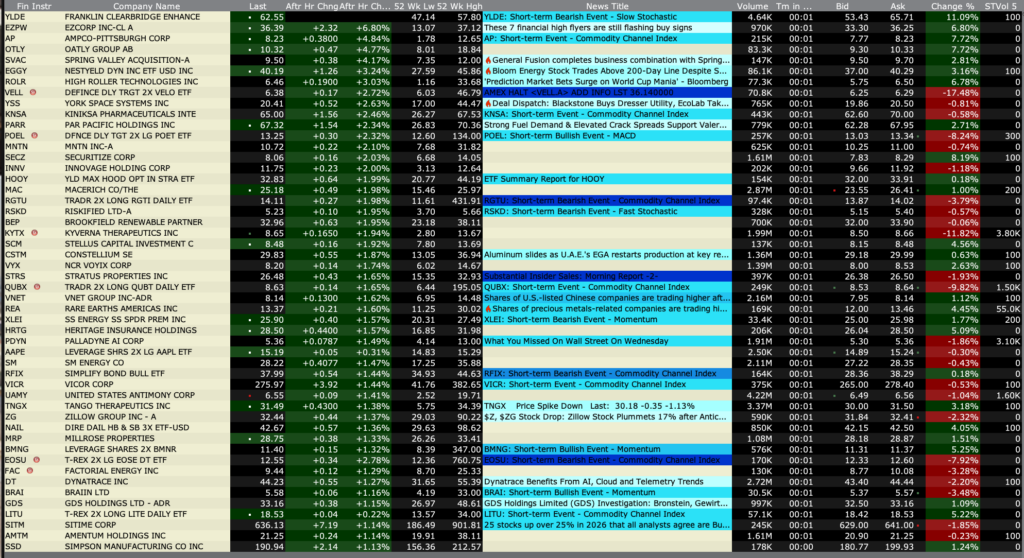
After-Hours % Advancers
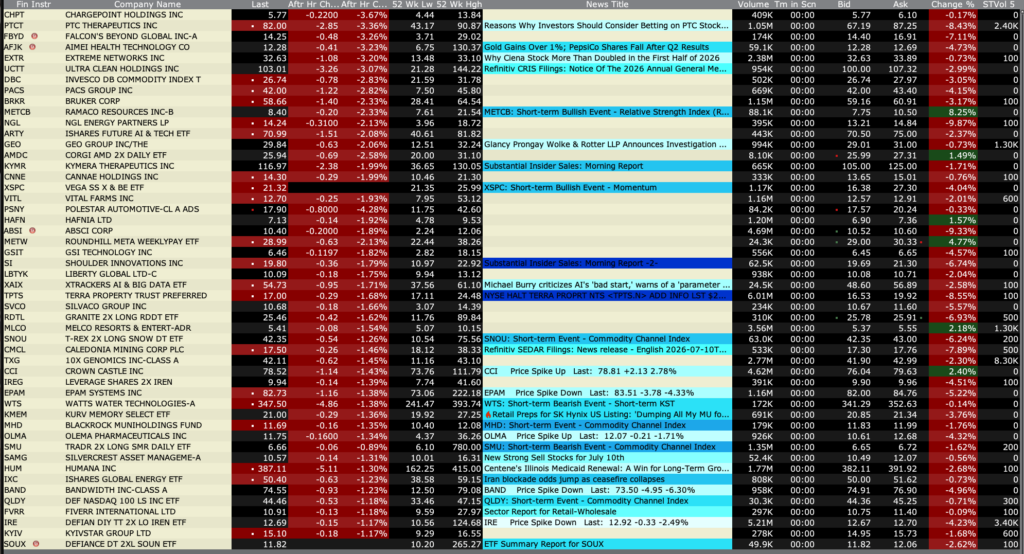
After-Hours % Decliners
Position: None
BY Doug Kass · Jul 10, 2026, 4:45 PM EDT
 Doug KassDoug Kass
After-Hours % Advancers
After-Hours % Decliners
Position: None
BY Doug Kass · Jul 10, 2026, 4:45 PM EDT
Closing Volume
– NYSE volume 29% below its one-month average
– NASDAQ volume 33% below its one-month average
– VIX index: down 5.05% to 15.04
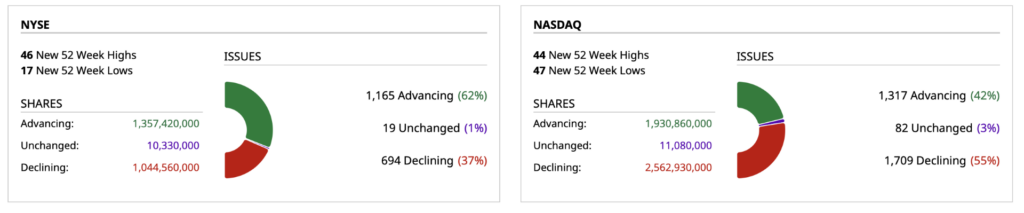
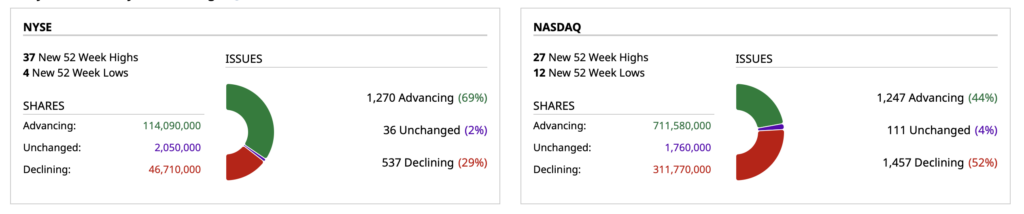
Breadth
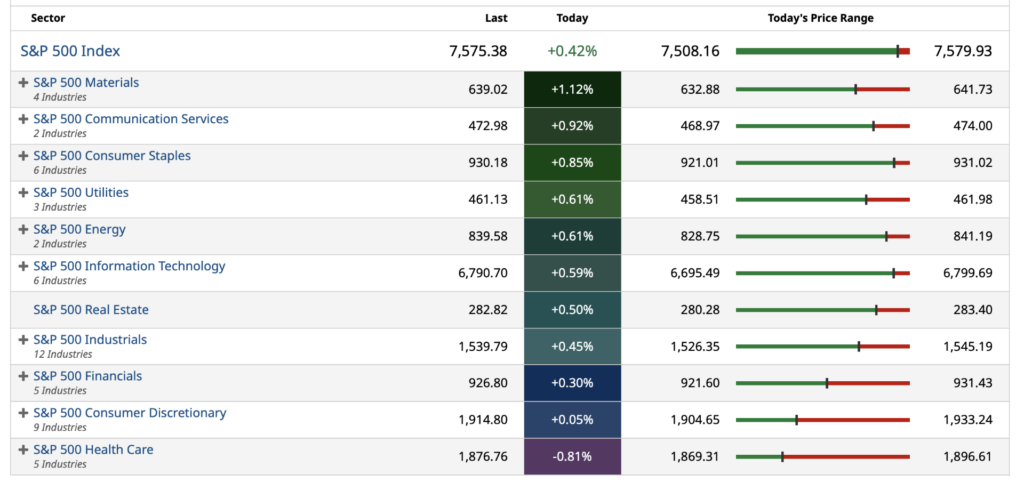
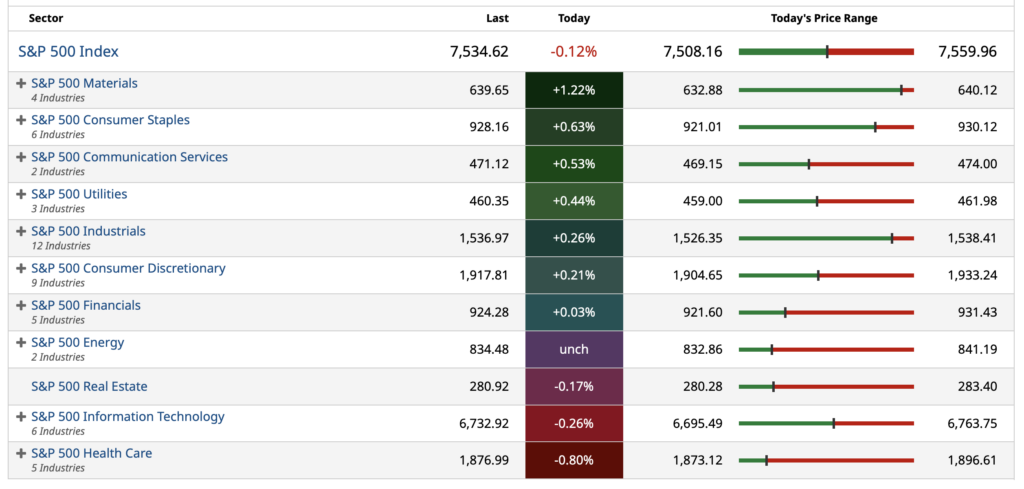
S&P 500 Sectors
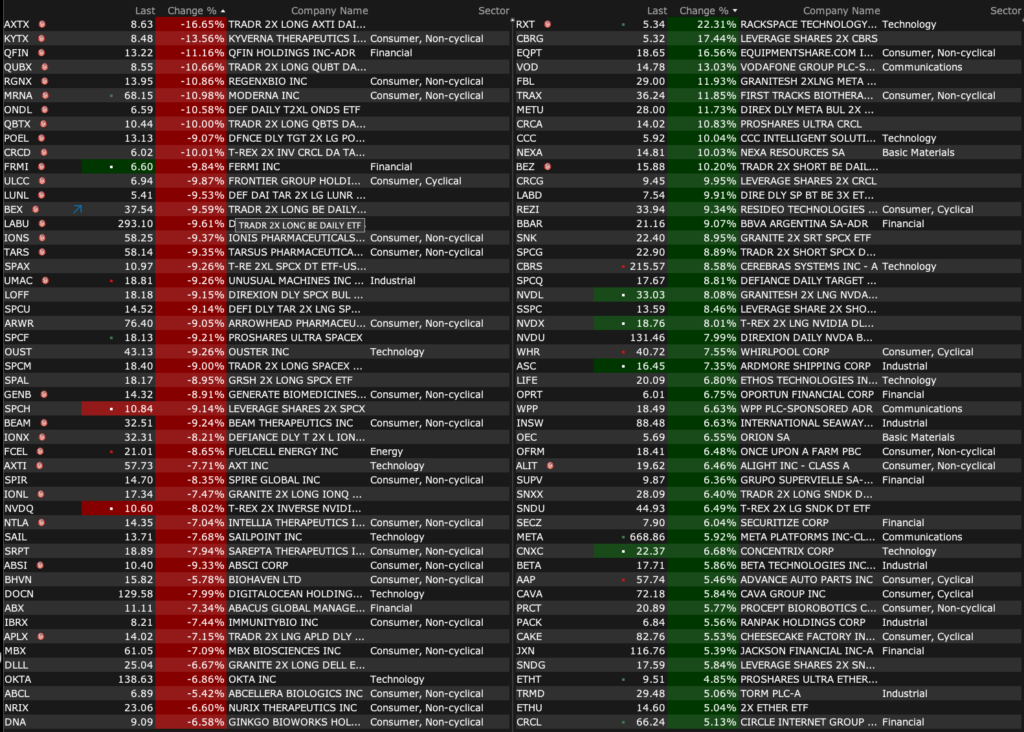
% Movers
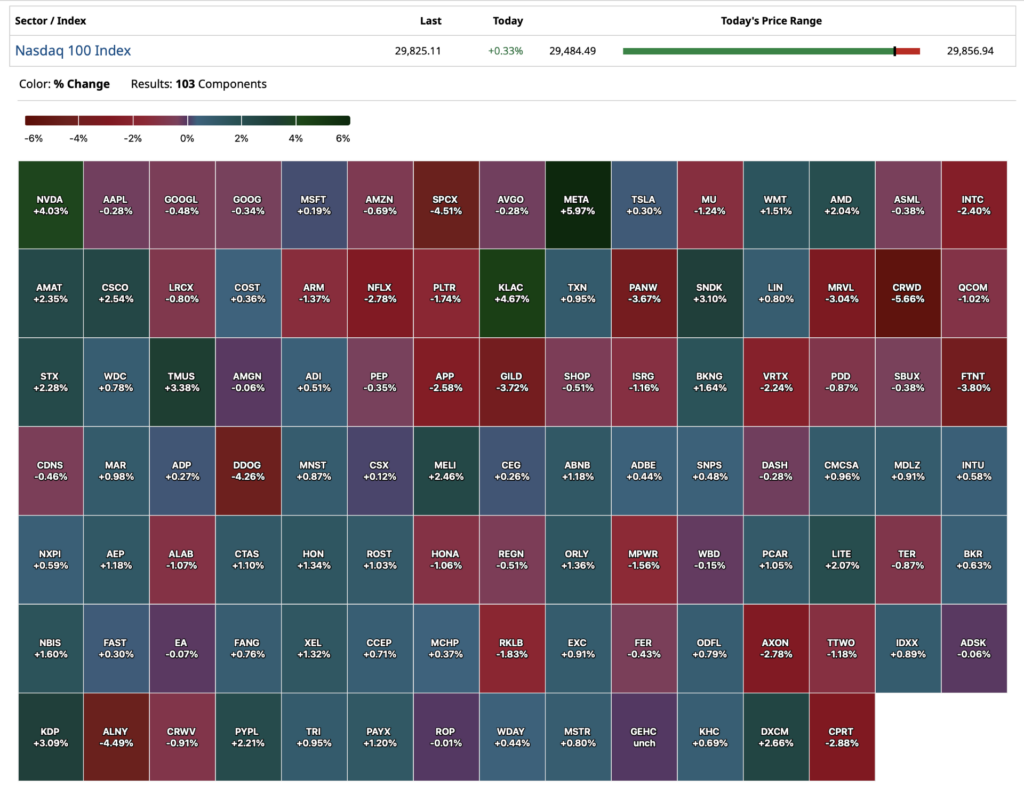
Nasdaq 100 Heat Map
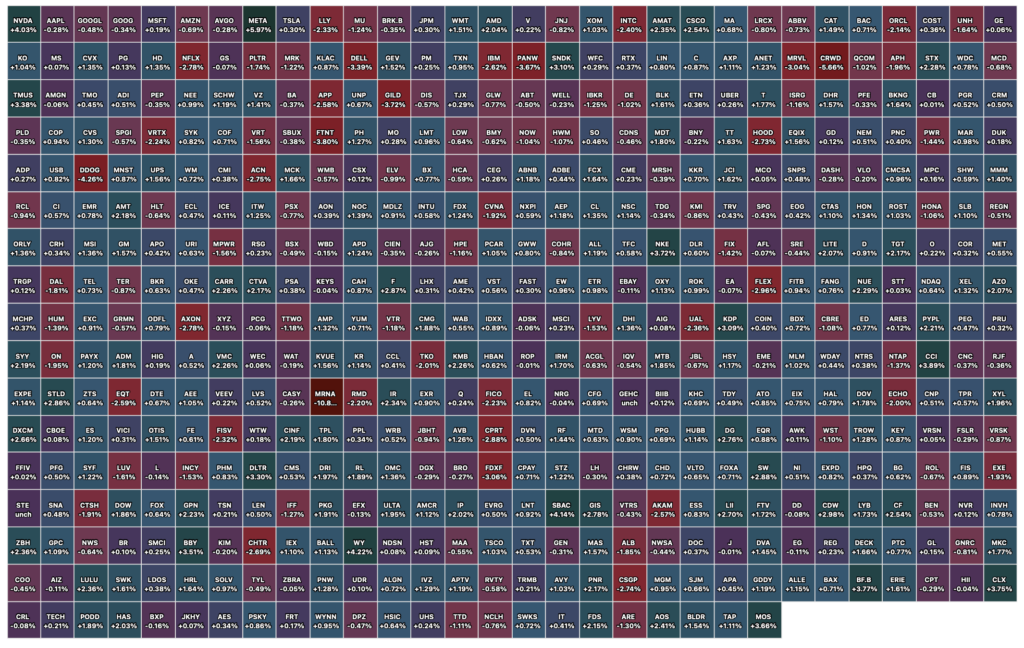
Closing S&P 500 Heat Map
Position: None
BY Doug Kass · Jul 10, 2026, 4:26 PM EDT
Position: None
BY Doug Kass · Jul 10, 2026, 3:12 PM EDT
From Peter Boockvar:
Positives,
1) From the NY Fed Consumer Expectations Survey for June, “Labor market expectations improved, with job-finding expectations increasing and job-loss expectations and expectations about the unemployment rate declining. Spending growth expectations were unchanged. Respondents were more optimistic about their future household financial situations, while expectations about future credit availability deteriorated slightly.”
2) Initial jobless claims were 215k vs 217k last week. The 4 week average of 219k is down from 223k last week. Continuing claims were little changed at 1.814mm vs 1.806mm in the week before.
3) In response to rising truck freight prices, “Preliminary North American net orders for Class 8 heavy duty trucks surged in June, driven by soaring freight rates and a rapidly recovering trucking market, according to FTR and ACT Research.”
4) From Delta: “We delivered $1.4 billion in pre-tax profit while absorbing the highest quarterly fuel expense in our history, reflecting broad demand strength, growing brand preference and momentum across our diversified revenue base…Main cabin unit revenue grew double digits, marking the second consecutive quarter of positive main cabin growth.”
5) From Levi Strauss: “Our consumer continues to be resilient. And has reflected another quarter of strong results. It’s broad based across channels, geographies and categories. So, you think of the beat, it’s geographically, it came from the US and Asia. Europe was as expected. It came from wholesale and came from women…we are seeing strength across value, core and premium.”
6) From MSC Industrial Direct: “The growth of our installed base is showing the benefits of an improving macro environment that should result in higher sales across existing locations, an effect which we commonly refer to as the coiled spring. We started to see early signs of this in the third quarter, with daily sales trends on a per unit basis showing volume improvement…we are seeing further signs of an industrial recovery taking shape with positive IP readings across most of our top manufacturing end markets and five consecutive months of MBI readings above 50.” They raised prices by 7.2% y/o/y by the way. “Tungsten is still the largest driver of our inflation, and I think we’re not done.” Tungsten prices are up 500%.
7) Potentially positive for Japanese assets and the yen was this very notable comment from the Japanese finance minister who said, “We would like to pursue measures that would encourage pension funds, including GPIF, to make substantially greater investments in Japanese financial assets.” JGB yields fell sharply and stocks and the yen both rallied.
8) Base wage growth in Japan in May remained strong, up 3% y/o/y.
9) Inflation stats out of China were about as expected. PPI rose 4.1% y/o/y while CPI was higher by 1% ex food and energy.
10) German factory orders in May exceeded expectations and April was revised to less negative. Industrial production and export growth also both beat expectations.
Negatives,
1) In the June NY Fed Consumer Expectations Survey, one yr inflation expectations rose to 3.7% from 3.5% even as expectations for gasoline prices fell to the lowest since 2022. Higher expectations for health care costs and rents offset the gas decline, along with a lower outlook for food and college tuition costs.
2) The June ISM services index at 54 was spot on with expectations but down slightly from the 54.5 print seen in May and around the half yr average of 54.3. The Business Activity component fell 2.3 pts m/o/m to 55.4 and below the 6 month average of 56.7. Industry breadth softened in the month with 14 sectors seeing growth vs 17 in May. Four industries saw a contraction in their business vs one in May.
3) Existing home sales in June (likely covering contracts signed March thru May, and thus the key spring season) totaled 4.09mm, still bouncing along 30 yr lows. Prices rose 1.8% y/o/y with months’ supply at 4.6. The NAR said “The back-and-forth in monthly home sales activity, driven by mild fluctuations in mortgage rates, shows how sensitive home buyers are to affordability conditions…Without consistent gains in inventory, home prices can accelerate. It is critical to introduce more supply to the market to widen the opportunity for homeownership.”
4) The Atlanta Fed’s Wage Growth Tracker for June was up 3.6% y/o/y vs 3.5% in May and 3.6% in April. While fine in absolute terms, it’s growing no faster than the rate of inflation so consumers are seeing zero REAL wage growth.
5) From DAT Freight & Analytics: “The national average van truckload spot rate exceeded the contract rate in June for the first time since February 2022, and overall rate growth far exceeded volume growth last month. Spot linehaul rates increased at least 39% y/o/y across all three equipment types.”
6) Diesel prices jumped as Ukraine continues to knock out Russian refineries. Russia supplies 11% of the global seaborne diesel demand.
7) Container shipping prices were up slightly this week, though holding its gains. The Shanghai to NY at $7,904, up $2 is at the highest since September 2024. Shanghai to LA saw the price rise by $133 w/o/w, or by 2% to $6,482.
8) Influenced by the holiday, purchase applications fell .6% w/o/w and little changed over the past 3 weeks, ahead of what will be another rise in mortgage rates if the move in the US 10 yr yield holds. Refi’s were down by 4.1% w/o/w.
9) From a rent price perspective, Apartment List said, “we now appear to have hit an inflection point, signaling that the rental market may finally be stabilizing as construction slows and the recent influx of new units gets absorbed.” And, “The construction boom peaked in 2024, when we saw over 600 thousand new multifamily units hit the market, the most new supply in a single year since 1986. Since then, deliveries of new apartments have slowed considerably, albeit while remaining fairly robust by historic standards. Despite being on the downslope of the construction boom for nearly two years, the market had been struggling to absorb the swell of new inventory. That may finally be changing, as we see multifamily occupancy also hitting an inflection point in tandem with rent growth.”
10) From Pepsi: “obviously the Iran war and the impact on gas prices have been meaningful, not only in the US but across the world. Our international business continues very strong, and we were able to grow 7%, accelerating. In the US, we’re seeing the consumer changing behaviors, basically an acceleration of some of the behaviors we saw in the past. Probably some channels, more the impulse channels, have been impacted where there is more of a correlation with the price of gas. Certain convenience stores and some other independent, we’ve seen a slowdown of the conversion of traffic into purchases. So we’re seeing that.”
11) From Kura Sushi: “We were certainly disappointed that traffic came in negatively…but we believe that this is largely due to elevated gas prices…As the gas prices have eased, we’re beginning to see a little bit of benefit as we’ve entered Q4, but those benefits are partially offset by how popular the World Cup is, and so the guidance that we’re providing for the revenue contemplates the Q3 and Q4 macro background as well as the construction delays”
12) Potentially negative for assets around the world and the US dollar vs the yen was this very notable comment from the Japanese finance minister who said, “We would like to pursue measures that would encourage pension funds, including GPIF, to make substantially greater investments in Japanese financial assets.”
13) Japan said that June PPI rose 7.1% y/o/y with their heavy reliance on imported energy but that should get some relief, offset by a weak yen.
14) The Reserve Bank of New Zealand raised its cash rate to 2.50% as expected. And, they hinted at further increases, “With inflation still above target and economic activity expected to strengthen, some further reduction in monetary stimulus is likely to be required.”
Position: None
BY Doug Kass · Jul 10, 2026, 2:15 PM EDT
BY Doug Kass · Jul 10, 2026, 2:01 PM EDT
I have a call at 1130 AM and a research call at 1:30 PM today.
Both will take about thirty minutes.
Position: None
BY Doug Kass · Jul 10, 2026, 11:42 AM EDT
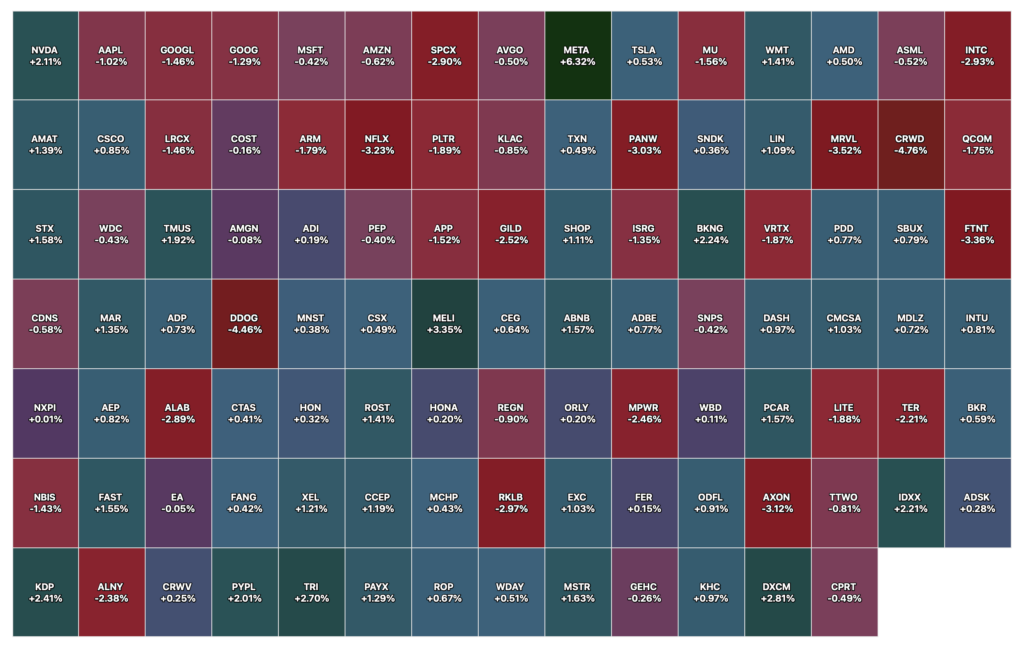
– NYSE volume 35% below its one-month average;
– Nasdaq volume 33% below its one-month average;
– VIX index: down 0.63% to 15.74
Positions: None.
BY Doug Kass · Jul 10, 2026, 11:25 AM EDT
BY Doug Kass · Jul 10, 2026, 10:45 AM EDT
For the second time in a month MSOS (MSOS) is my Trade of the Week.
Investors are likely misinterpreting the progress at the current hearings that l expect will lead to a rescheduling of adult recreations use of cannabis.
I have aggressively added to MSOS and the individual stocks in this period of weakness for the previous reasons mentioned in my Diary (markets are stabilizing, the fiscal debt cliff has been resolved with numerous refinancings (at favorable terms), likely resolution of tax (UTP) and custodian issues that will lead to rising institutional demand, etc..)
Positions: Long MSOS VL
BY Doug Kass · Jul 10, 2026, 10:30 AM EDT
Positions: None.
BY Doug Kass · Jul 10, 2026, 10:25 AM EDT
Moved to small-sized index shorts:
* SPY (SPY) $753.10
* QQQ (QQQ) $723.35
Positions: Short SPY S QQQ S
BY Doug Kass · Jul 10, 2026, 10:00 AM EDT
While I don’t think this initiative has a material meaning or consequence, it probably contributed to some confusion and likely took cannabis stocks lower late Thursday.
I was an aggressive buyer (as previously noted) in the correction:
Position: Long MSOS VL
BY Doug Kass · Jul 10, 2026, 10:00 AM EDT
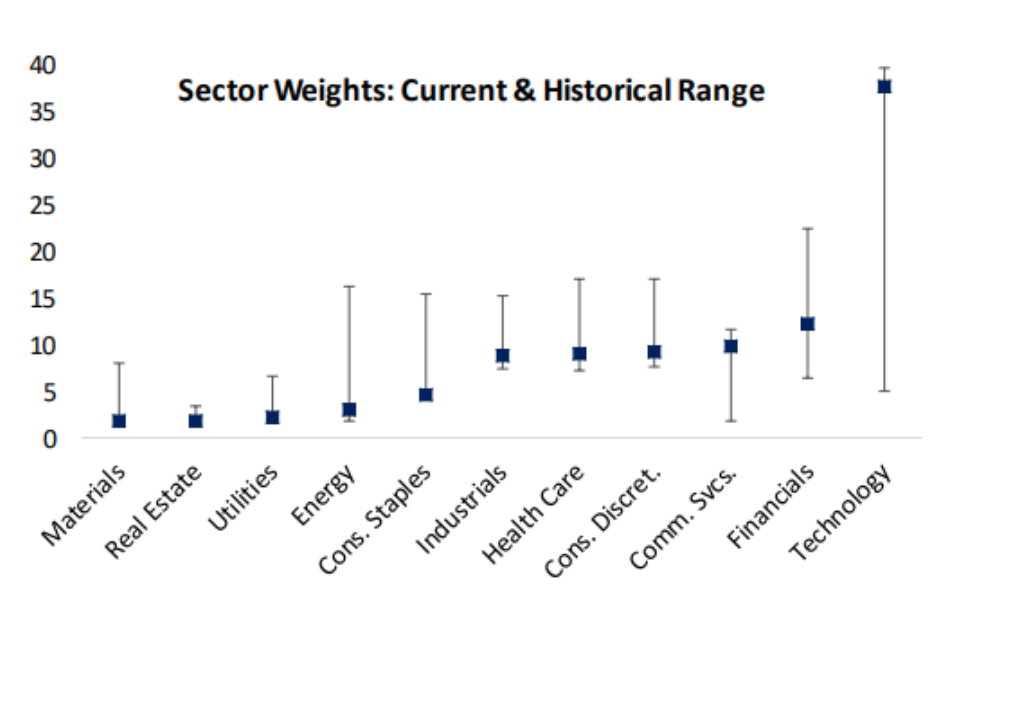
* Whoa Nelly!
Here is a terrific chart which graphically shows how much share of the stock market technology has risen over the last three decades:
Positions: None.
BY Doug Kass · Jul 10, 2026, 9:50 AM EDT
Added to following shorts:
* SPY (SPY) $752.76
* QQQ (QQQ) $722.46
* GRNY (GRNY) $27.86
Positions: Short SPY VS QQQ VS GRNY M
BY Doug Kass · Jul 10, 2026, 9:45 AM EDT
Positions: None.
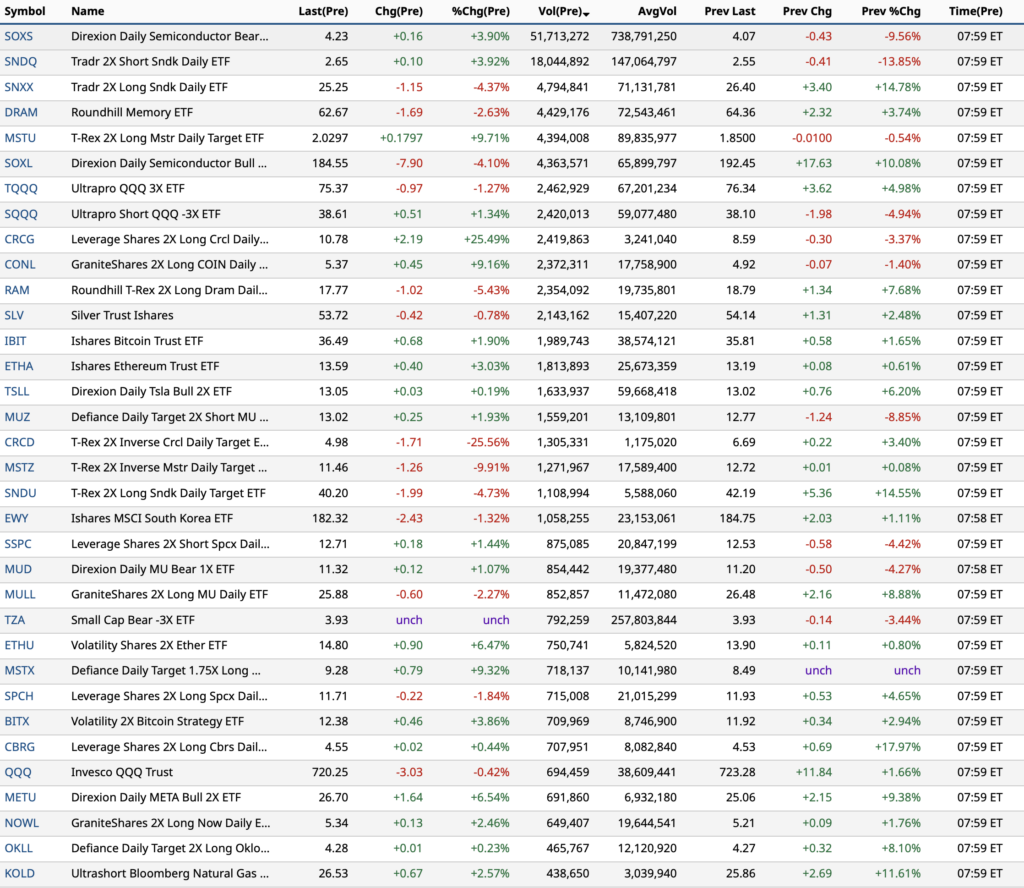
BY Doug Kass · Jul 10, 2026, 9:35 AM EDT
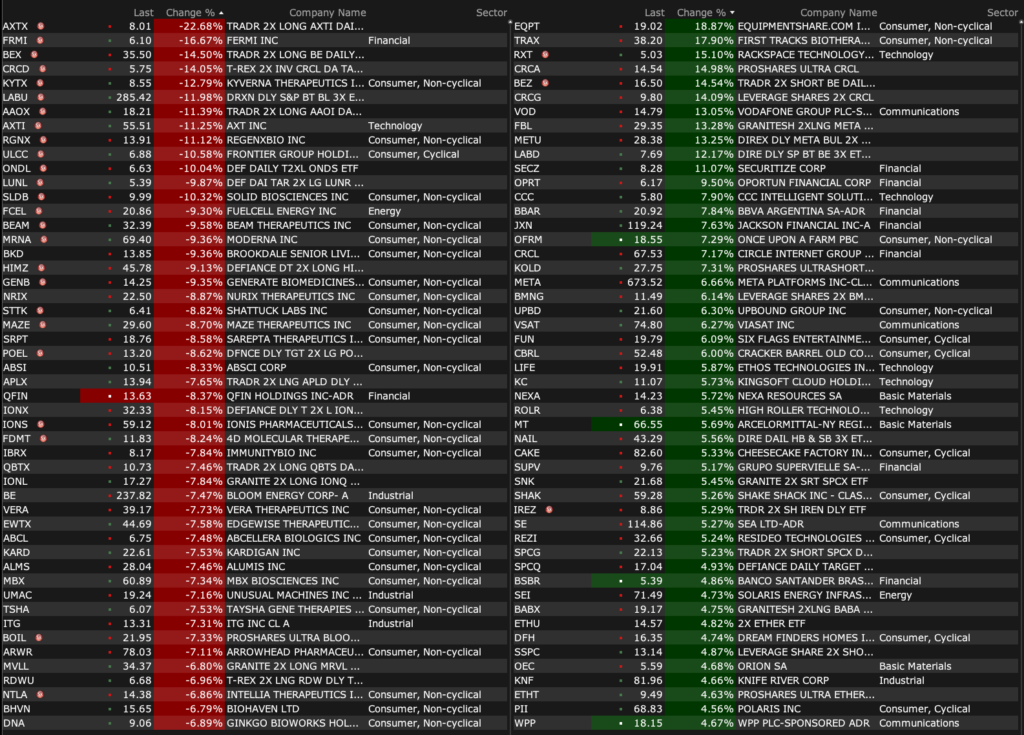
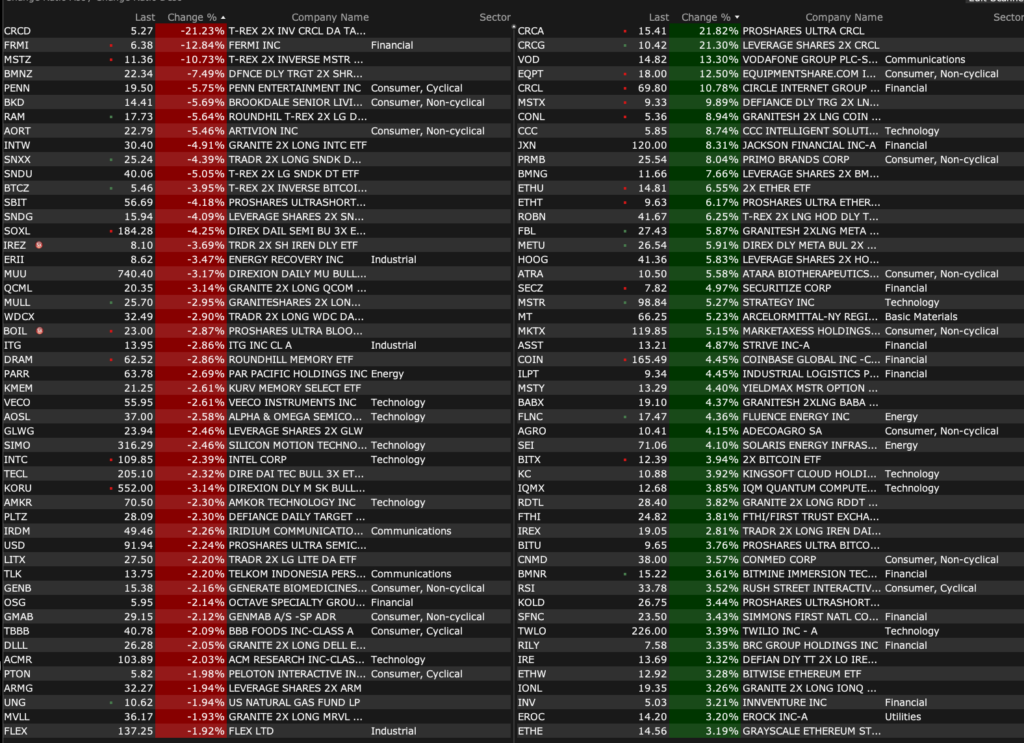
-WDFC +16% (earnings, guidance)
-EQPT +12% (raises guidance and announces buyback program)
-CRCL +11% (receives OCC approval to establish First National Digital Currency Bank)
-CCC +9.5% (considering sale and hires Morgan Stanley as advisor)
-PERF +9.2% (enters going-private merger agreement at $2.00/shr cash)
-SEI +4.8% (to replace CPRX in the S&P SmallCap 600 Index)
-TWLO +2.6% (Stifel Nicolaus Raised TWLO to Buy from Hold, price target: $260)
-UUUU +2.5% (insider buys)
-SILO -20% (prices private placement of 620.0K shares at $6.452/shr with warrants)
-FRMI -13% (prices upsized $375M 5.00% convertible senior notes due 2031)
-BKD -5.6% (reports June operating metrics including occupancy)
-SXT -3.7% (Holder reportedly said to be offering 2.05M shares at $114-116/share worth $237.7M in block trade)
BY Doug Kass · Jul 10, 2026, 9:05 AM EDT
Positions: None.
BY Doug Kass · Jul 10, 2026, 8:45 AM EDT
* With head cheerleader Drawdown Josh Brown, Fin TV, emboldened by relative and absolute price action, are now universally bullish on Apple (see my comments below)
* One I agree with… (we shorted APPL in the premarket at $315)
From Felix Wang (the analytical obstetrician and mortician on Apple!) at Hedgeye:
My comments from three days ago:
https://pro.thestreet.com/dougs-daily-diary/2026-07-08#apple-sis-boom-huh-1783509301
Positions: Short AAPL VS
BY Doug Kass · Jul 10, 2026, 8:31 AM EDT
Positions: None
BY Doug Kass · Jul 10, 2026, 8:19 AM EDT
Following the conflicted slew of buy initiations from Wall Street’s sell-side, we remain short of SpaceX (SPCX):
Position: Short SPCX (VS)
BY Doug Kass · Jul 10, 2026, 8:00 AM EDT
From The Stock Trader’s Almanac:
NASDAQ’s annual “Christmas in July” Midyear Rally, defined as the last three trading days of June through the first nine trading days of July, is nearing its conclusion, and 2026 has largely followed the script. After a powerful advance into late June, the rally did pause as traders locked in gains, digested fresh economic data and reacted to the latest headlines. As of today’s close, July 9, NASDAQ has advanced 3.35% with three trading days to go.
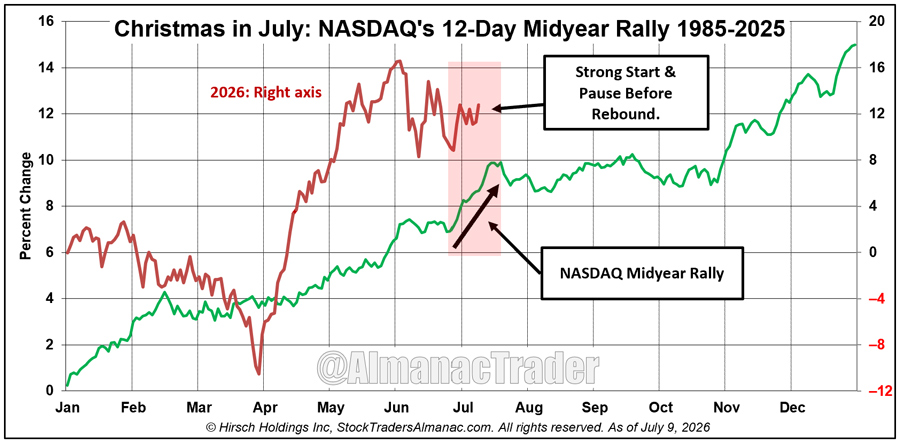
While the final outcome remains to be seen, the recent consolidation is not unusual and fits the historical tendency for the rally to experience brief interruptions before a final push. Since 1985, this 12-trading-day seasonal window has produced an average gain of 2.5% and finished higher in roughly four out of every five years, making it one of NASDAQ’s most consistent seasonal patterns. Whether the rally can finish with another burst higher or begins to fade into the typical second-half summer lull will likely set the tone for the balance of July.
NASDAQ Seasonal MACD Update
NASDAQ’s Seasonal MACD indicator entered June in negative territory and remained there until today. As of today’s close, it is positive. Currently NASDAQ would need to decline at least 342.20 points (–1.31%) in a single day to turn its MACD (12-26-9) negative. Continue to hold associated positions in QQQ and IWM.
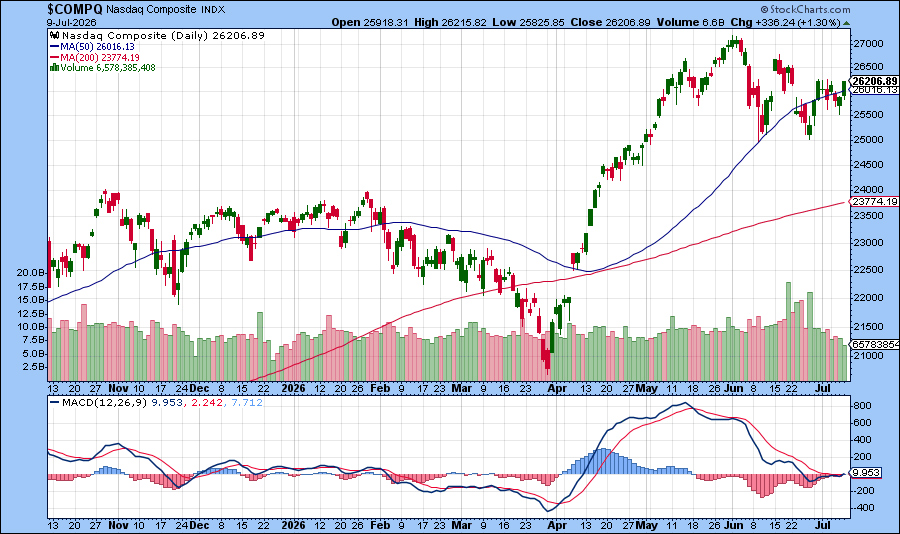
When NASDAQ’s Seasonal Sell signal criteria are satisfied, we will send an email to all members. As a reminder, we use daily closing prices to calculate MACD. Any intraday signal does not apply. At that time, we will finish repositioning the Portfolios for the “Worst Months” and anticipate adding to some or possibly all of the existing bond ETFs and cash holdings in the Tactical Seasonal Switching Strategy portfolio.
Position: Short QQQ (VS)
BY Doug Kass · Jul 10, 2026, 7:50 AM EDT
Position: None
BY Doug Kass · Jul 10, 2026, 7:40 AM EDT
Position: None
BY Doug Kass · Jul 10, 2026, 7:30 AM EDT
* Costco and Walmart’s share prices continue to fall…
Position: None
BY Doug Kass · Jul 10, 2026, 7:20 AM EDT
Position: None
BY Doug Kass · Jul 10, 2026, 7:10 AM EDT
Position: None
BY Doug Kass · Jul 10, 2026, 7:00 AM EDT
Wolf Street howls about the rising supply of unsold residential units.
Position: None
BY Doug Kass · Jul 10, 2026, 6:50 AM EDT
Position: None
BY Doug Kass · Jul 10, 2026, 6:40 AM EDT
Here were yesterday’s things:
* New short position — Bloom Energy (BE) at $265.39
* New option position — Bought Nvidia (NVDA) puts
* Reshorted SPY at $748.88 and QQQ at $722.58
* Shorted GRNY at $27.81
* Shorted JOET at $45.97
* Reshorted Morgan Stanley (MS) at $223.61
* Supersized long MSOS at $4.46
Position: Long MSOS (VL), NVDA puts; Short SPY (VS), QQQ (VS), MS (S), GRNY (M), JOET (S), BE (S)
BY Doug Kass · Jul 10, 2026, 6:30 AM EDT
BY Doug Kass · Jul 10, 2026, 6:20 AM EDT
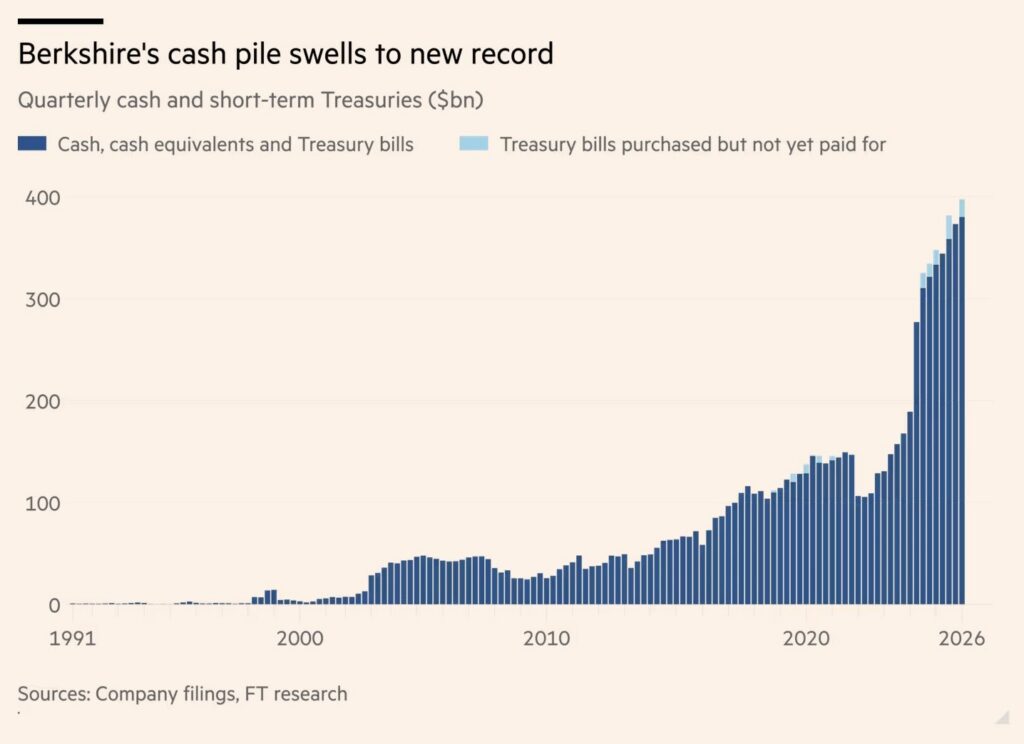
With a record $397 billion of cash, Berkshire Hathaway (BRK.A) (BRK.B) can buy all but 26 of the constituent members of the S&P 500:
Position: None
BY Doug Kass · Jul 10, 2026, 6:10 AM EDT
Wolf Street howls about U.S. crude oil production.
Position: None
BY Doug Kass · Jul 10, 2026, 6:00 AM EDT
The S&P Oscillator remains in the same narrow overbought range at 2.55% vs. 2.16%.
Position: Short SPY (VS), QQQ (VS)
BY Doug Kass · Jul 10, 2026, 5:50 AM EDT
Higher stock prices yesterday on lower volume:
– NYSE volume 24% below its one-month average
– NASDAQ volume 35% below its one-month average
Position: None
BY Doug Kass · Jul 10, 2026, 5:40 AM EDT
The embedded tweet could not be found…
Felix Wang called the iPhone super cycle when no one else would. $AAPL is up +18.8% since he went long in Oct. 2025. Now he's flipping from Long to Short. The super cycle he called is breaking, and he sees -23% downside from here. See why👇
Bitcoin fell to its 2nd most oversold level in history on the monthly chart 🚨 The only time it was lower was December 2022, when $BTC went on to soar 660% over the next 3 years 📈 🥳 🤑

🚨THIS HAS NEVER HAPPENED THIS CENTURY: The correlation between the S&P 500 equal-weighted index and the S&P 500 itself has dropped to ~78%, its lowest level on record. This is happening because a small group of mega-cap stocks continue to dominate the index. The 10 largest Show more

August 26–September 10 is my expected range, and I find it highly unlikely that the final rule comes later than September. For example: (1) I expect 14 days for post-hearing briefs, though it could be 20; (2) I expect the ALJ to have relatively little to process from those Show more


Jim Cramer says investors are making a mistake with the trillion-dollar tech giants cnbc.com/2026/07/09/jim…
Costco $COST falls to its lowest price in more than 6 months 📉 📉 $1.50 Hot Dogs aren't bringing in customers anymore?

There is a 90% chance that SpaceX $SPCX will crash, warns GMO cofounder Jeremy Grantham, who believes that the company's projects are "utterly inconceivable" 🚨 For magnified bearish exposure, consider the Tradr 2X Short SpaceX Daily ETF $SPCG from @TradrETFs


SpaceX, the biggest IPO in history, has arrived! For those wanting leverage, the 2X Long and 2X Short $SPCX ETFs are available 🎯 Tradr 2X Long SpaceX Daily ETF Ticker: $SPCM Tradr 2X Short SpaceX Daily ETF Ticker: $SPCG ETFs brought to you by @TradrETFs

The embedded tweet could not be found…
SpaceX $SPCX has now lost $1 Trillion in market cap since hitting an all-time high last month 📉 📉


