Federal policy momentum continued to reshape the cannabis landscape over the weekend, as Alabama public health officials withdrew their objection to federal marijuana rescheduling and Congress saw a bipartisan push to protect applicants with past cannabis use. These developments add to a wave of regulatory clarity that matters for operators, workers and market access.
While markets were closed Sunday, these policy shifts reinforce a broader trend toward normalization. If federal rescheduling implementation proceeds, you could see reduced legal uncertainty for companies and faster state-level alignment in the months ahead.
Eyes on rescheduling – federal rollout moves market. Watch MSOSTLRY; compliance risk = trade setup.
Apollo: "The credit story in hyperscalers rests on a single consensus assumption, that operating cash flow triples from $600 billion to $2 trillion, see chart below. If this doesn't happen, then the risk is that the AI trade weakens, with credit spreads widening, capex plans… https://t.co/9dOi0APLQJpic.twitter.com/5JJnxkIfnw
Everything You Wanted to Know About Valuation Models…
* But were afraid to ask
* My preferred valuation model indicates that the Fair Market Value of the S&P Index is approximately 6600 – or about 13% to 14% lower than the 7650 close on Friday (precision is not intended!)
* Valuation models are notoriously poor timing tools but in the long run the market is a weighing machine and not a voting machine
* Every valuation model (absolute and relative) yields the conclusion that stocks are overpriced
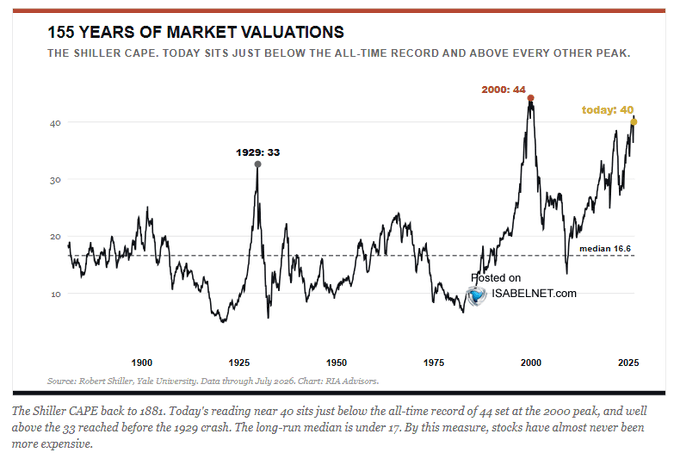
* Specifically, the relative valuation models (price to sales, enterprise value to earnings before interest, taxes, and depreciation, Shiller CAPE, Buffett Ratio, etc. are all the 90 percentile) are hinting that stocks may be even more overpriced than my models
* Equities have ignored an 80-basis point increase in the Ten Year Treasury note yield since the beginning of the year — this is strange as consensus expectations were for one or two federal fund cuts in January compared to the two to three hikes now anticipated for the full year
* If my AI concerns are realized over the next 15 months, there is downside risk to consensus 2027 S&P EPS expectations $410/share) – so my 6600 fair market value may have to be revised lower
“This is Mrs. Bencours, one of my patients. She thinks she’s a sheep. That’s all.”
Most market valuation models drop into two buckets:
* Absolute Valuation Models that calculate intrinsic value based on fundamental cash flows. (The most popular are discounted cash flow and dividend discount models). I use absolute models in my process. The Gordon Growth Model Explained: Stock Valuation Formula and Greenspan (or Fed) models Fed model are examples of absolute models.
* Relative Valuation Models that price a company against its peer group using financial multiples. (The most popular being price to earnings, price to book and enterprise value to EBITDA). I also use relative models in my process, particularly when they are in the extreme – as the series always mean regresses. Shiller’s CAPE model and the Buffett Indicator are examples of relative models.
As an illustration, the extreme in relative valuation models that exists, is vividly represented in the CAPE:
Valuation models are general tools, but not necessarily short-term timing tools to forecast equity prices.
But when in the extreme (as they are now), valuation models warrant attention – as (relating particularly to the relation valuation models (above), in the long run, equities mean regress. Markets, like a pendelum, that overshoot on the upside likely will also likely overshoot on the downside.
That is because there are no new eras, as excesses are never permanent. In every market cycle there will be a hot group of stocks every few years, but speculation fads do not last forever. In fact, over the last 100 years, we have seen speculative bubbles involving various stock groups. Autos, radio, and electricity powered the roaring ’20s. The nifty-fifty powered the bull market in the early ’70s. Biotechs bubble up every 10 years or so and there was the dot-com bubble in the late 90s. “This time it is different” is perhaps the most dangerous phrase in investing.
As Jesse Livermore once wrote:
“A lesson I learned early is that there is nothing new in Wall Street. There can’t be because speculation is as old as the hills. Whatever happens in the stock market today has happened before and will happen again.”
Throughout the last few years I have featured many of the relative valuation models in my Diary, in support of my ursine market view. They have not been good indicators of stock performance since 2023 but in no case in history haven’t these models regressed to the mean.
While I pay I close attention to absolute and relative analyses I am mostly guided by my own model which deals with five different scenarios (ranging from very pessimistic to very optimistic).
In calculating the intrinsic value of the S&P Index I start with attaching a probability to each of five different scenarios (which contain a wide range of outcomes in inflation, interest rates, inflation, economic and profit growth, and I attach valuations to each). I take the valuation implied (hypothetically) of each scenario and multiply by the price/earnings (totaling to 100% probability).
Let’s suppose that the most positive scenario has a probability of 15% and produces a terminal P/E of 30. (We multiply 15% by 30). We do the same calculus for the other four outcomes and total up the valuations and multiply by S&P earnings per share to solve for intrinsic value.
Equities Have Ignored The Rise In 10 Year Yields in 2026
The Ten Year Treasury note started 2026 at approximately 4.20% and is currently 5.00% – an increase of 80 basis points:
Market Yield on U.S. Treasury Securities at 10-Year Constant Maturity, Quoted on an Investment Basis (DGS10) | FRED | St. Louis Fed
The S&P Index started the year with a price/earnings multiple of 22-times (6845 divided by $312/share in 2026 S&P EPS). The current price earnings ratio is 21.2-times (7635 divided by $360/share in 2026 S&P EPS).
Ostensibly, due to the sharp rise in corporate profits (relative to the consensus expectations) over the last 8 1/2 months, investors have generally ignored the rise in U.S. and global bond yields. This is especially surprising considering that we began 2026 with the consensus view that the federal funds rate would be reduced one or two times. Following the recent 25 basis point hike, consensus is now looking for one or two more increases over the balance of the year (for a total of two or three on the year).
The markets have also ignored the models!
The Gordon model indicates that an 80-basis point increase in the risk free rate (Ten-Year Treasury) should lower the S&P’s price earnings ratio by about 5.5points. Standard three stage model indicates a 5 point drop in S&P’s price earnings ratio . The Greenspan of Fed model suggests a four point hit to the S&P’s price/earnings ratio. (All of the above assumes no change in any variables except the change in the 10 year yield). The Equity Risk Premium (which is now an Equity Risk Discount!) indicates similar overvaluation.
Importantly, these (theoretical) price/earnings multiple reductions would yield an even deeper decline in the S&P’s intrinsic value than I have calculated (6,600)!
Bottom Line
I observe, input and consider almost every valuation method extant.
Without exception, every model indicates the S&P Index is overvalued.
However, the most meaningful valuation that I depend upon is my own.
As previously noted, my methodology and calculus attaches a probability distribution to five different outcomes (in inflation, interest rates, economic and profit growth, etc.) in order to project the S&P Index’s intrinsic value.
My scenario and probability analysis produces a fair market or intrinsic value for the S&P Index of 6600, compared to Friday’s close of 7650.
In other words, the market is between 13%-14% overvalued. (Other models suggest an even lower fair market value.)
Should my AI concerns be realized, the consensus 2027 S&P EPS forecast ($410/share) is too optimistic and in jeopardy. In turn, my 6600 fair market value would also be too high.
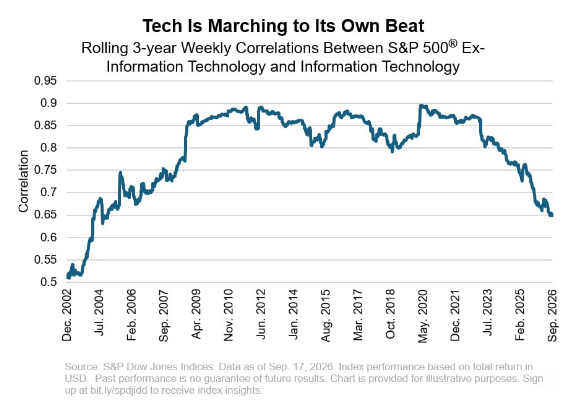
* As previously noted (repeatedly by myself and The Divine Ms M), the market is narrowing —with the Russell not crowing and the equal weighted S&P Index (RSP) rolling over
* Given the narrowing and the valuation model discussion in my upcoming opener, I am planning to expand my short book on the recent rally and strength in the indices
Though S&P futures rose by 21 handles and Nasdaq futures increased by +238 handles on Friday, market breadth continues to have a foul odor as seen by these tweets delivered by Jason Goepfert:
We've never in almost 100 years seen breadth this bad.
The S&P SPY is knocking on new highs but there are (many) more stocks at lows than highs.
The percentage of stocks in long-term uptrends is plunging.
Margin debt is starting to roll over, and that is not really the signal bulls want to see. After climbing into the danger zone, it is now retreating, raising the risk of a broader market pullback 👉 https://t.co/yIk7SZYp6p
“Three thousand years of beautiful tradition, from Moses to Sandy Koufax.”
– Walter Sobchak (played by John Goodman), talking about his Jewish faith in The Big Lebowski
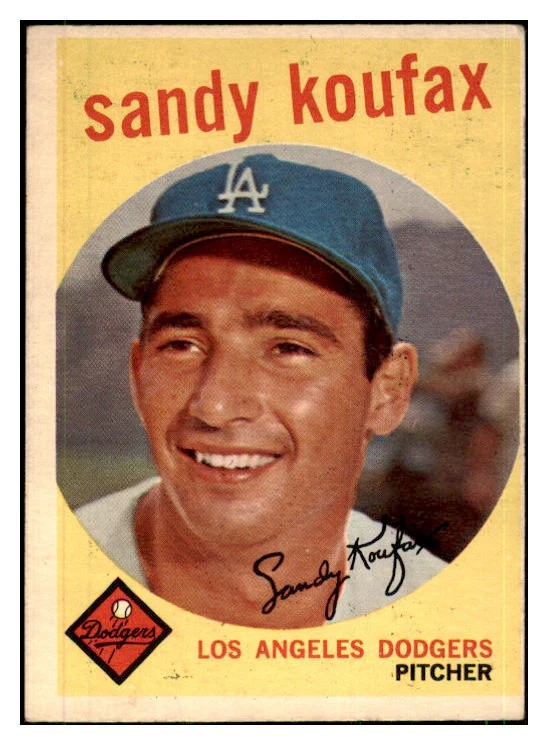
Twelve years ago I wrote A Picture of Imperfection about my cousin, Hall of Fame Los Angeles Dodgers pitcher Sandy Koufax — comparing his pitching perfection 50 years earlier to the imperfect, quant-dominated stock-market mechanism that we face today.
As I wrote:
“In my recent column Season of the Glitch, I remarked that this is not your father’s market — it’s materially influenced by quants and central planners. That makes it a model of imperfection (unlike my cousin Sandy Koufax, who pitched a perfect game 50 years ago today!).”
— Doug’s Daily Diary, A Picture of Imperfection (Sept. 9, 2015)
Sandy’s decision not to pitch on Yom Kippur, the holiest of Jewish holidays, still resonates today.
Don Drysdale pitched instead, but was hit hard and the Dodgers lost.
When the manager Walter Alston came out to the mound to pull him from the game (when behind 7-1 after two and two thirds innings), Drysdale handed him the ball and delivered his famous deadpan line: “I bet right now you wish I was Jewish, too.”
Sandy came back from the Jewish holiday the following day and pitched Game Two, but gave up two runs in six innings as the Twins won 5-1 and took a 2-0 lead in the series.
Drysdale and fellow pitcher Claude Osteen won in the next two games for the Dodgers and tied the series at 2-2, then Sandy pitched a complete-game shutout in Game 5 to give the Dodgers a 3-2 series lead. But then the Twins won Game 6 to force a seventh game.
Sandy started that last game on just two days rest. Pitching through fatigue and severe arthritis, which would eventually end his career, Sandy couldn’t throw his curveball and pitched nearly the entire game relying on fastballs instead.
But Sandy still managed to strike out 10 Twins en route to a three-hit shutout, winning the series for the Dodgers and a second World Series MVP award for himself. He was also named the Sports Illustrated 1965 “Sportsman of the Year.”
Sandy started his pro career in 1955, but didn’t blossom into legendary status until 1961. His stats were as dominant as any pitcher in the majors, but it was his final four seasons (1963-66) that earned his reputation as the modern era’s greatest left-handed pitcher.
He pitched no hitters in each of those four years, and his average seasonal record was 24-7 with a 1.86 ERA. He also averaged 298 innings pitched and 307 strikeouts per season — striking out an amazing 382 batters in 1965.
Sandy’s most remarkable stat of that period was that he averaged 22 complete games per season. And in his last season (1966), his record was 27-9, with a 1.73 ERA, five shutouts, 27 complete games, 323 innings pitched and 317 strikeouts. These statistics are even more amazing when you consider that every pitch Sandy threw that year was made while in terrible pain from a seriously arthritic arm and shoulder.
I suppose there are lessons to be learned from Sandy’s career about perseverance, achieving success and “playing in pain.” Much like investors have struggled this year. But to many, the lesson he delivered by deciding not pitch on Yom Kippur was the greatest one of them all.
I wanted to wish all of my Jewish friends an easy fast — and a G’mar Hatimah Tovah! (“May You Be Sealed for a Good Year in the Book of Life”) to everyone, Jewish or or not!
Apollo: "The credit story in hyperscalers rests on a single consensus assumption, that operating cash flow triples from $600 billion to $2 trillion, see chart below. If this doesn't happen, then the risk is that the AI trade weakens, with credit spreads widening, capex plansShow more
zerohedge
@zerohedge
"Inside The Bottomless Pit": The Definitive Look At The Trillions In Debt Funding The AI Supercycle zerohedge.com/markets/inside…
🇺🇸 Margin Debt
Margin debt is starting to roll over, and that is not really the signal bulls want to see. After climbing into the danger zone, it is now retreating, raising the risk of a broader market pullback
👉 isabelnet.com/?s=S%26P+500
h/t @Callum_Thomas$spx#spx
We've never in almost 100 years seen breadth this bad.
The S&P $SPY is knocking on new highs but there are (many) more stocks at lows than highs.
The percentage of stocks in long-term uptrends is plunging.
The only remotely similar setups were January 1973 and November 1999.
Even broadening the parameters so we can get more signals doesn't improve the outlook much.
Out of 83 dates with similar or better participation, the S&P rallied over the next year only 16% of the time.