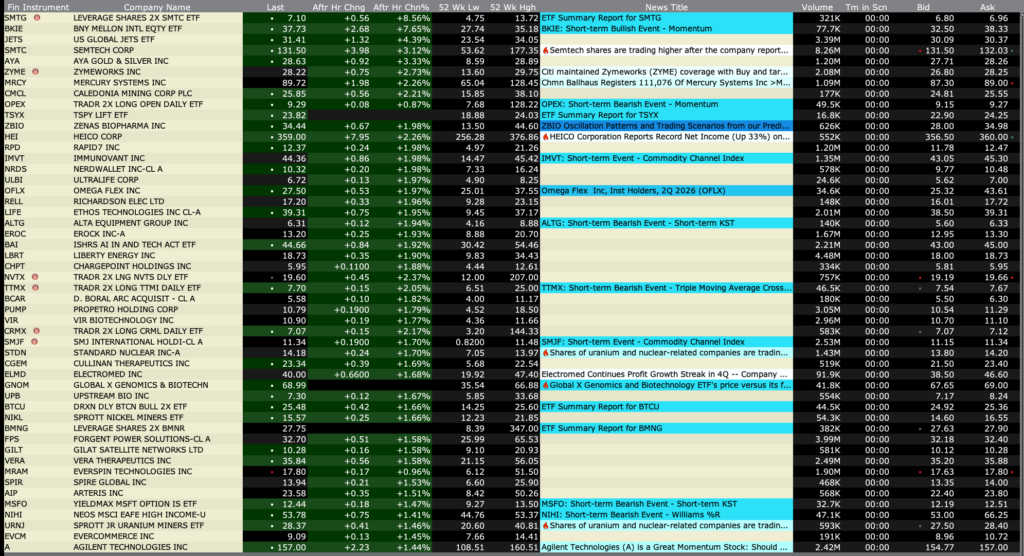
Tuesday’s After-Hours Advancers and Deciners
After-Hours % Advancers
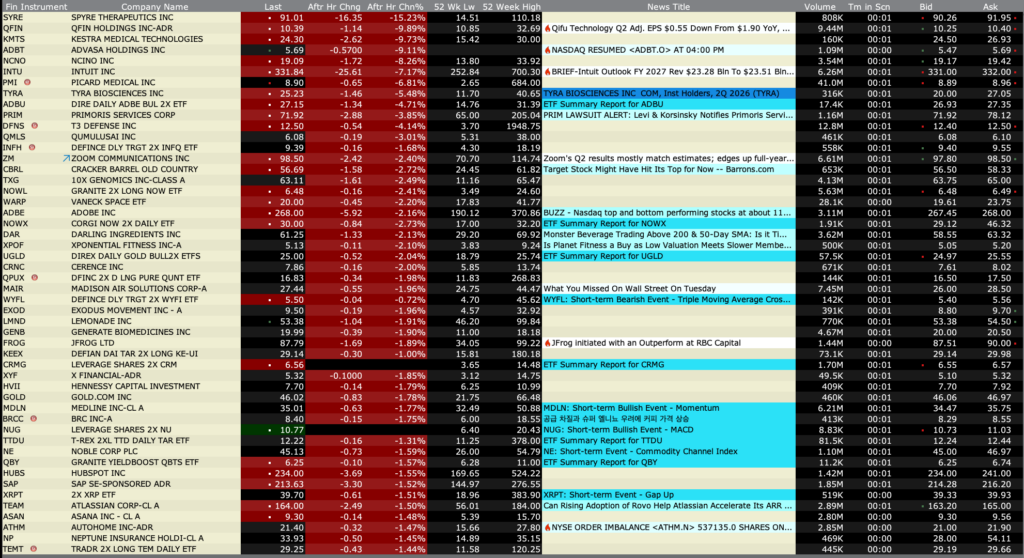
After-Hours % Decliners
Position: None
BY Doug Kass · Aug 25, 2026, 4:45 PM EDT
 Doug KassDoug Kass
After-Hours % Advancers
After-Hours % Decliners
Position: None
BY Doug Kass · Aug 25, 2026, 4:45 PM EDT
Closing Volume
– NYSE volume 21% below its one-month average
– NASDAQ volume 12% below its one-month average
– VIX index: down 2.52% to 15.45
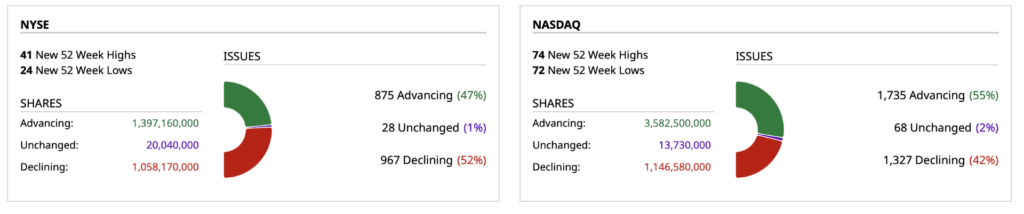
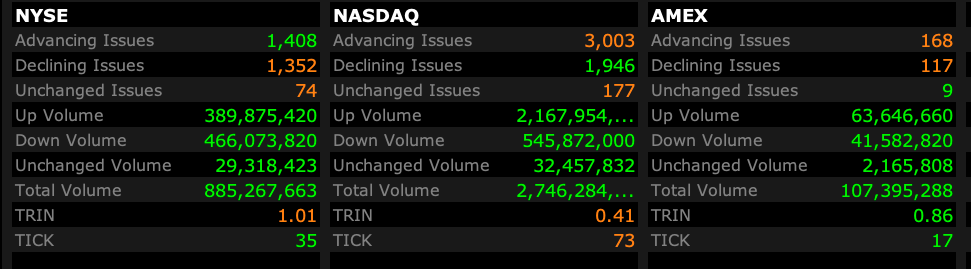
Breadth
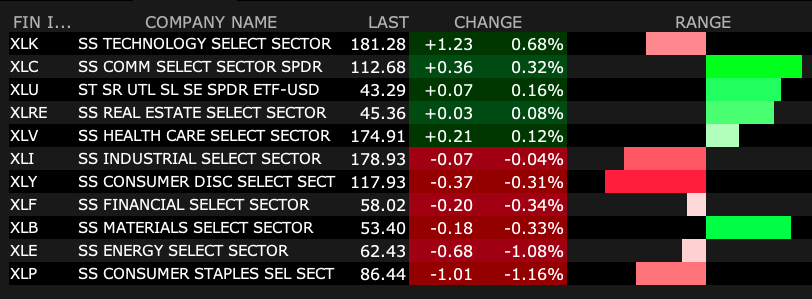
S&P 500 Sectors
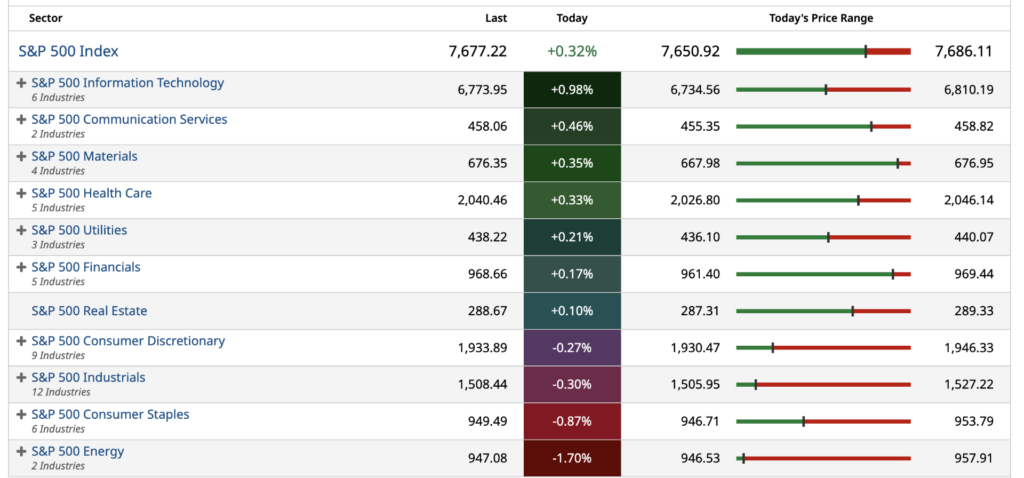
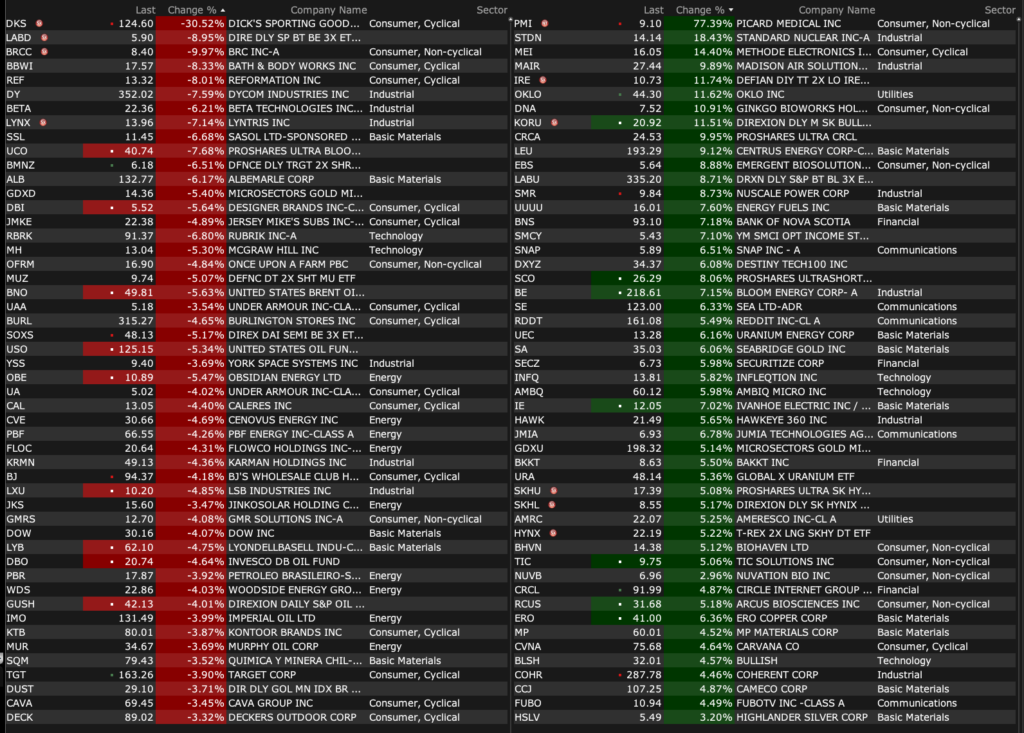
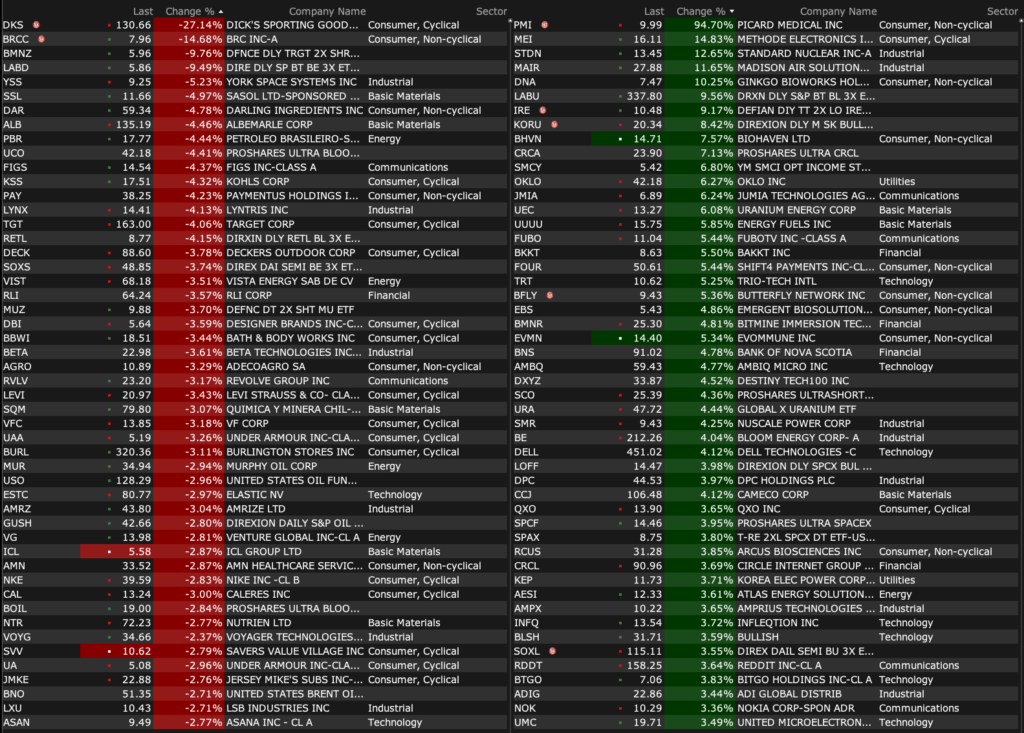
% Movers
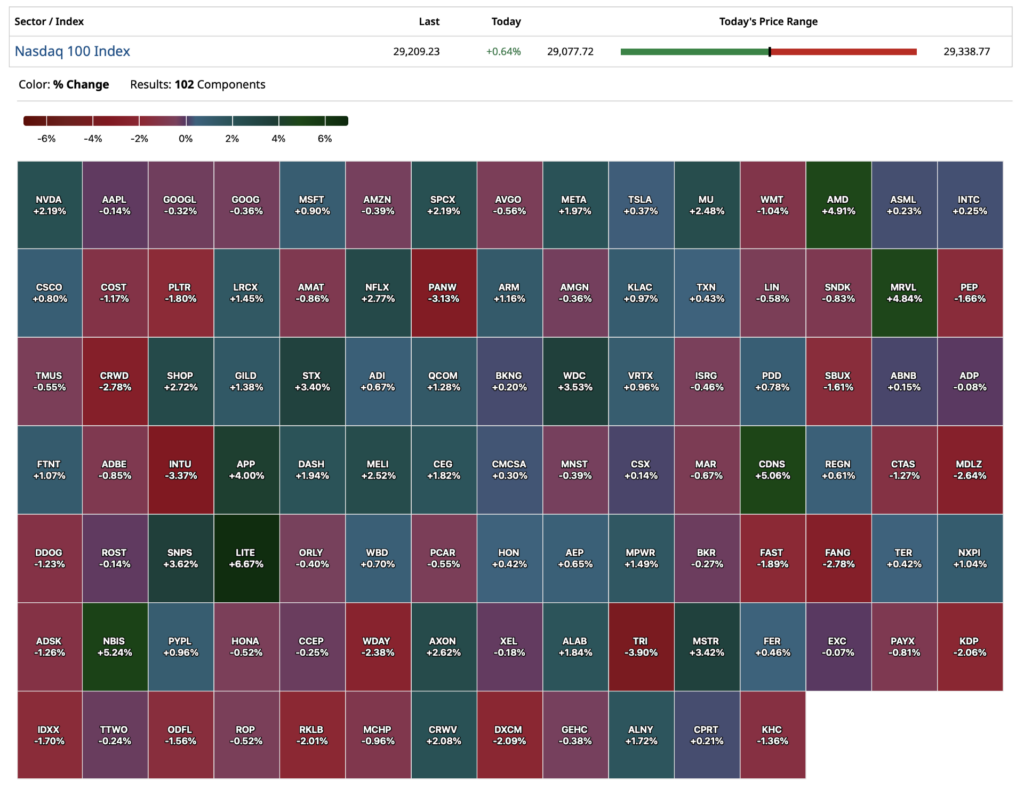
Nasdaq 100 Heat Map
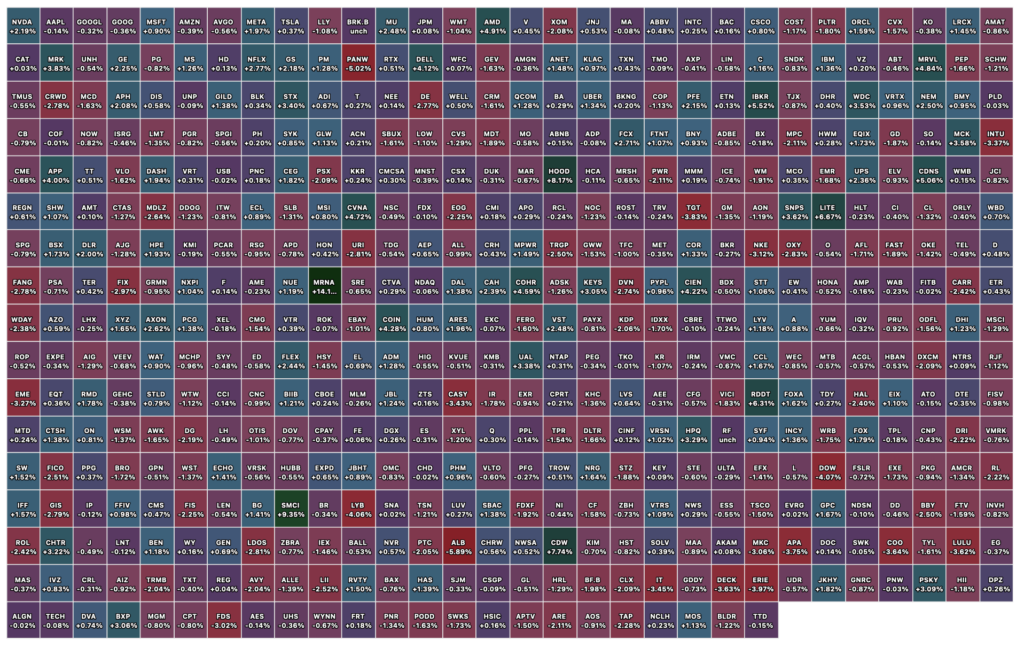
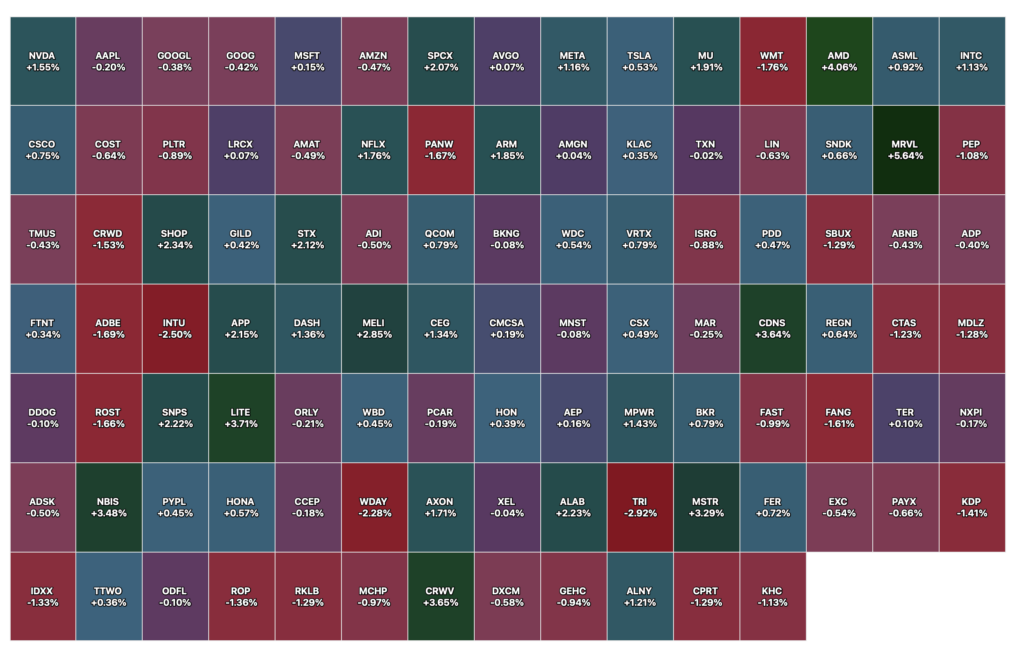
Closing S&P 500 Heat Map
Position: None
BY Doug Kass · Aug 25, 2026, 4:27 PM EDT
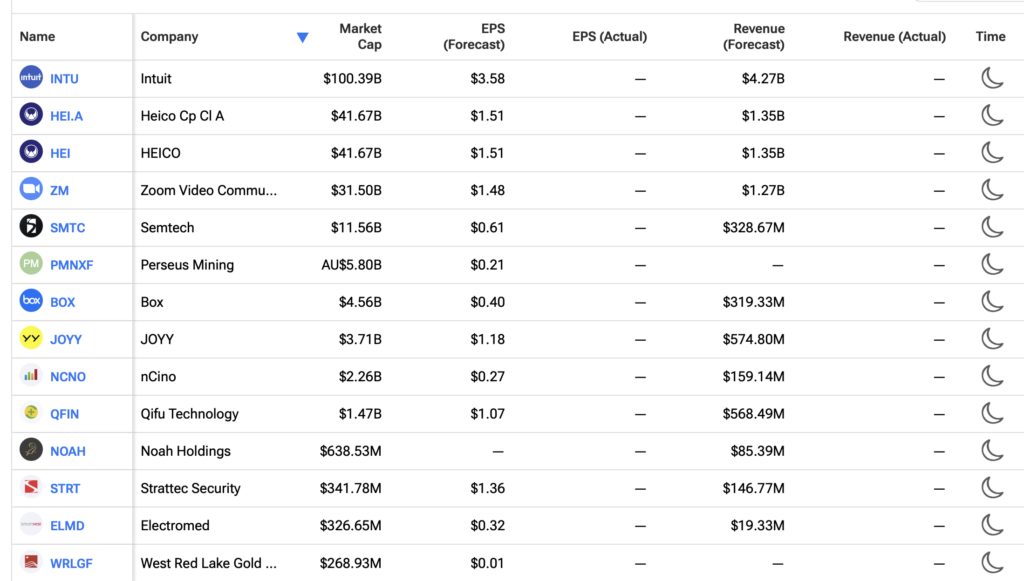
After the Close 08-25-2026
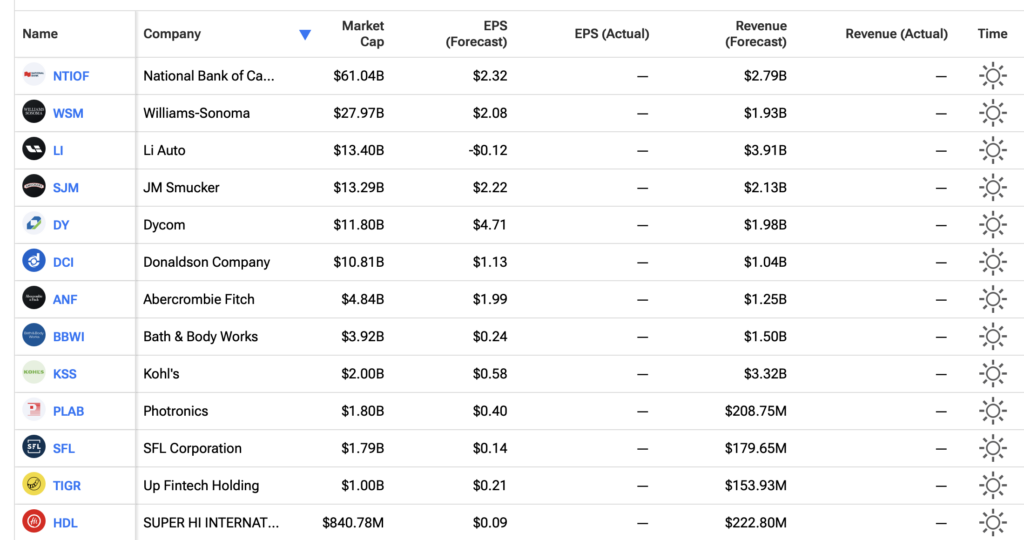
Before the Open 08-26-2026
Position: None
BY Doug Kass · Aug 25, 2026, 4:13 PM EDT
From Peter Boockvar:
The August Philly non-manufacturing index flipped back to negative territory at -10.6 vs +7.4 in July. It’s been below zero for 21 of the last 22 months. As the national figure has been consistently positive, I can’t explain the particular weakness in this region relative to the rest of the country. The Beige Book on the Philly region said this a few weeks ago on two key areas of services, “Retailers, both auto and nonauto, reported mostly steady sales. Tourism, which was boosted by mega events in the region, rose moderately.”
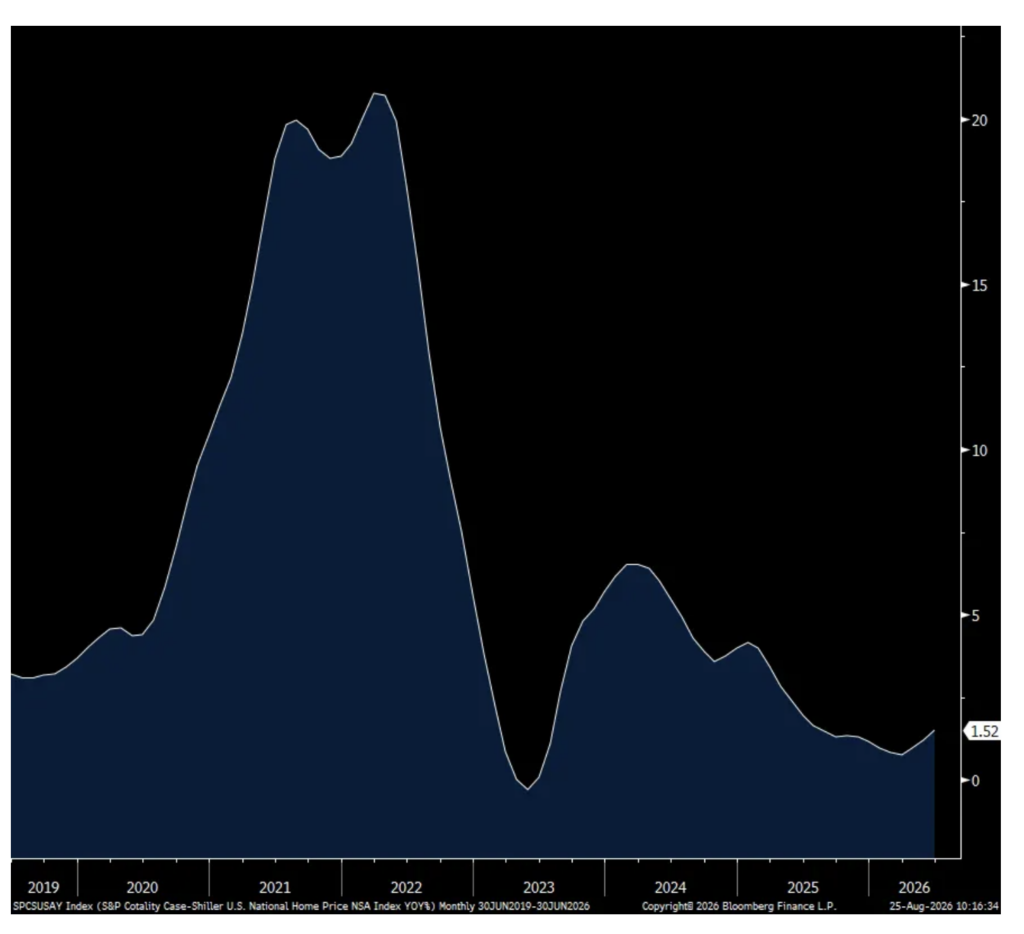
The June (thus somewhat dated) S&P Cotality national home price index showed a 1.5% y/o/y price gain after a 1.2% rise in May. The strongest markets are those with the most limited inventory like Chicago, New York, Cleveland, San Francisco, and Boston. Prices fell in Las Vegas, Seattle, Denver, Tampa, Phoenix, Dallas and Portland. Thus, of the top 20 cities where these mentioned are included, the price situation is pretty bifurcated.
Bottom line, while those who own a home don’t want to see a decline in home prices, I think it is needed in order to improve the affordability picture more dramatically for first time buyers that can in turn trigger more transactions. Also of course a continued rise in wages that quicken faster than the rise in prices can help with affordability. As for relying on lower mortgage rates, I unfortunately don’t expect it.
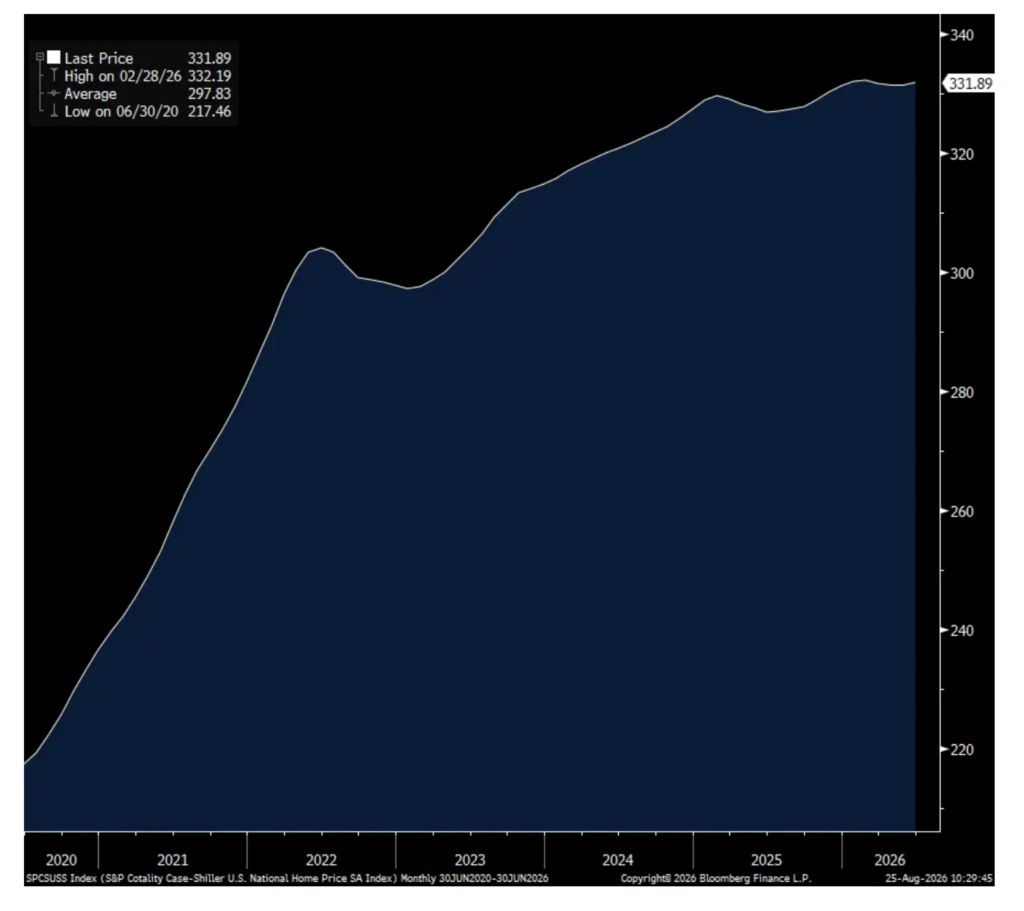
Fyi, this index is now up 53% over the past six years, thus capturing all the monetary easing during Covid and the tightened that followed.
Also out was the July new home sales figure which totaled 607k annualized, 13k less than expected but June was revised up by 50k to 678k. Smoothing out this volatile data set puts the 3 month average at 638k vs the 6 month average of 641k and which compares with the 12 month average of 664k. For perspective, the average in 2019 when mortgage rates were much lower was 685k but with a US population that was about 17 million person smaller.
S&P Home Price Index y/o/y
S&P Home Price Index
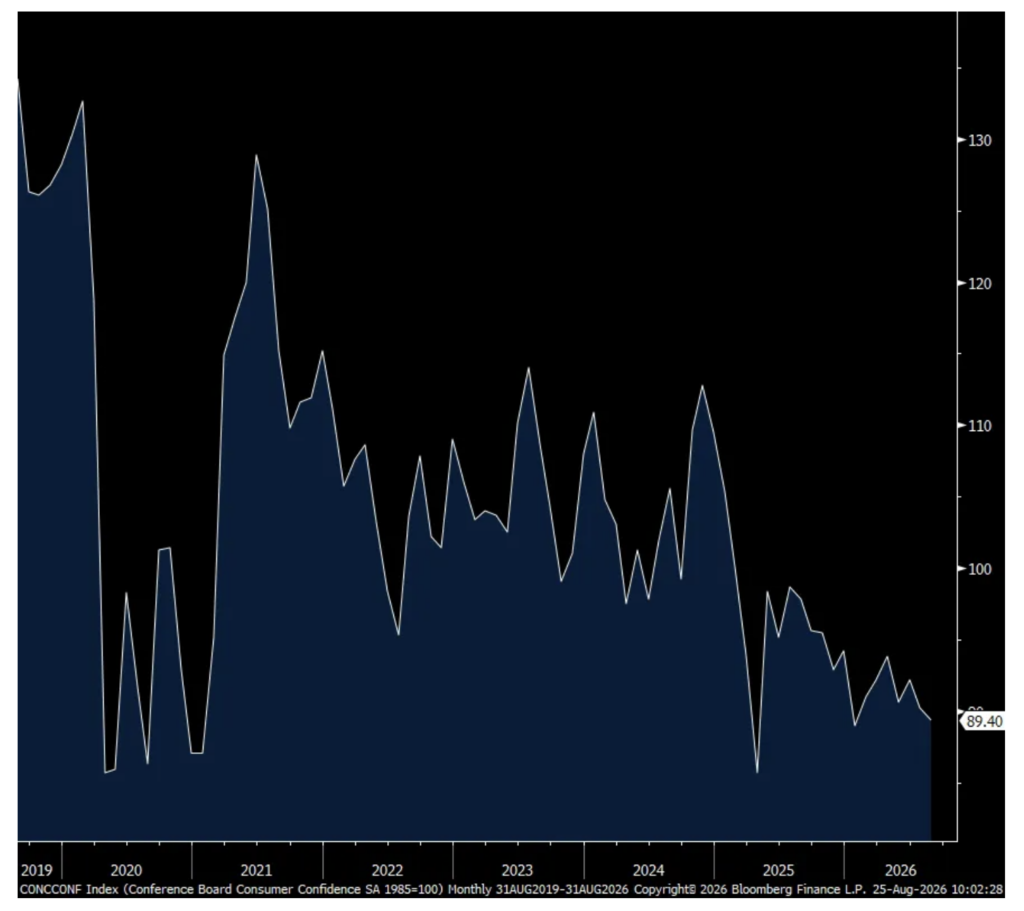
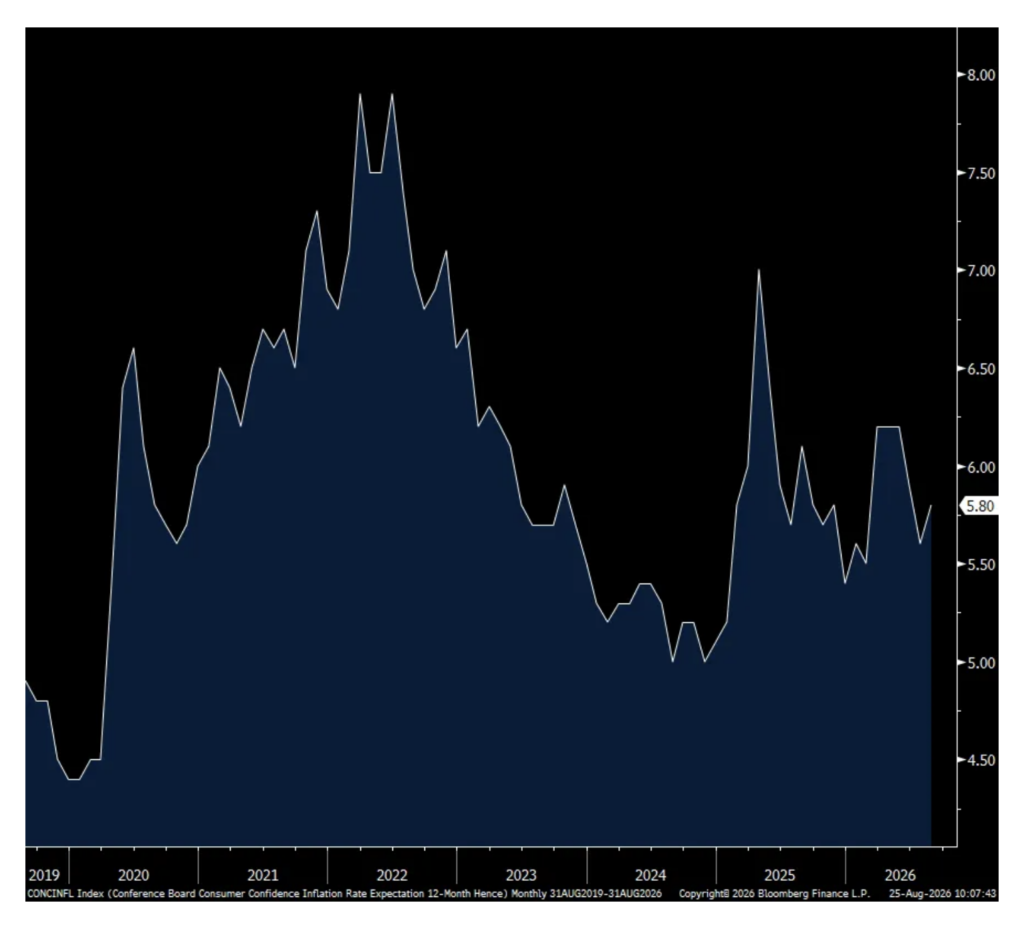
The Conference Board’s Consumer Confidence index slipped to 89.4 from 90.2 and less than one point below expectations. For perspective, the year-to-date average in this index is 91. The internals were very mixed as the Present Situation rose about 7 pts while Expectations fell by about 6 pts. One year inflation expectations rose to 5.8% from 5.6% in July and vs 5.9% in June.
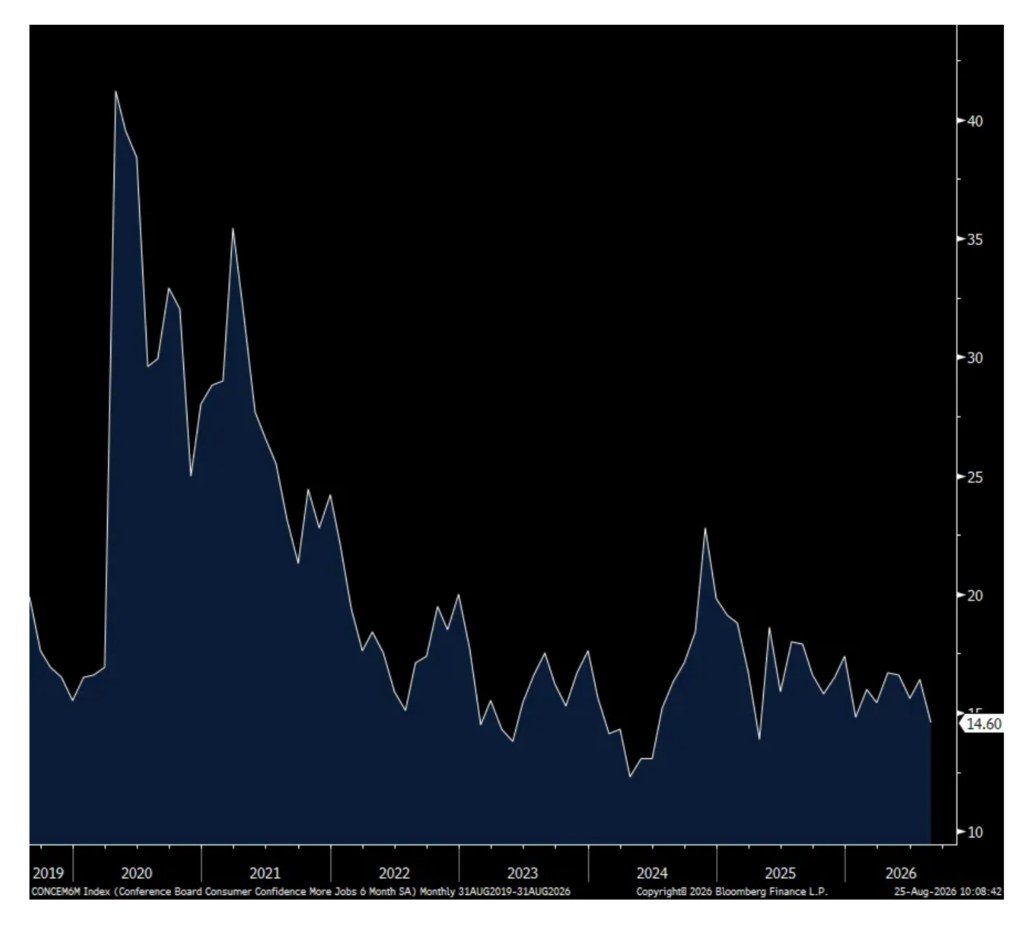
Positively, the answers to the labor market questions improved and was the main factor in the 7 pt rise in ‘Present Situation.’ Jobs were Plentiful rose and those Hard to Get fell, both to levels seen 5 months ago. The optimism though is short term as those expecting ‘More Jobs’ in the coming six months fell 1.8 pts to the lowest since April 2025.
Spending intentions for both autos and homes declined m/o/m and for major appliances too. On the service side, “restaurants/bars/take-out, utilities, and streaming/internet/mobile services, ranked among the top three spending targets, while planned spending on beauty and personal care fell.”
The Conference Board said, “Consumers’ write-in responses on factors affecting the economy were slightly more pessimistic in August. References to prices in general—and oil and gas specifically—remain elevated. Comments about war/conflict, food/groceries, trade, and jobs rose in August.” Not surprisingly.
Demographically, “On a six-month moving average basis, confidence across all age groups trended down slightly, remaining highest among consumers under 35. By income, confidence was mixed, but generally higher-income groups were more optimistic. By generation, confidence for Gen Z remained the highest, followed closely by Millennials on a six-month moving average basis. The three oldest generations—Generation X, Baby Boomer, and Silent Generation—trailed in confidence by a wider margin.” And, “Beyond the top three, consumers anticipated spending less on many activities within the next six months, such as movies, hotels for personal travel, airfare, amusement parks, and museums and historical sites, although spending plans for pet care remained strong.” Our pets are family, right?
Bottom line, overall consumer confidence remains depressed but we know the internals are hugely bifurcated and that inflation remains the biggest economic pain point for many lower to middle income consumers in particular.
Consumer Confidence
One yr Inflation Expectations
Expecting More Jobs in Coming 6 Months
Finally with this data dump, the August Richmond manufacturing index was little changed but stayed above zero at +4 vs +5 in July. This follows positive prints in the NY and Philly regions and adds to the manufacturing recovery theme after 3 tough years.
Position: None
BY Doug Kass · Aug 25, 2026, 3:00 PM EDT
BY Doug Kass · Aug 25, 2026, 2:45 PM EDT
Positions: None.
BY Doug Kass · Aug 25, 2026, 2:30 PM EDT
Positions: None.
BY Doug Kass · Aug 25, 2026, 1:30 PM EDT
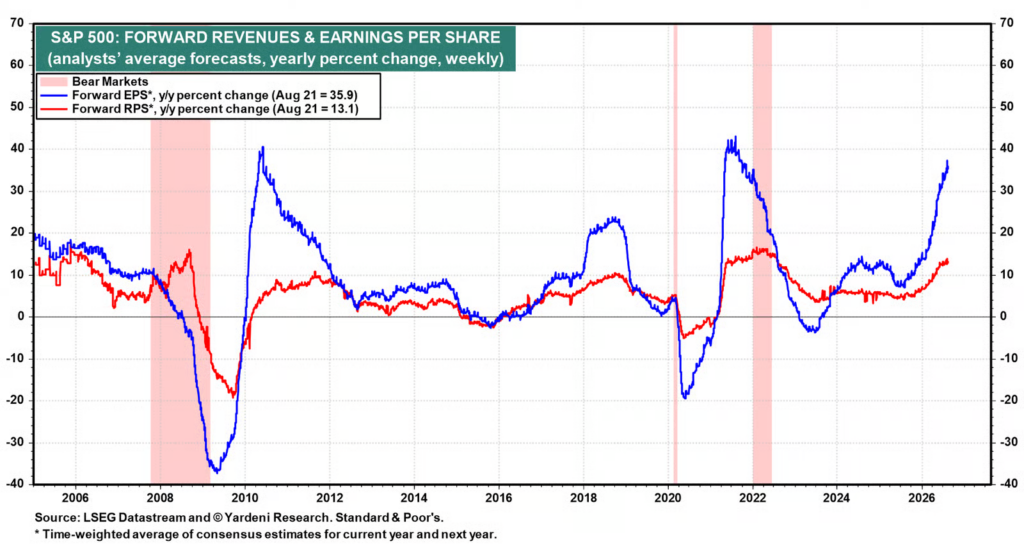
Apropos to my opening missive, the spread sure looks unsustainable to me:
EPS vs. RPS growth. “That gap reflects widening profit margins. A margin gap this wide has appeared in the past only after recessions and bear markets. This pattern shows up early in bull markets rather than late. This time, the difference is that the margin expansion is not the usual cyclical bounce off a trough.”
Position: None
BY Doug Kass · Aug 25, 2026, 12:30 PM EDT
I’m buying Carvana (CVNA) puts for September and October.
Position: Short SPY common (VS), puts (S)
BY Doug Kass · Aug 25, 2026, 11:50 AM EDT
Here are today’s things:
* I added to my SPY short at $767.18.
* I added to ETF shorts GRNY at $27.89 and JOET at $46.10.
* I shorted JPM at $353.71.
* I shorted more CRWV at $89.06 and NVDA at $212.04.
Position: Short SPY (VS), GRNY (M), JOET (S), JPM (VS), CRWV (VS), NVDA (S)
BY Doug Kass · Aug 25, 2026, 11:33 AM EDT
– NYSE volume 24% below its one-month average;
– Nasdaq volume 13% below its one-month average;
– VIX index: down 0.06% to 15.84
BY Doug Kass · Aug 25, 2026, 11:03 AM EDT
Position: None.
BY Doug Kass · Aug 25, 2026, 10:30 AM EDT
The investment mosaic is far more complicated than suggested by hosts, investment strategists, panelists and guests in the business media.
Specifically, many distill the bullish argument to this: Since 2026 S&P EPS is expected to be about +20% (well above consensus expectations at the beginning of the year), the S&P price gains in 2026 should be about in line with that profit growth (or better). Candidly, that sort of distillation is the essence of “first-level thinking.”
First-level thinking is lazy, simplistic and superficial — it looks for simple formulas and easy answers. To paraphrase Howard Marks:
Most recent examples of when S&P EPS was better than expected and strong were in 2018 (+20.5% EPS growth, -6.6% decline in the S&P), 2006 (+16.7% EPS growth, +11.3% rise in the S&P), 2005 (+19.3% EPS growth, +8.8% rise in the S&P) and 2004 (+20.1% EPS growth, +4.2% rise in the S&P).
Going back, during the last 50 years — other 12-month periods with robust EPS growth and less-than-stellar to down S&P price include the years 1993, 1992, 1987, 1984, 1979 and others.
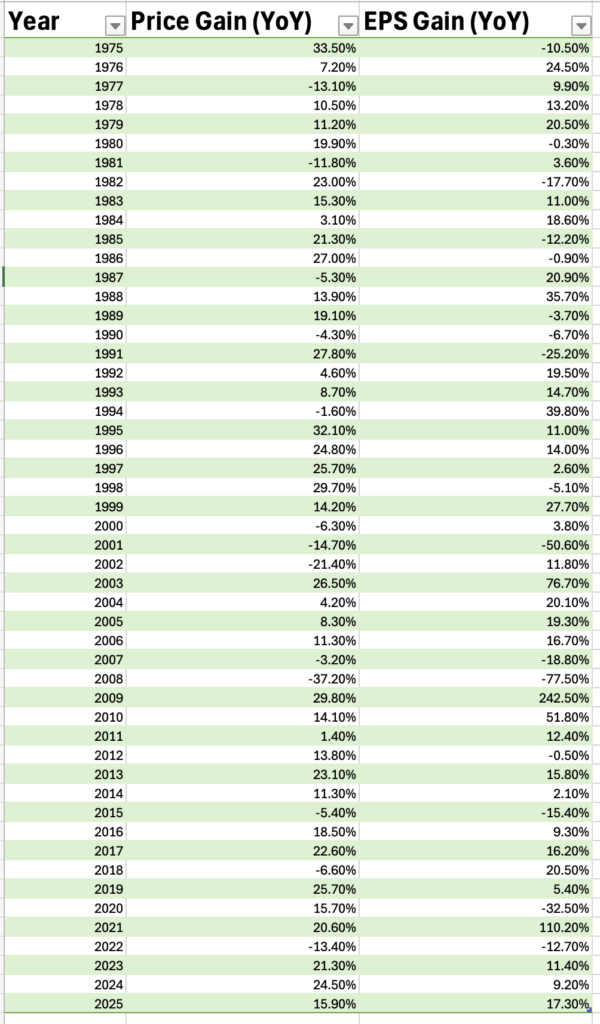
Furthermore, I would argue that the backdrop of 2026-2027 offers unique market challenges relative to prior periods since 1975 (“it’s different this time”):
* High and rising inflation and interest rates.
* A burgeoning deficit and U.S. debtload may be a permanent condition giving the general lack of discipline from both parties in Washington DC.
* Improvisational geopolitical and fiscal policies that present threats to political and economic stability.
* Both parties are moving to extremes — the Republican party more to the right and the Democratic party to the left. With a possible Democratic congressional majority win in November, anti-corporate policy (higher corporate taxes, etc.) may be in the offing.
* Traditional valuation metrics in the 98%-tile and two standard deviations above the average.
* The AI capital spending spree and gains from investments have inflated S&P profit reports — as noted in my “More Tales From Nvidia” series an earnings reckoning may lie in the not too distant future.
Looking at any one variable (e.g. S&P EPS growth) to forecast S&P price is fatuous, simplistic, lazy and is contradicted by past investment returns data.
Stated simply, the correlation between S&P EPS growth and S&P price gains is a crutch and is not a reliable indicator.
The investment mosaic is far more complex than many present in the business media.
Position: Short SPY (VS)
BY Doug Kass · Aug 25, 2026, 9:35 AM EDT
From Peter Boockvar:
‘Wow’ was my reaction to reading Stan Druckenmiller’s opinion piece in the WSJ titled “Let the Bond Market Speak”, not in terms of the content as I agreed with everything he said but in the high profile, critical way he presented it. After all, he and Scott Bessent worked together for years. The piece also tells me again that Kevin Warsh is not on board either with the Treasury attempt to manipulate the long end of the yield curve. I say ‘again’ because Warsh himself has basically told us that he both wants the market to have more of a say in setting the cost of capital and he because we know he wants to shrink the size of the balance sheet and the Fed’s footprint in the market. And we know Warsh sat by the side of Druckenmiller for years prior to the new Fed Chair seat came available.
Here were some of the notable quotes from it in case you didn’t read it yet:
To the market’s immediate reaction with yields initially down and then right back up, “The market’s verdict was swift and correct: This wasn’t liquidity management, it was price management – and a mistake far larger than $4 billion suggests.”
“Treasury’s announcement gave the game away. It justified the larger operations as liquidity support in sectors with ‘consistent strong sponsorship from market participants,’ but strong sponsorship is the definition of a healthy, working market. There were no failed auctions, no dealer balance-sheet seizure, no forced unwinds, nothing resembling Treasurys in March 2020 or U.K. gilts in September 2022, the sort of genuine dysfunctional episodes that justify official action. Volatility was contained, and trading was orderly—not a malfunction but the machine doing its job.”
Believing that the long end wasn’t even fully pricing in where it should have been anyway, and that yields were actually “accommodative, not restrictive, of financial conditions” he said “The bond market wasn’t being a vigilante, as some would argue. It was being a pushover that had finally begun to clear its throat, and Treasury moved to quiet even that.”
Also this, “I have spent five decades trading on a simple premise: Markets aggregate information no committee possesses, and prices are how that information reaches decision makers. The long-term Treasury yield is the most important price in the world. It is also the only fiscal disciplinarian the U.S. has left.”
And the disease that is at the core of the problem, “Neither party will run on entitlement reform. Both have spent the past decade expanding commitments while ignoring arithmetic. Democracies don’t repair their finances because a budget office publishes a table. They repair them only when the cost of inaction becomes visible and immediate, when mortgage rates bite, when auctions tail, when the political price of a rising long bond finally exceeds the political price of touching spending.”
And to the real pushback against what Bessent did, “Every basis point of artificial yield suppression is a subsidy to procrastination. Suppressed long rates sugarcoat the interest-cost projections, shrink the apparent urgency, and let incumbents assure voters the debt is someone else’s problem. If Congress and the administration are unlikely to touch entitlements even with the market’s signal, they are certain not to touch them without one. Whatever this operation saves in basis points, it will cost multiples in delay.”
And to the timing of the operation, “Debt management that even appears to follow the political calendar spends the one asset that took two centuries to accumulate: the credibility of the Treasury market. That asset doesn’t regain its value so easily…Routine operations aren’t announced off-cycle, at double size, on the heels of the long bond’s hitting a two-decade high, with a signal that they can grow without limit. Judge an intervention by what it responds to. This one responded to a price, not to plumbing, which is exactly how the market read it, and why the effect evaporated within a day. You can’t buy your way out of a solvency conversation with liquidity tools. You can only postpone the conversation and raise the eventual price.”
Stan Druckenmiller’s bottom line, “Governments defending prices against fundamentals always lose. The only variable is how much they spend before conceding. The U.S. shouldn’t put itself on the wrong side of that trade, not with the most important price in the world, and not when that price is trying to say the one thing Washington most needs to hear: Let the bond market speak.”
https://www.wsj.com/opinion/let-the-bond-market-speak-81529d74
As I said, I agree with everything said here by Druckenmiller. I also argued last week that even if Bessent wanted to continue on this path, he picked a fight with a market that is much bigger than him and I’ll add that he’s not just pushing back against the US Treasury market but the JGB market too because we’ve seen over the past few years that what happens in the JGB market doesn’t stay in the JGB market.
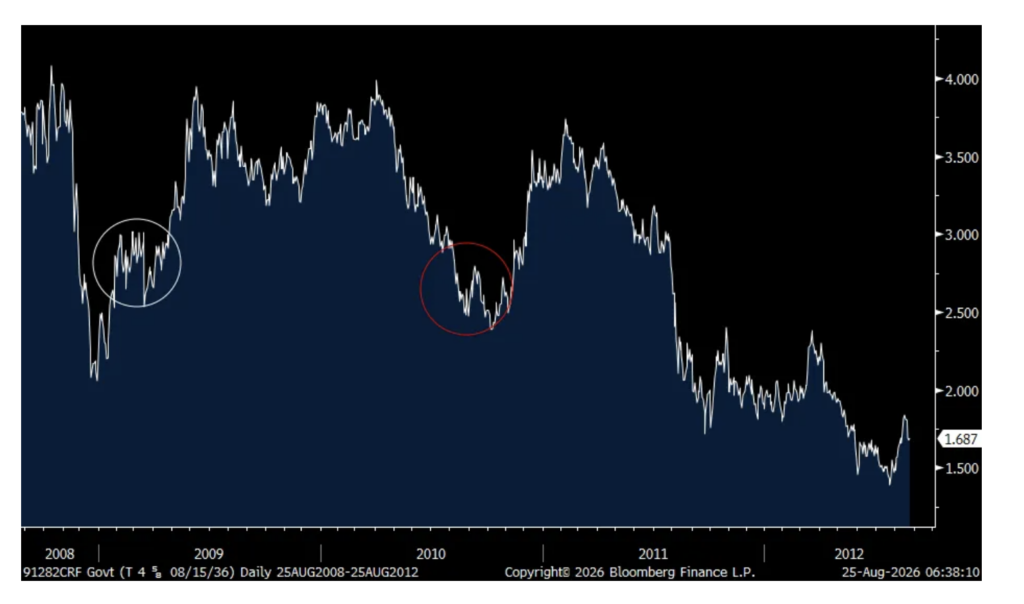
I also want to highlight this, the experience of the Federal Reserve that has the true printing press and is never limited to raising money on one hand, to finance the purchases with the other. That printing capability when turned on we know too as QE. In March 2009 the Fed began with QE1 to further suppress long term interest rates after short rates were already at zero. They also engaged in the purchases of MBS as part of this. $300 billion of US Treasuries were bought (on top of $1.45 trillion of MBS and agency debt). What did long rates do in response, they went up instead of down.
QE2 was hinted at by Bernanke in August 2010 and after long term rates initially went down in response, when the purchases of $600 billion at $75 billion per month actually began that November and lasted until June 2011, long term rates again went up instead of down. It’s no coincidence that QE3 was called ‘QE Infinity’ rather than the Fed telling us what the end dates were for QE1 and QE2 which the market targeted.
Why did rates rise, against what the Fed wanted? Because the market priced in the believed reflationary nature of the operation.
Point is, just because a public official wants to push a price in a certain direction, the market will push back if they don’t believe the fundamentals support the move.
In the chart below, the white circle is around the time QE1 began and in red is around the August 2010 Bernanke QE2 speech.
Moving on.
Making anything that feeds into the building of a data center we know is a hot and needed product. Anyone producing it is doing well, company wise and country wise (think South Korea, Taiwan). Hong Kong too by the way as its July exports skyrocketed by 51% y/o/y and imports were higher by 41% driven by AI related products. Part of this though was easy comps too as last summer was still dealing with the aftermath of on and off tariffs sprayed around the world.
In Germany, the August IFO business confidence index was 88.8, up from 86.7 in the month before with both Expectations and the Current Assessment higher. IFO said succinctly and positively, “Despite another rise in energy prices, the Germany economy is recovering.”
Evidence that the manufacturing lift is global, “In manufacturing, the index rose noticeably.” Also, “In the service sector, the business climate improved” but, “While IT service providers were more confident about their future development, the situation in the transportation and logistics sector remains difficult.” The trade and construction components also rose.
Nothing market moving but the DAX is up .9%, bund yields are lower as is the euro after the recent bounce.
Positions: None.
BY Doug Kass · Aug 25, 2026, 9:20 AM EDT
-KURA +12% (insider buys)
-RZLV +10% (selected by Google Cloud for blockchain data infrastructure)
-MAIR +7.0% (sells 90.1M Class A shares in $2.3B private placement at $24.97/shr)
-NVTS +6.0% (agrees to acquire AI data center power management company Claros for up to $232.8M in cash and stock deal)
-CAPR +5.6% (Oppenheimer Raised CAPR to Outperform from Perform, price target: $54)
-BE +5.1% (momentum)
-FOUR +4.1% (Wells Fargo Raised FOUR to Overweight from Equal Weight, price target: $59 from $55)
-VRT +3.2% (momentum)
-AMD +3.1% (Raymond James Raised AMD to Strong Buy from Outperform, price target: $641)
-DT +2.8% (Morgan Stanley Raised DT to Overweight from Equal Weight, price target: $65 from $58)
-CRWV +2.6% (signs collaboration with Rescale to add CoreWeave Cloud capacity to Rescale’s ecosystem for AI and simulation workloads)
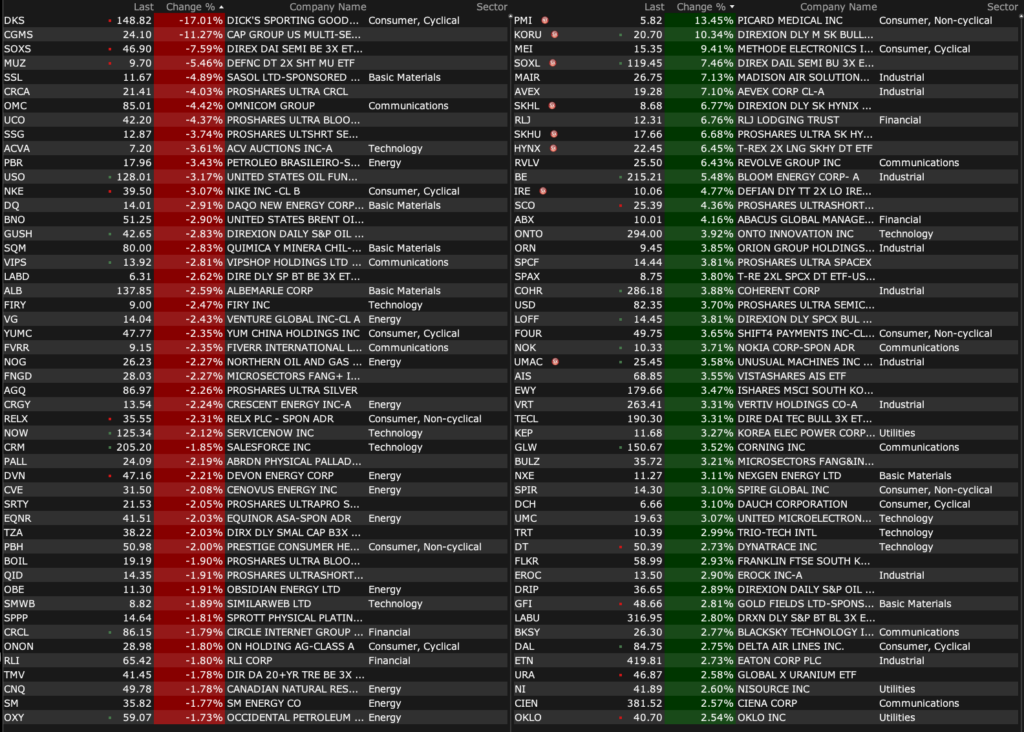
-DKS -18% (earnings, guidance)
-GRRR -9.5% (earnings, guidance)
-NKE -3.1% (lower in sympathy with DKS, Foot Locker business)
-VIPS -2.9% (earnings, guidance)
-NTR -2.0% (National Bank Cuts NTR to Sector Perform from Outperform, price target: $77)
BY Doug Kass · Aug 25, 2026, 9:06 AM EDT
BY Doug Kass · Aug 25, 2026, 8:55 AM EDT
BY Doug Kass · Aug 25, 2026, 8:39 AM EDT
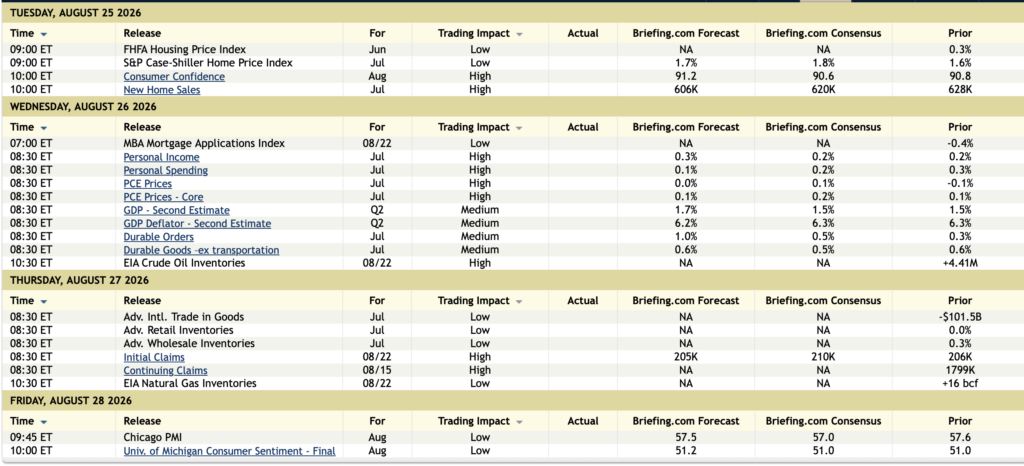
11:00 a.m.: Treasury Announces a 4, 8 and 17 Week Bill Auction;
11:30 a.m.: Treasury hosts a $95B 6-Week Bill Auction;
1:00 p.m.: Treasury hosts a $69B 2-Year Note Auction;
2:00 p.m.: Treasury buyback (liq support)
8:00 a.m.: Fed Bank of Richmond President Barkin (Non-Voter) delivers most recent speech, “The Mysterious U.S. Economy” before the Montgomery County Chamber of Commerce “Eggs & Issues” event, in Blacksburg, VA;
4:00 p.m.: Fed Bank of Richmond President Barkin (Non-Voter) repeats speech, “The Mysterious U.S. Economy” before the Charlotte Regional Business Alliance, Charlotte, NC
BY Doug Kass · Aug 25, 2026, 8:23 AM EDT
BY Doug Kass · Aug 25, 2026, 7:55 AM EDT
8 Sharp Bear Cases You Must Read Today – by Quoth the Raven
Position: None
BY Doug Kass · Aug 25, 2026, 7:25 AM EDT
From late yesterday afternoon:
“If trees could scream, would we be so cavalier about cutting them down? We might, if they screamed all the time, for no good reason.”
– Jack Handey
I thought quite a lot about the markets over the weekend and I revisited my mid-August column “But If, Baby, I’m The Bottom… You’re The Top!“
I concluded then and I believe stronger now, in light of the events of the last two weeks (in AI, market structure, valuation, geopolitical, interest rates, inflation, deficit/debtload, etc.) the following:
* Upside reward is dwarfed by downside risk.
* Having an outsized or even an in-line long exposure entails not only a great deal of risk — but is literally gambling (due to the risks of an uber leveraged market structure — in products and strategies).
* In general, market participants are unduly optimistic and positioned very long with limited cash reserves (as a percentage of the portfolio).
* The singular notion that since S&P EPS growth will be robust this year (+20%) so equities are undervalued is challenged by the reality of history (I didn’t get to it today but will tomorrow!).
Position: None
BY Doug Kass · Aug 25, 2026, 6:30 AM EDT
I will be travelling to another funeral service early this afternoon.
I will return on Thursday morning.
Position: None
BY Doug Kass · Aug 25, 2026, 6:15 AM EDT
Position: None
BY Doug Kass · Aug 25, 2026, 6:05 AM EDT
“The long-term Treasury yield is the most important price in the world. It is also the only fiscal disciplinarian the U.S. has left. Every basis point of artificial yield suppression is a subsidy to procrastination…If the 30-year must trade at 5.5% to clear, that isnt a crisis. It is an invoice. Then do the only thing that durably lowers long-term yields: address the primary deficit.”
– Stanley Druckenmiller
Position: None
BY Doug Kass · Aug 25, 2026, 5:55 AM EDT
The S&P Short Range Oscillator is slightly overbought at 0.20% vs. -0.29%.
Position: Short SPY (VS)
BY Doug Kass · Aug 25, 2026, 5:45 AM EDT
Historically, elevated consensus long-term earnings growth rates have been a contrarian indicator. Source: @BudaghyanArthur, BCA Research, “Charts That Matter: Zoom Out. Watch The Extremes” (July 2026)

Stanley Druckenmiller renders an unfavorable opinion of Treasury Secretary Scott Bessent's use of buybacks to defend against higher yields in a market that is functioning normally. "I have spent five decades trading on a simple premise: Markets aggregate information no committee Show more
"The CNBC Panelists Said What" (issue #13) This morning, Dicks Sporting Goods $DKS is -19% (or -$35) on disappointing results and guidance. $DKS $244 to $148 over the last two months August 24 $DKS $179 (now $146) Yesterday(!) the stock was strongly endorsed by the Show more

"The CNBC Panelists Said What" (issue #12) I have highlighted Halftime's Jim Lebenthal's previous recommendations of $ADBE and $ORCL. With $MU
So looks like the reports of the strengthening consumer over the summer were likely exagerated. $DKS

Asking the head of ai investment at jpmorgan about the possible risks associated with returns on the capital spending spree is like asking dan ives @divestech whether he likes $nvda. I am hearing alot of "buzz words" and certainty from the guest but little else. Its just not Show more
Monday evening Drukenmiller warns. After JPM warned Friday. And Citadel this morning. As if an orchestrated effort to prepare for the inevitability of Bessent’s coming fiscal/monetary intervention. 🤨 “CITADEL WARNS BESSENT’S BUYBACKS COULD BACKFIRE Citadel Securities calls Show more

This Is The “Bessent Put” That Isn’t youtu.be/flKRZzzszcY