Will ResMed Wake Up or Fall Into a Deeper Slumber?
Shares of the medical device maker plunged after a drug showed promise for sleep apnea.
You've reached your free article limit
You've read 0 of 1 free Pro articles.
Medical-device maker ResMed RMD slumped after Lilly’s LLY Zepbound trial shows benefits for sleep apnea.
The last time I looked at RMD was back on January 29 where I wrote that "RMD has made a good run to the upside but a pause or pullback looks likely at this point in time."
Let's check out the charts and indicators.
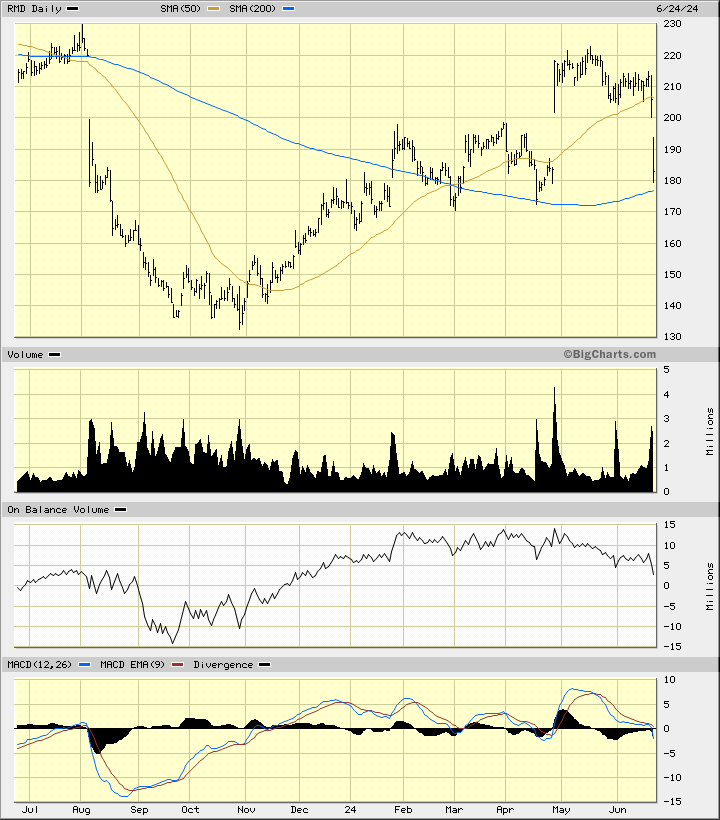
In the daily bar chart of RMD, below, I can see that the shares moved sideways for three months after our last review. RMD gapped higher from late April into May and then weakened in June and gapped lower today. RMD now trades below the 50-day moving average line and slightly above the 200-day line.
The daily On-Balance-Volume (OBV) line has moved lower since early April and tells me that sellers of RMD are more aggressive than buyers. The Moving Average Convergence Divergence (MACD) oscillator has been correcting lower since early May and is now crossing below the zero line for an outright sell signal.
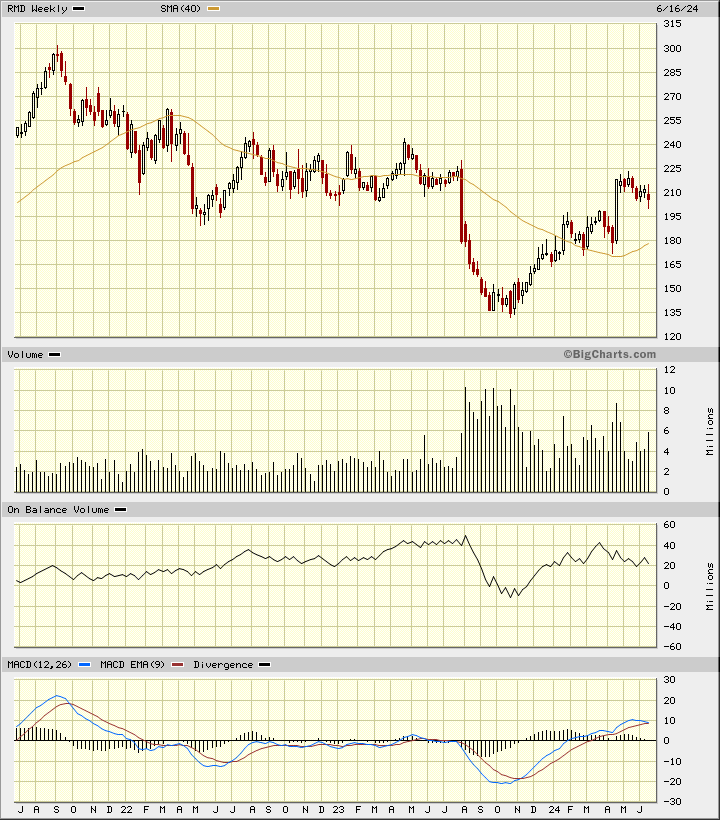
In this weekly Japanese candlestick chart of RMD, below, I see a weakening setup. Prices have been declining the past six weeks.
The weekly OBV line has been edging lower and the MACD oscillator is ready to cross to the downside for a take profit sell signal.
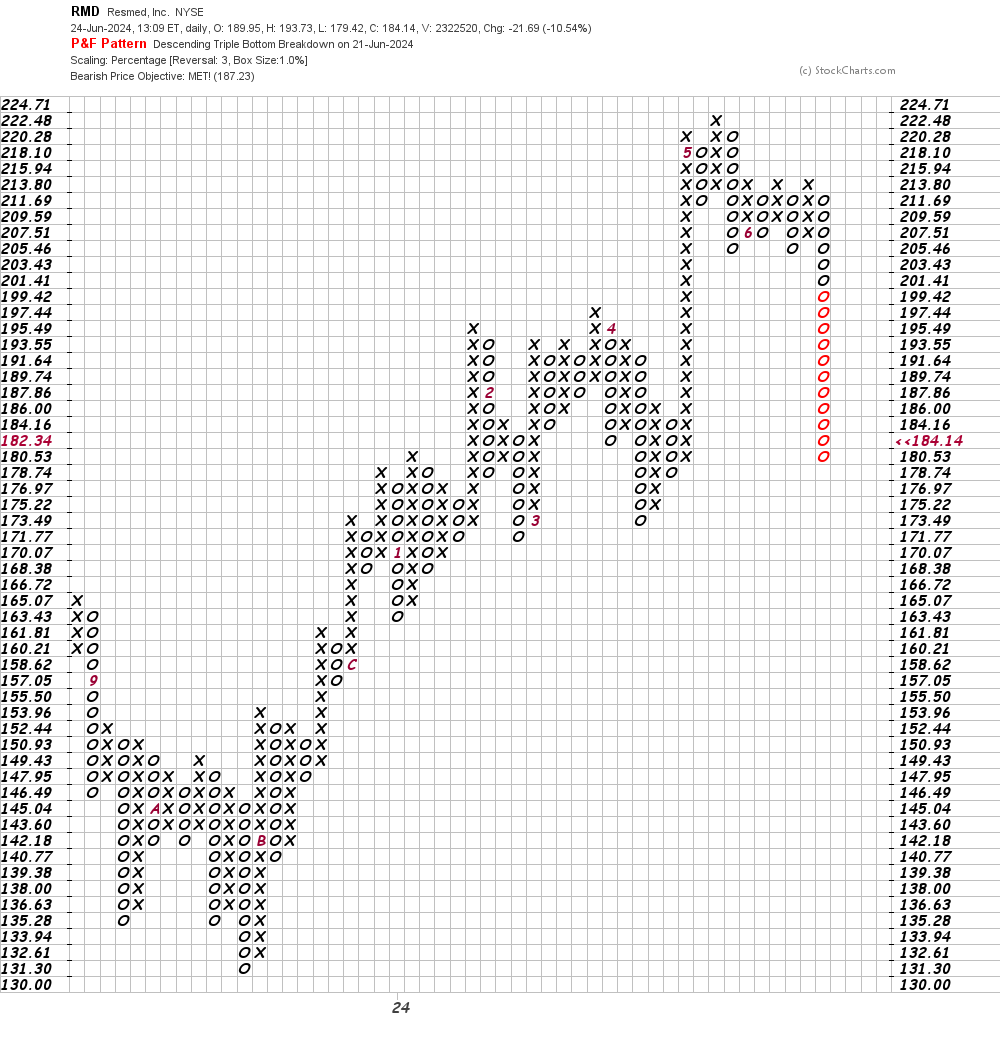
In this daily Point and Figure chart of RMD, below, I can see that prices have reached a downside price target in the $187 area.
In this weekly Point and Figure chart of RMD, below, I can see the same price target as on the daily chart above — $187.
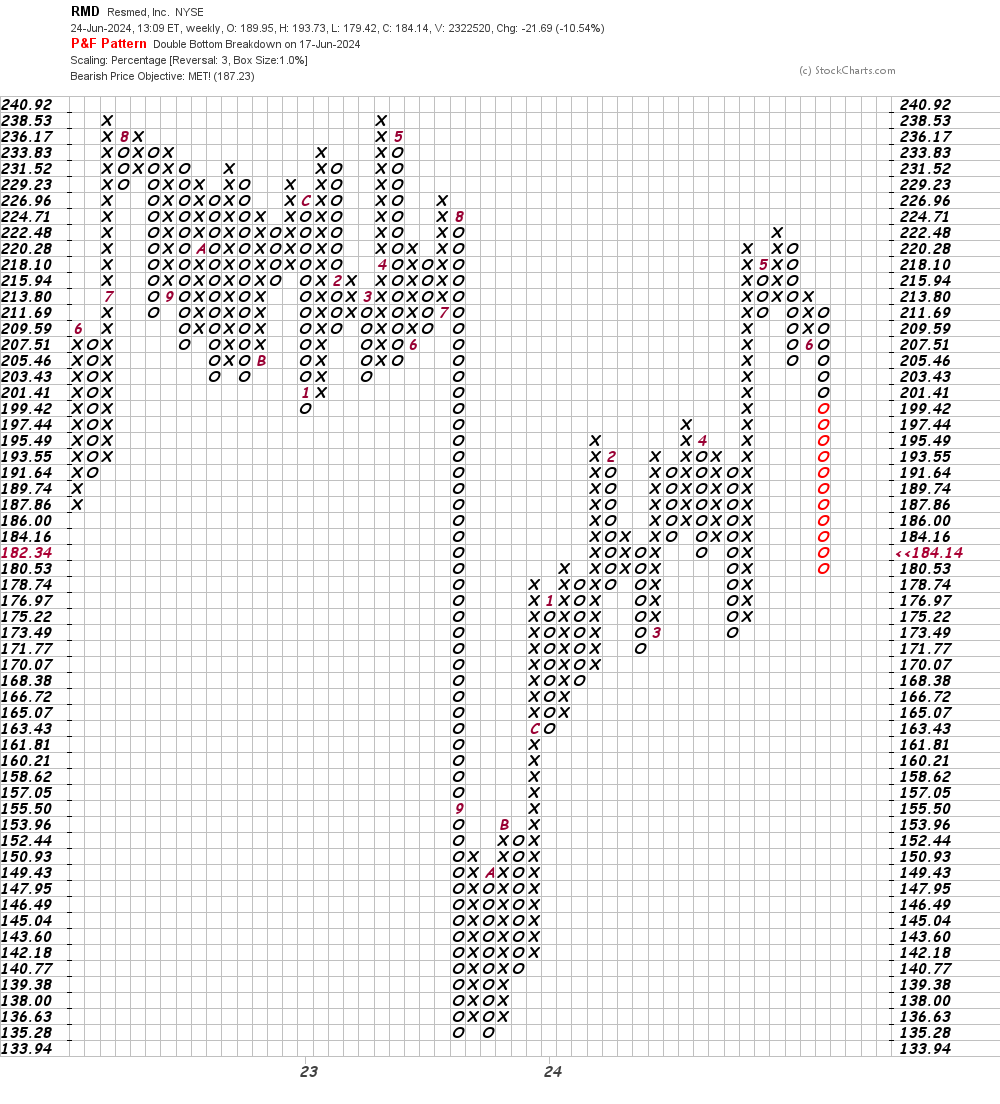
Bottom-line strategy: RMD is weak and the next chart point is the $170 area, the lows of February and April. A break of these lows will likely precipitate further declines.
Employees of TheStreet are prohibited from trading individual securities.