The Rally in ResMed Looks Ready to Take a Breath
Let's check the condition of the charts and indicators.
You've reached your free article limit
You've read 0 of 1 free Pro articles.
ResMed RMD has sprinted higher in recent days as its competitor Philips PHG halts sales of its sleep therapy devices. Let's review the condition of the charts and indicators.
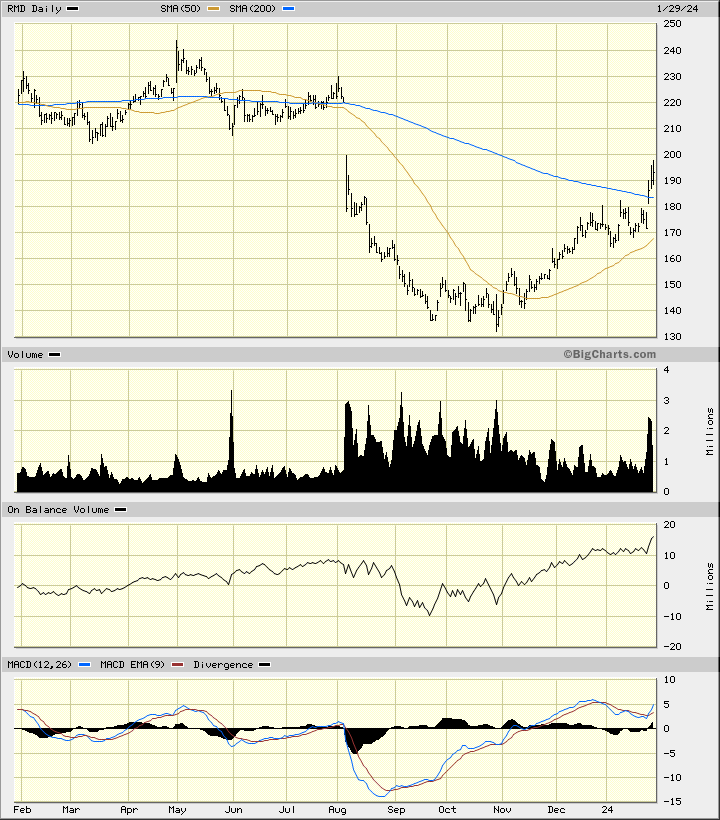
In this daily bar chart of RMD, below, I can see that prices made a small bottom in September/October before turning higher. RMD is now trading above the declining 200-day moving average line and above the rising 50-day line.
The On-Balance-Volume (OBV) line has been rising from a late September low. The Moving Average Convergence Divergence (MACD) oscillator is above the zero line and just turned upwards for a fresh outright buy signal.
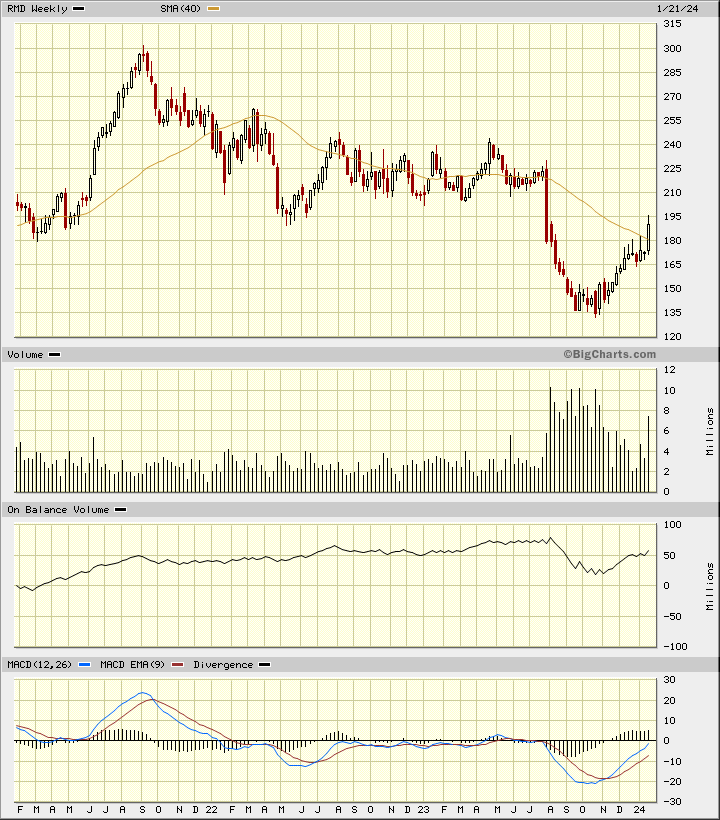
In this weekly Japanese candlestick chart of RMD, below, I see a mixed picture. Prices have rallied above the 40-week moving average line but its slope is negative and there is plenty of potential chart resistance in the $200-$225+ area. The weekly OBV line has firmed the past three months but is off its best levels. The MACD oscillator has been improving but remains below the zero line.
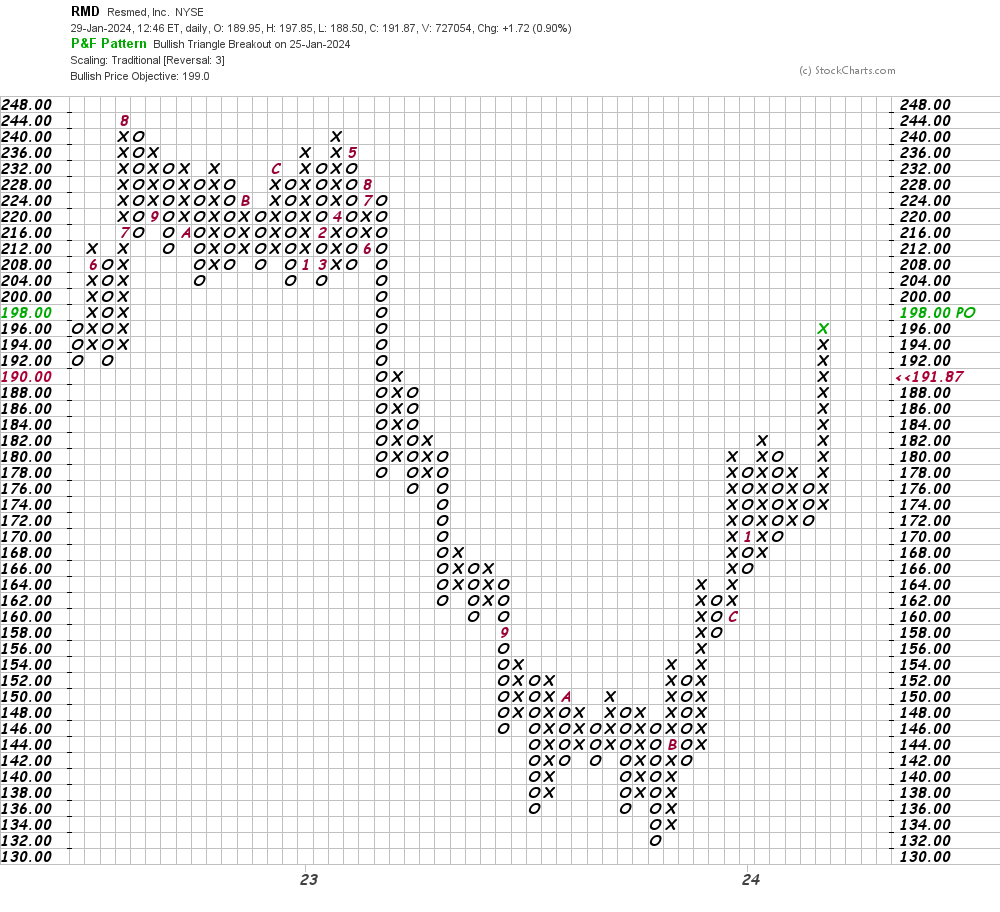
In this daily Point and Figure chart of RMD, below, I can see a nearby price target in the $199 area.
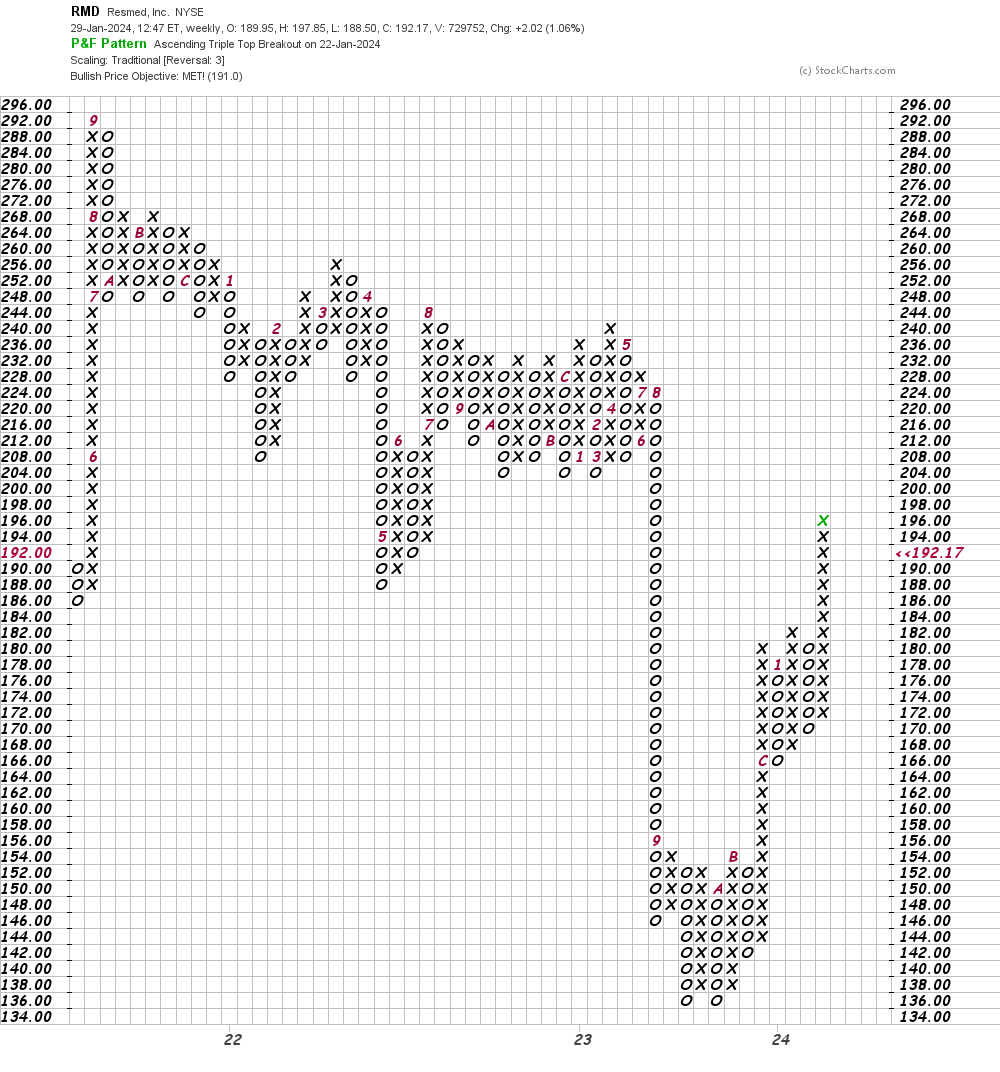
In this weekly Point and Figure chart of RMD, below, I can see that prices have reached and exceeded a $191 price target.
Bottom line strategy: RMD has made a good run to the upside but a pause or pullback looks likely at this point in time.
Employees of TheStreet are prohibited from trading individual securities.