Why Am I Rooting for the Nasdaq to Fall?
Because it would help set the indicators up for a more reliable rally.
You've reached your free article limit
You've read 0 of 1 free Pro articles.
The Market
C’mon, Nasdaq, come back down. Come back down and break that line. Even better, break that early June low (on a closing basis).
Why? Because maybe we can see fewer than 350 new lows (that’s the reading we saw in June). Today’s reading was 183, so it’s possible.
Why? Because the ‘what if’ for the McClellan Summation Index, which got oversold early this week, is still oversold, and any decline should get it further oversold.
Why? Because the Nasdaq Momentum Indicator still lines up to be oversold early next week, even if Nasdaq falls one thousand points between now and then.
Why? Because that ISE call/put ratio from yesterday’s discussion, surely will show more puts than calls. Maybe the CBOE will show more puts than calls, too.
Why? Because I think if we do get the Nasdaq (and maybe even the S&P!) to come back down, we could get the VIX jumpy.
Of course, because I want that set up, we probably won’t get it. In the last two months, all we seem to do is pin ourselves to that 7500 area on the S&P and that mid-25,000 area on Nasdaq.
I will end by noting that bonds are picking up some attention, although with earnings season in gear, bonds have taken a back seat, yet they creep up every day. The DSI on bonds is now 19. So that’s another ‘why’ I could add to the above. If bonds fall (rates rise), we might get some hysteria, and along with that, we already have a DSI that is a teenager so we might get it to be a ‘tween,’ which would be a nice setup to buy bonds.
Lastly, I did a short video today, mostly just a chat on my background and how I view markets (not a current market view), if you’d like to watch.
New Ideas
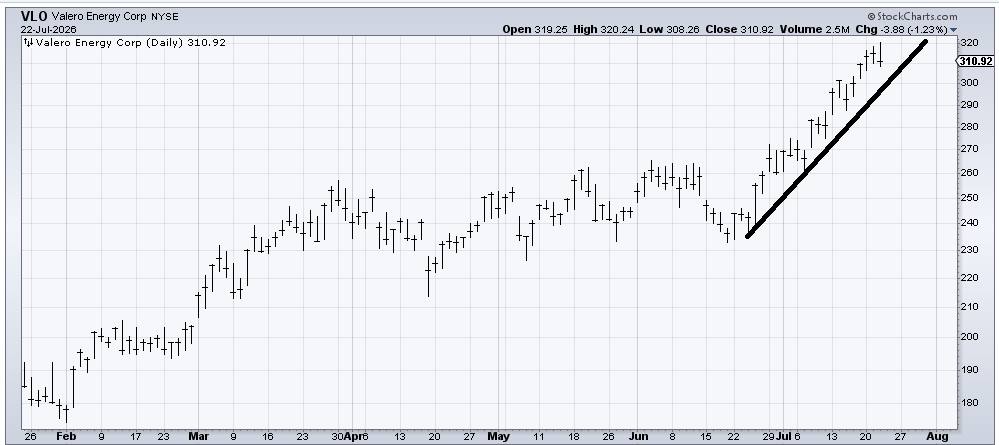
Keep your eye on the oil refiners. Valero (VLO) has been on a tear (silly me, my pick was Chevron in energy), and despite oil closing higher today, VLO was down. I am not bearish on the chart, but a trip down to tag that line around 300 should lead to another bounce.
Today’s Indicator
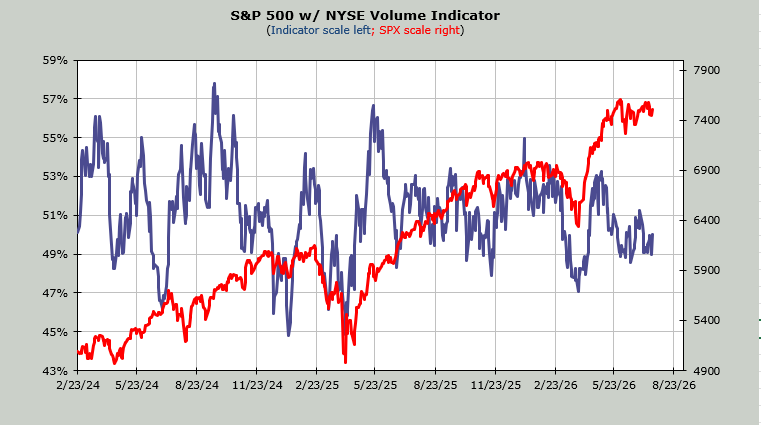
The Volume Indicator sits at 49%. If we can get this to 47% it would be oversold?
Q&A/Reader’s Feedback
Helene welcomes your questions about Top Stocks and her charting strategy and techniques. Please send an email directly to Helene with your questions. However, please remember that TheStreet.com Top Stocks is not intended to provide personalized investment advice. Email Helene here.
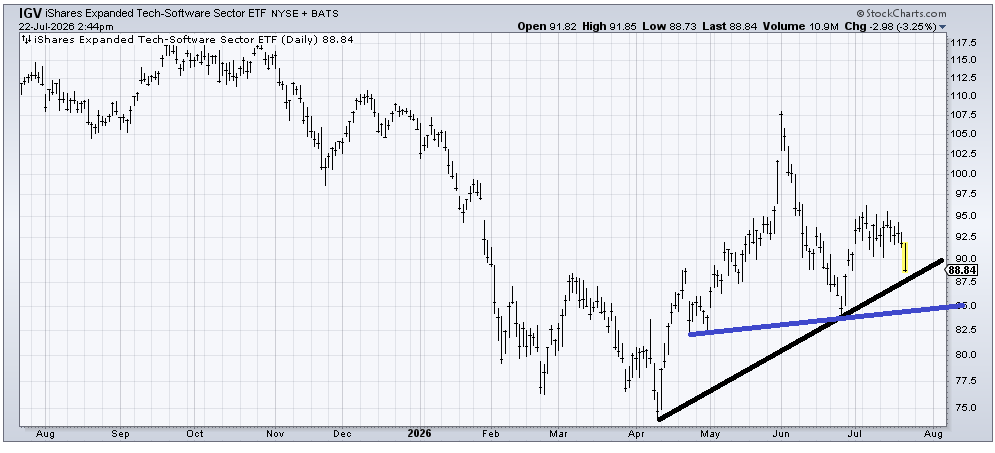
IGV, an ETF to be long software stocks, would be in the category of ‘others,’ which, as I had said, I expect the month of August to be tough for them. Perhaps that began earlier than I expected. Short term, there is some support at the black line, but I expect to see this push closer toward the blue line over the next few weeks.
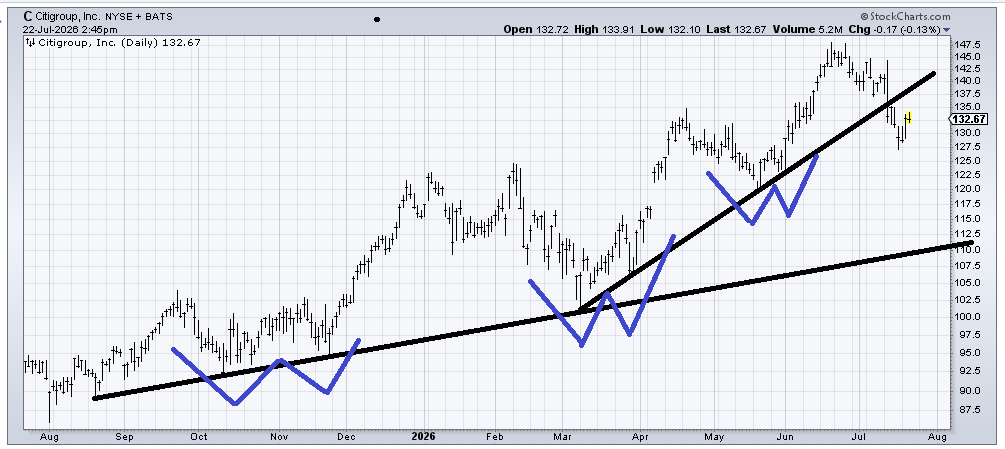
We had such a nice trade in Citigroup (C) in the month of June, but now it has given up nearly the entire gain from the month, and it has broken the uptrend line. There is quite a lot of support in the low 120s, so if it can start to show some bottoming action in the next few weeks, I might just warm up to it again. There is no top to speak of, just a broken uptrend line for now. I would like to see a W pattern shape up.
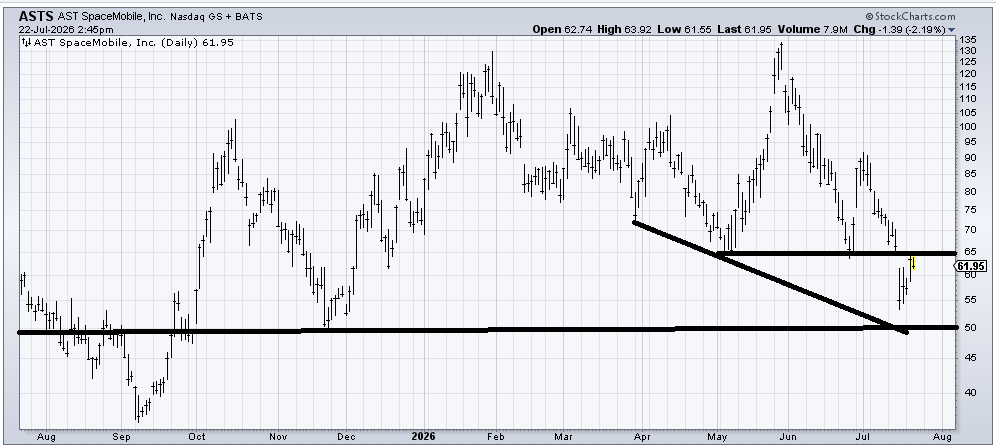
AST SpaceMobile (ASTS) has resistance at 65, so unless/until it can get back up and over that level to tell us that last week’s breakdown was a false one, I’m not sure I trust it. If it comes back down and holds 50, perhaps it gets interesting, but there is resistance all the way up now.
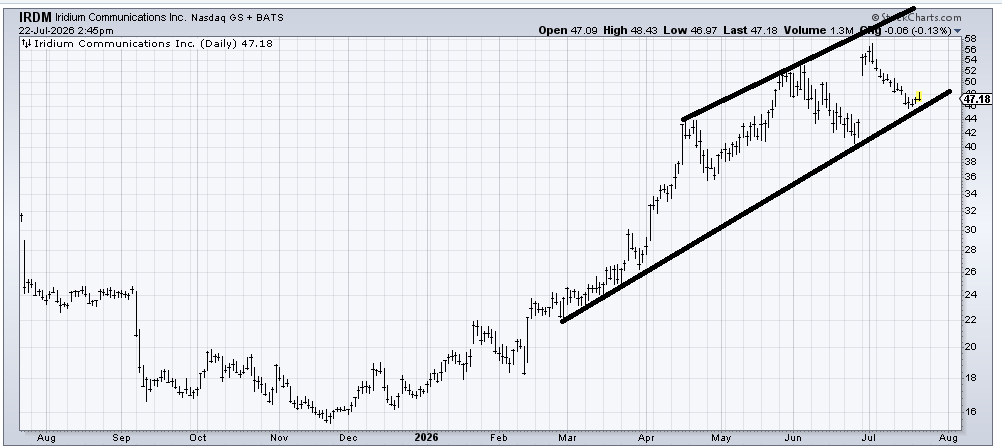
I don’t love the chart of Iridium (IRDM) because it gapped up and then gave it all back, but the risk/reward isn’t bad here. The gap would be filled at 44, so somewhere in the 44-47 area, it ought to bounce. If it cracks under that late June low, then I’m wrong.
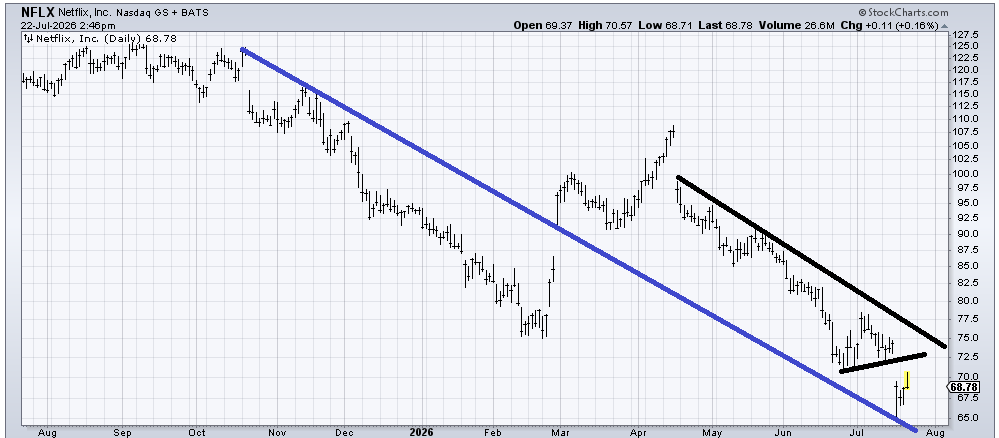
When Netflix (NFLX) came down into that low 70s area, I thought it was a decent risk/reward. We got a pop to 77 before it died. Unless/until it forms a proper pattern, I’m not sure it can get much higher than that downtrend line on an oversold rally.
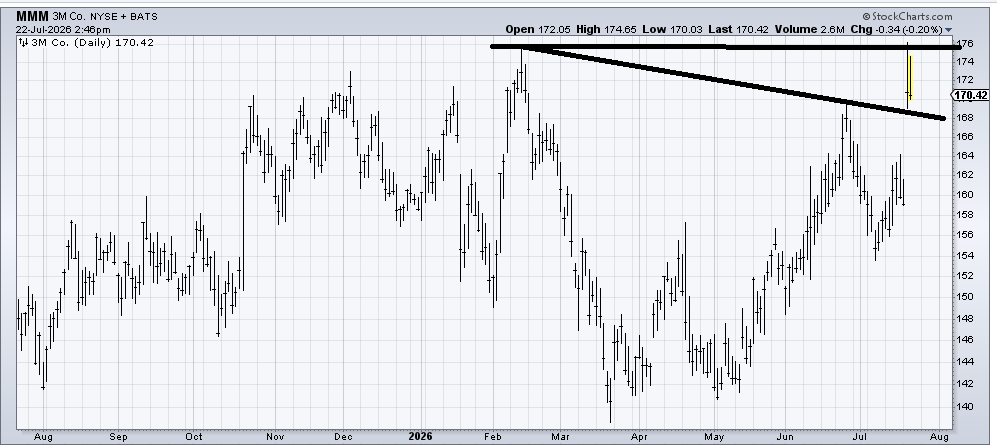
I want to love 3M (MMM) because it really has a decent base, but how can you love a chart that gaps up to resistance and then tries to have follow-through and can’t seem to do it? If the stock can hold over 168-ish, it will be more interesting to me on the long side.
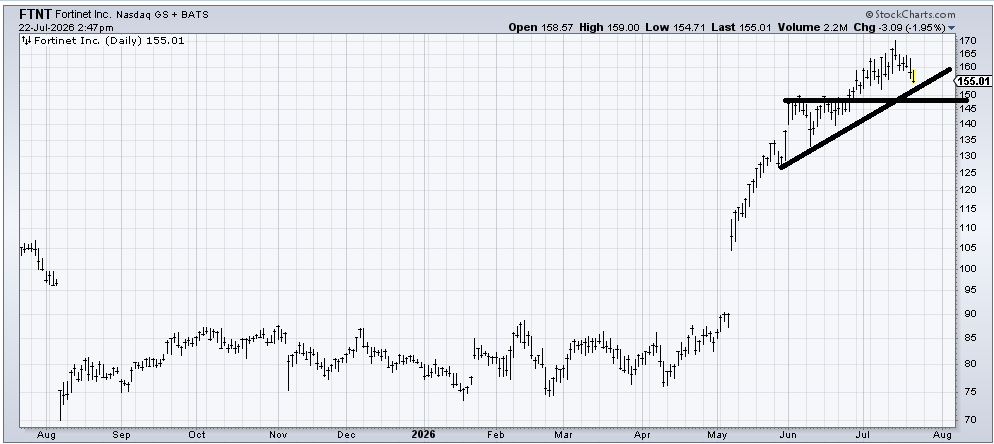
Fortinet (FTNT) hasn’t done anything wrong. And breaking that short-term uptrend line would not even qualify for doing something wrong. Cracking under 150 (where it just broke out from) wouldn’t be great. So let’s see if it can hold over 150-155 because my guess is it attempts to get to 150 in the next few weeks.
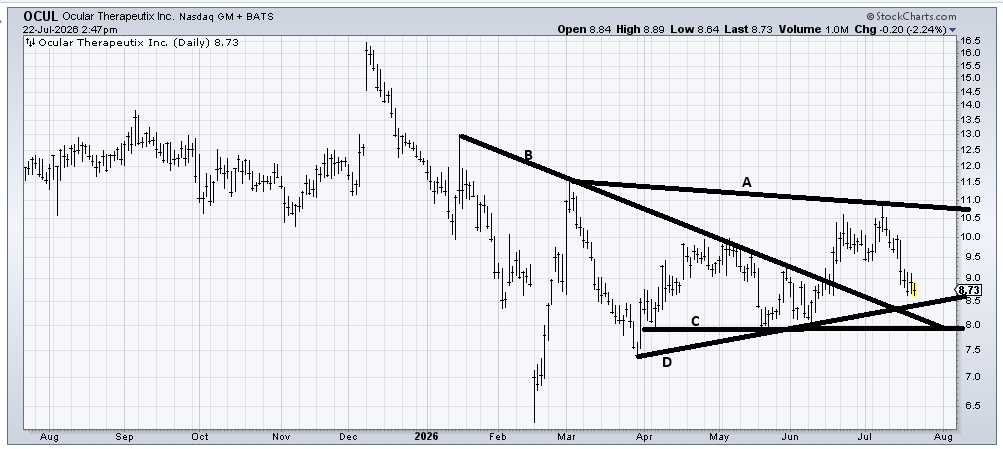
Ocular Therapeutix (OCUL) is trying to base, but if it cannot hold over 8, that would be bearish. I’ve drawn a lot of lines on the chart, so let me explain. Line A is obvious resistance. Line B and line C intersect at 8, making it decent support. Finally, line D: if it can hold there, it’s bullish.
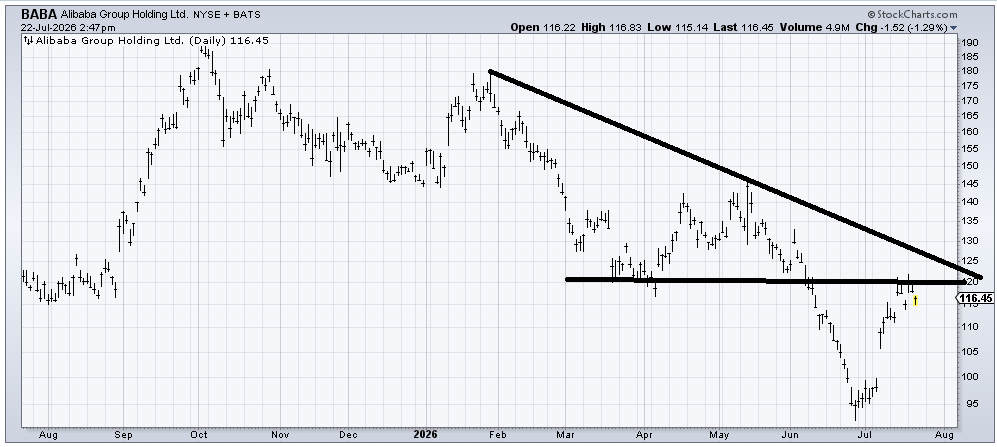
Alibaba (BABA) finally had a decent oversold rally. Everyone got so bulled up, and the stock hasn’t done a thing in a week. I suspect it makes another try at 120-125, but mostly it looks like an oversold rally that needs some retesting.