When the Rubber Band Stretches Too Far, You Get a Snapback
The day we've been waiting for finally happened. Also, QCOM, SQ, BAX, and PEP.
You've reached your free article limit
You've read 0 of 1 free Pro articles.
The Market
It was a 493 day for sure.
There will be statistics floating around reporting that it’s hard to find another time where the small caps or breadth outperformed Nasdaq or the S&P by this amount. Or some sort of statistic like that. I have seen the dates. Each one of them came during an incredibly volatile time in the market.
By this I mean they showed up after volatility had soared. So how can you compare this market to any of those other instances? I say we can’t. What we can do is rely on our indicators.
The indicators have been saying for three weeks now that the others should rally in early July. It has taken eight trading days for that to happen. I can’t say what it means that the S&P was down because, quite frankly, we’ve had the last two months where most stocks were down and the S&P was up, just never to this extent in one day.
I surmise that we got this day because the rubber band had stretched far too much, and this was the snapback.
Breadth was good enough to make a higher high (barely). It was good enough to get the McClellan Summation Index to finally rise. In fact it rose so much in one day that it will now require a net differential of -2500 advancers minus decliners on the NYSE to halt the rise which oddly makes it short term overbought.
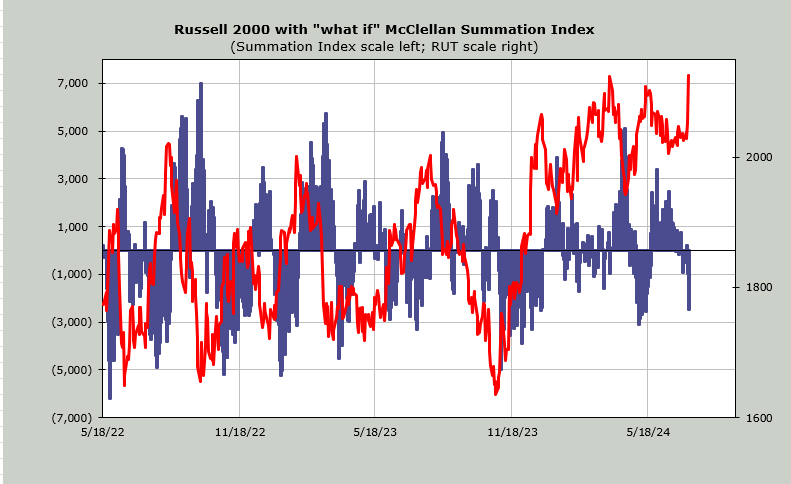
I had noted yesterday that on a short term basis the market would be a little overbought (the others) by Friday so this is in keeping with that. On an intermediate term basis we are not yet overbought.
The new highs increased but they are still under where they were two months ago. But there is improvement.
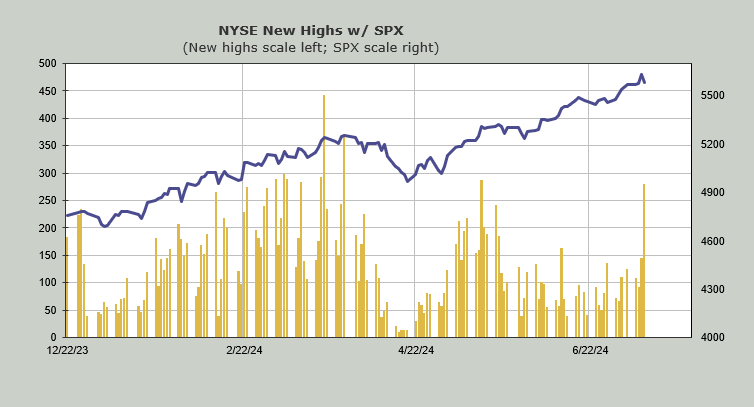
But we have the tale of two markets. Still. Whether it’s the index movers going up or going down and everything else going the other way. Today just pushed it in the other direction.
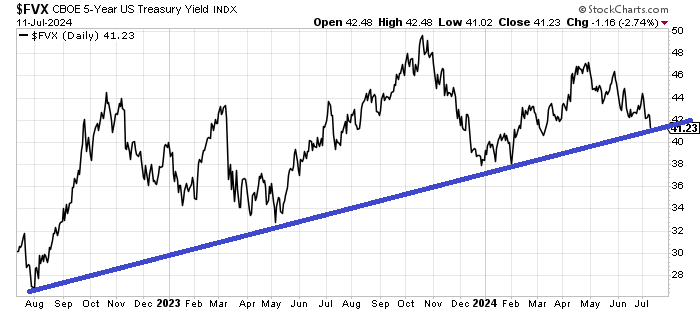
Much was made over the move in bonds. I am focused on the yield on the Five Year now. It is sitting right at the line. If this line breaks then I think it signals quite a change.
The Utes have already started to move (up 2.2% today) which I always consider a positive. I suspect there is some sloshing around/pulling back in the next few days. Let’s see if it sets up some good charts.
New Ideas
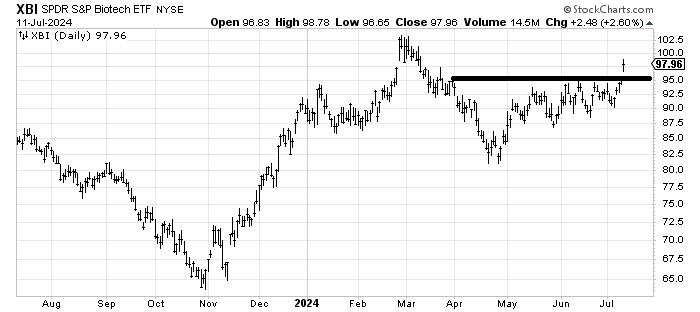
The XBI was the only real breakout I saw today, which I warmed up to earlier this week. I think it makes its way to those old highs over time.
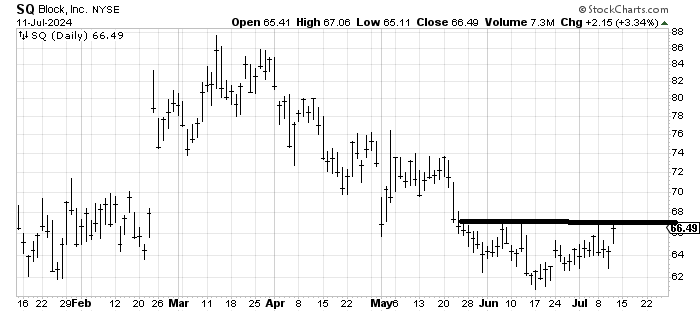
Another name I liked earlier this week, Block (SQ:NYSE) has just churned around this week. It still needs to get over this line. I continue to wait (not so patiently)
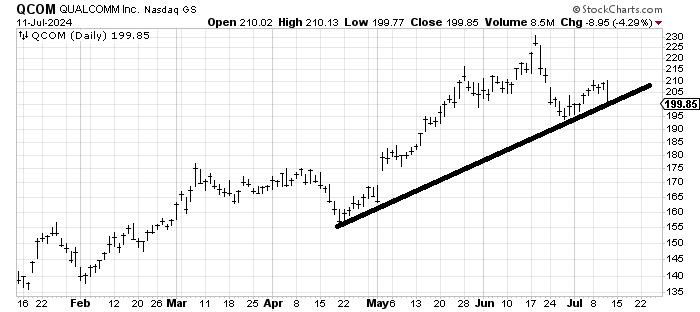
I am going to focus on Qualcomm (QCOM:Nasdaq) because it made a lower high but hasn’t broken the uptrend line yet. If it breaks the uptrend line that would be quite a change in pattern. I would look for a quick trip to 192-195.
Today’s Indicator
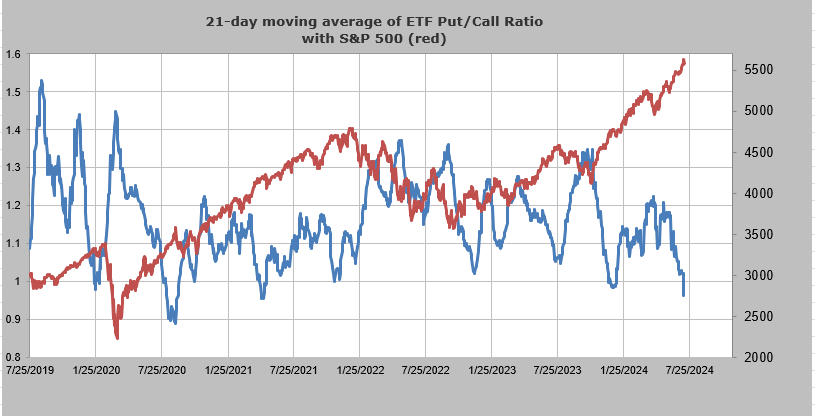
The 21 dma of the ETF put/call ratio is really low, an area that we have typically had corrections from.
Q&A/Reader’s Feedback
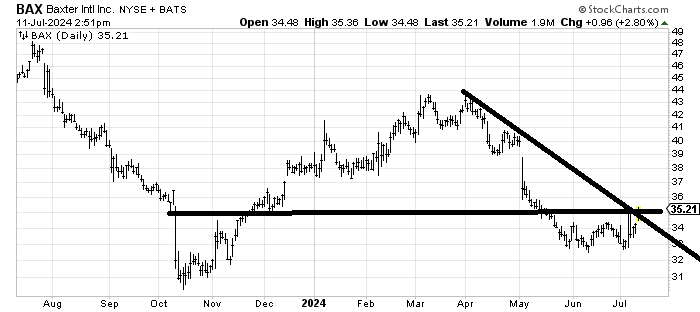
About a month ago we looked at Baxter (BAX:NYSE) with a positive eye. It hasn’t done much since then but it now has that look of trying to form a small bottom. I still think it gets the benefit of the doubt so if it can get through this 35-36 area then I’d look for it to fill that gap area above around 39-40. I would expect it to take time though.
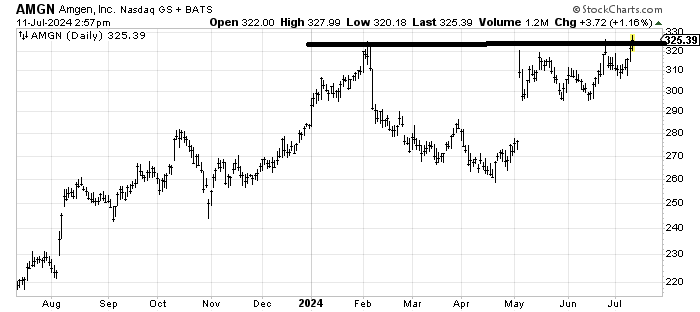
We already know I like XBI (which finally broke out with gusto today) but the question is if Amgen (AMGN:Nasdaq) can breakout from here and if so what’s the target?
A breakout is still required which means a move over 330 that sticks. Then I’d have a near term target around 345 with the chance at a longer term target in the 380 area.
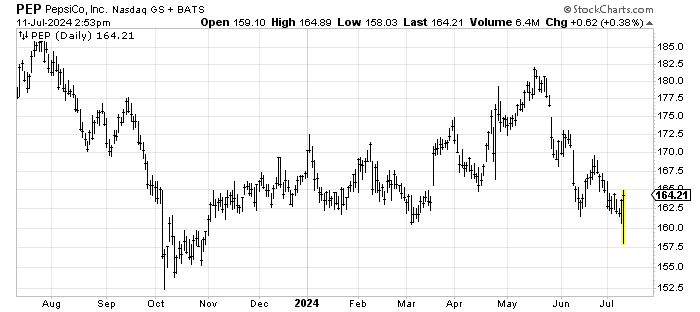
I was asked about Pepsi (PEP:Nasdaq) recently and I thought it was worth a bottom fish if it held this 160 area. This morning it broke but quickly recovered so I’ll stick with the view that as long as it holds this 160 area it should start the bottoming process, at least for a trade.