Weekly Roundup: Looking to the Second Half
We're pleased with the portfolio's Q2 2024 performance, but recognize there is more road to run.
You've reached your free article limit
You've read 0 of 1 free Pro articles.
Despite a lackluster finish that saw the S&P 500 little changed this week, the second quarter saw the broader market index and the Nasdaq Composite build on their year-to-date gains. You probably won’t be surprised to read the Nasdaq led the charge with its more than 18.5% gain year to date, while the S&P 500 grabbed the silver medal with its 14.5% year-to-date move.
Big Tech and AI were key drivers for those moves, as well as those in the portfolio given our holdings in Apple AAPL, Nvidia NVDA, Qualcomm QCOM, and Alphabet GOOGL. The portfolio also benefited from its position in Universal Display OLED, Costco COST and ServiceNow NOW. Each of those stocks outperformed the S&P 500 during the quarter.
The market also prospered from renewed progress on inflation, which led the yield on the 10-Year Treasury to close the quarter near 4.36%. While not quite the lows we saw in mid-June, that yield is considerably lower than the 4.7% posted in late April when the market had to reconsider the number of rate cuts depicted in the CME FedWatch tool.
We continue to think the market’s next sustainable move will be dictated by earnings prospects for the coming quarters, largely because the S&P 500’s P/E multiple is bumping up against its 2022-2023 highs. This means the upcoming earnings season could be volatile until we have a clear sense if second-half EPS prospects for the S&P 500 will be above the 12.5% year-over-year gain expected by the market. Based on the latest consensus market forecasts, aggregated EPS for our portfolio holdings are expected to grow more than 20% in H2 2024 compared to H2 2023. They are also expected to post EPS growth of nearly 29% compared to H1 2024, well ahead of the 11.2% expected for the S&P 500 on that basis.
Those figures tell us we are well positioned for the coming quarters, but we also know developments happen, and expectations can get ahead of themselves. That is why we will continue to update our thinking as we begin and move through the June-quarter earning season. While we’re pleased with how the portfolio has progressed during the June quarter, we recognize we’re only halfway through the year. We’re not going to rest on our laurels just yet and we’ll be careful to watch out for any pitfalls along the way.
Catching Up on the Portfolio This Week
We began this last week of the quarter by adding to the portfolio’s newest holding, Builder’s FirstSource BLDR, taking advantage of the recent pressure on the shares even though recent data and homebuilder commentary showed improving building activity. Later that same day, we adjusted panic points for a half dozen of our holdings, including Apple, Costco, and Nvidia. On Friday, we picked up more shares of Qualcomm, sharing as well that we are aware the position size for Universal Display is flirting with 4.5%. OLED shares have been a stalwart for the portfolio, but should they climb much further, prudent portfolio management may lead us to lock in a slice of those gains.
During the week we held our latest quarterly, members-only call that reviewed the portfolio’s progress and touched on a number of its holdings. Shutting the books on the June quarter a few days later, we can safely say that building up our position in Nvidia early in the quarter, exiting McDonald’s MCD and the inverse ETF positions shares when we did, and initiating new ones in The Trade Desk TTD, Labcorp LH, and ServiceNow were good moves for the portfolio.
We also used share-price weakness during the quarter to build up our holdings in Coty COTY ahead of entering the seasonally stronger time of year for its beauty business. The coming quarters and their seasonally stronger demand should have a similar impact on our shares of Apple, Qualcomm, Universal Display, PepsiCo PEP, and several others. Typically, the September quarter is the strongest of the year for construction activity, which suggests we should see nice performance and guidance in a few weeks from United Rentals URI and Vulcan Materials VMC.
With our cash levels now back below 10% and barring any register ringing that would bring some additional cash into the fold, we will have to be selective with any next moves. As we prepare for that, we’ll be revisiting EPS expectations for the coming quarters relative to the S&P 500, but keeping in mind which companies in the portfolio are entering their seasonally stronger times of the year. The goal will be to refine the portfolio’s positioning for the second half of 2024 and beyond.
This Week's Portfolio Videos and Podcasts
We cover a lot of ground during the week in our Daily Rundowns and the Portfolio Podcast. If you happened to miss one or more of them, here are some helpful links:
Monday, June 24: Here's Our Roadmap for the Final Week of the Quarter
Tuesday, June 25: Why Micron's Earnings Will Be Important for Big Tech
Wednesday, June 26: Wrapping Up the Quarter With Our Members-Only Call
Friday, June 28: Why the Portfolio is Ending the Quarter on a High Note
Key Global Economic Readings
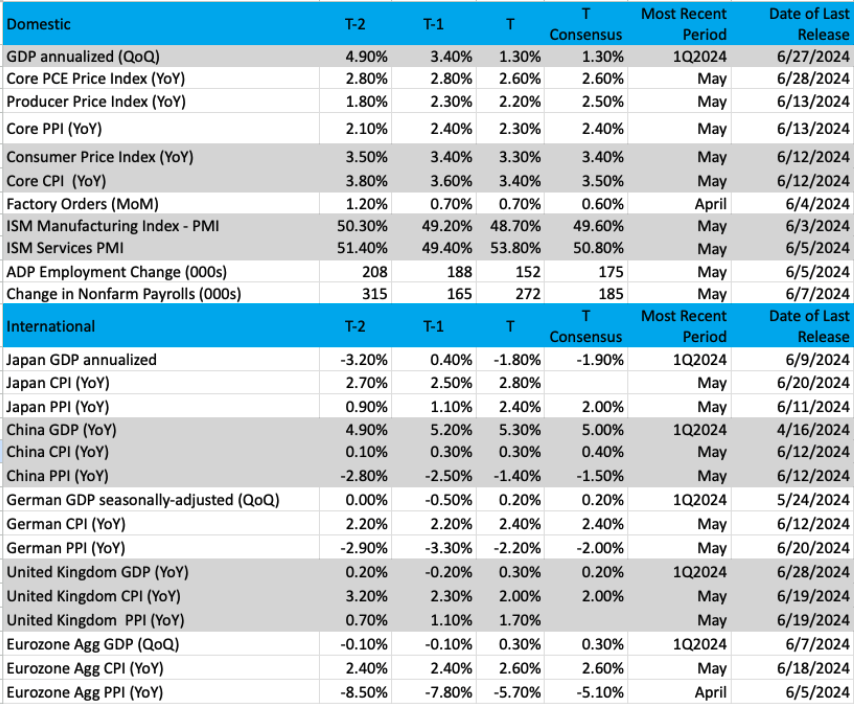
(Note: T is the most recent period, T-1 is the prior period's reading and T-2 is two periods back, the intent being to illustrate any trends)
Chart of the Week: SPY and IWM Divergence
Divergences can exist for quite some time and they don’t have to necessarily matter when we notice them. What exactly is a divergence? Markets or asset classes often move together, up or down, or converge. When those traits are abandoned and suddenly an index starts moving on its own independently, a divergence develops, which is often unsustainable.
For instance, the S&P 500 versus the Russell 2000 has shown sharp differences this year. This represents a NEGATIVE divergence. Not only in performance (S&P up 14%, Russell up 1%), but in breadth, depth (volume), momentum, and money flows. But those differences have lasted for quite a while and are only just now showing signs they are coming together.
Now, small-cap and large-cap stocks don’t necessarily have to be highly correlated. This means stocks move together in unison or very close to it. A correlated relationship is interpreted with a percentage. The closer to 1 the stronger the correlation. The S&P 500 (SPY) and Russell 2000 (IWM) on average is about 80% but can be as low as 60% and as high as 96%.
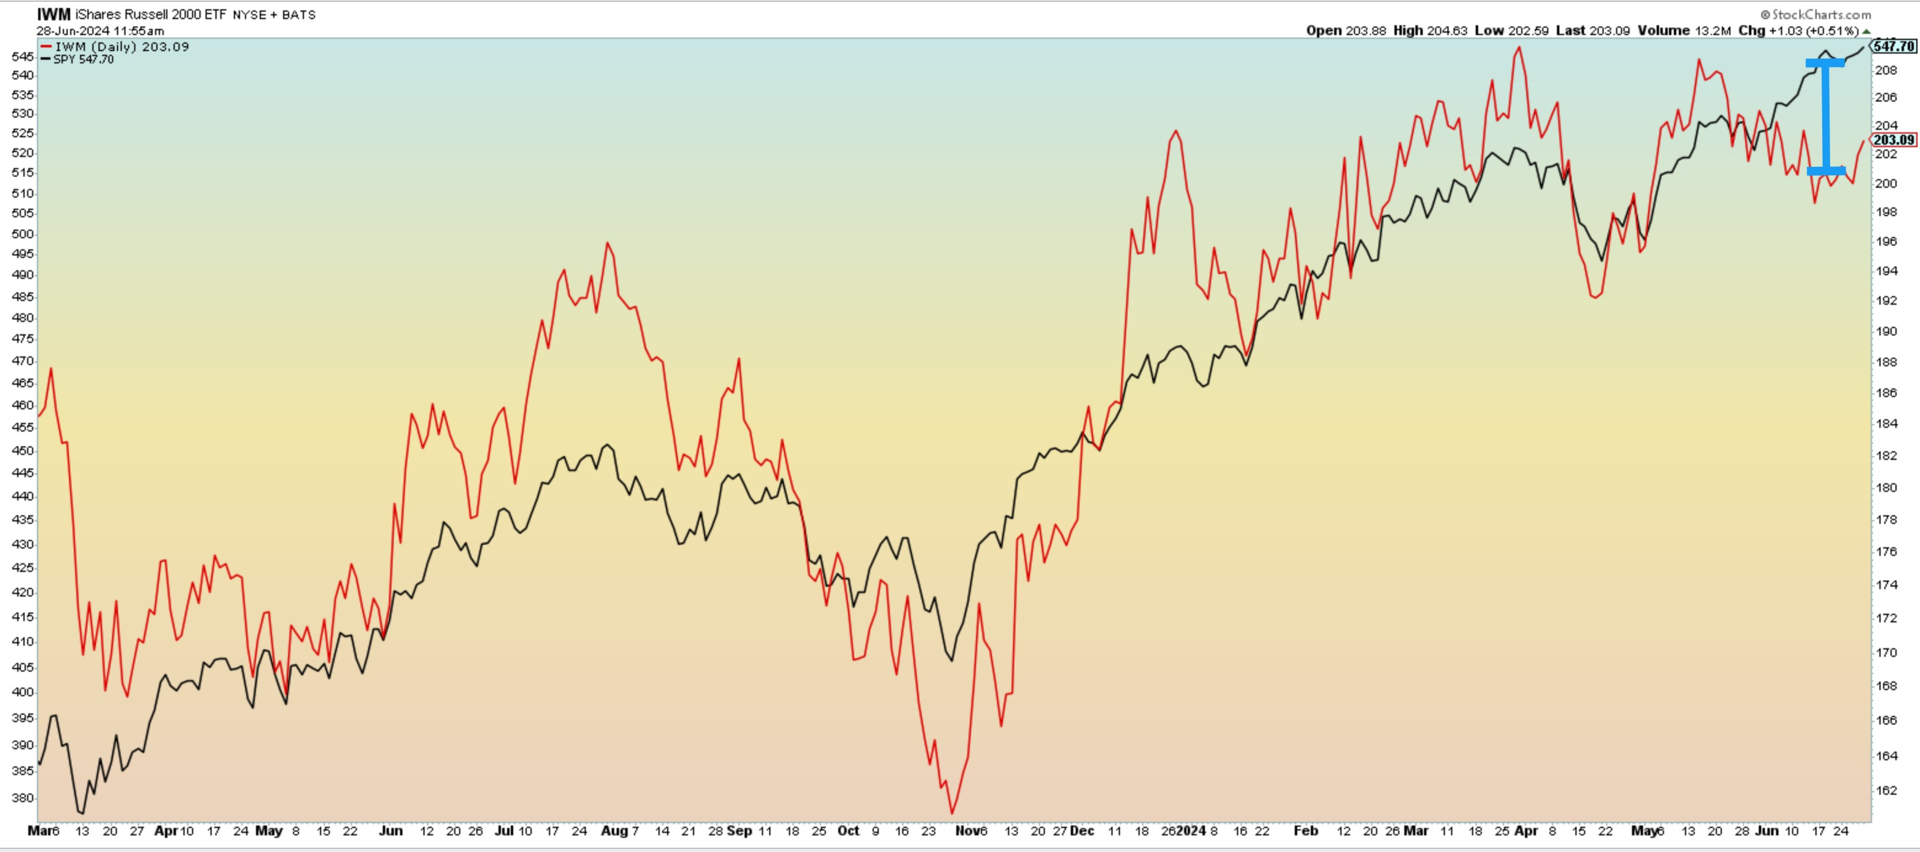
SPY is in BLACK, and IWM is in RED. The right side of the chart shows a deep divide that started in early May and continues to this day. The distance appears to be widening as well.
In the right-hand side of the chart, the divergence is very noticeable and quite wide. Looking at this 15-month chart there have been instances when the two indexes diverged like now (March 2023, late 2023, April 2024). Again, just because the signal is there does not mean we need to act upon it.
The current condition is starting to correct itself, and for the bulls, it would be best to see the Russell 2K ‘catch up’ to the S&P 500.
Why is that? In the chart, we see that IWM is the laggard, and the SPY continues to drive higher with good momentum. If the small-cap IWM does meet the large-cap SPY, it means we’ll have positive divergences taking hold.
Other charts we shared with you this week were:
Monday, June 24: S&P 500 - June Is Looking Like a Winning Month
Monday, June 24: Waste Management (WM) - Waste Management Is Getting It Done
Tuesday, June 25: Dutch Bros (BROS) – Dutch Bros Is Brewing A Fresh Batch of Highs
Wednesday, June 26: First Trust NASDAQ Cybersecurity ETF (CIBR) – An Excellent Place to Add Shares of This ETF
Thursday, June 27: Morgan Stanley (MS) - Morgan Stanley Waits Patiently
The Coming Week
As we kick off Q3 2024, equity markets be closed on Thursday, July 4th. Because of how that holiday falls, we’ll likely see a slow week, with lower-than-usual trading volumes, as markets will close early on Wednesday and especially on Friday given the penchant for many to take an unofficial long weekend.
Lower volume weeks can be a bit deceptive, however, and not indicative of how the market may truly view the week’s developments. Still, next week starts the economic data parade for the month of June, and that calendar isn’t paying attention to the market holiday. We’ll be here to break it all down and assess what it means for the economy, job creation, wage gains, and, of course, inflation. As we update our mosaic to reflect this data, we’ll be thinking through what the implications are for the upcoming CPI and PPI reports as well as the dollar, gold, and oil demand.
In addition to June PMI and employment reports, which will likely bring another round of revisions for GDP models, we’ll also receive the May Construction Spending Report. Not seasonally adjusted single-family housing starts picked up in May, but with an eye toward the portfolio’s position in United Rentals (URI), Vulcan Materials (VMC), and to a lesser extent Waste Management (WM), we’ll be focused on what the report says about non-residential construction. Typically, the transition to warmer weather bodes well for that construction activity. With infrastructure and related spending occurring, we should see favorable comparisons in the May data.
With about a month to go before the Fed’s next policy meeting, we expect Fed Chair Powell’s appearance next Tuesday will garner ample attention. Exiting the week, our view is the Fed will continue to look for more good data given the upward revision to the April core PCE figure that we pointed out in our breakdown of the May PCE report on Friday.
Should next week’s PMI reports throw a wrinkle in the "inflation is improving" narrative, it could disrupt the market following the growing anticipation for rate cuts that have crept back into the market. Should that be the case, lower-than-usual trading volumes because of the holiday exacerbate any swings we might see. Our plan is to tread cautiously next week, but as we were on Friday with our addition of incremental Qualcomm shares, we’ll be looking for opportunities as well.
Here's a closer look at the economic data coming at us next week:
U.S.
Monday, July 1
S&P Global Final Manufacturing PMI – June (9:45 AM ET)
ISM Manufacturing PMI – June (10:00 AM ET)
Construction Spending – May (10:00 AM ET)
Tuesday, July 2
Fed Chair Powell Speech (9:30 AM ET)
JOLTS Job Openings & Quits – May (10:00 AM ET)
Wednesday, July 3
MBA Mortgage Application Index – Weekly (7:00 AM ET)·
Challenger Job Cuts Report – June (7:30 AM ET)
ADP Employment Change Report – June (8:15 AM ET)
Initial & Continuing Jobless Claims – Weekly (8:30 AM ET)
S&P Global Final Services PMI – June (9:45 AM ET)
ISM Non-Manufacturing Index – June (10:00 AM ET)
Factory Orders – May (10:00 AM ET)
EIA Crude Oil Inventories – Weekly (10:30 AM ET)
EIA Natural Gas Inventories – Weekly (12:00 PM ET)
FOMC Meeting Minutes – 2 PM ET
Friday, July 5
Employment Report – June (8:30 AM ET)
International
Monday, July 1
China: NBS Manufacturing & Non-Manufacturing PMI – June
China: Caixin Manufacturing PMI – June·
Japan: Jibun Bank Manufacturing PMI – June·
Eurozone: HCOB Manufacturing PMI - June
Tuesday, July 2
Eurozone: Flash Inflation Rate - June
Wednesday, July 3
China: Caixin Services PMI – June·
Japan: Jibun Bank Services PMI – June·
Eurozone: HCOB Services PMI – June·
Eurozone: PPI - May
Friday, July 5
Eurozone: Retail Sales - May
Because most companies are in their quiet period ahead of the June-quarter earnings season that will get underway on Friday, July 12, we have less than a handful of those reports next week. Our plan will be the same as it has been over the last few, digesting the coming reports for insights about what we’re likely to hear in the coming weeks. Demand, inflation, wage pressure, currency, and the dollar are all likely topics.
When we return on Monday, we’ll be sharing our thoughts about dividend and buyback announcements made after Friday’s market close from big banks and other financial companies. In Friday’s video, we shared why Morgan Stanley (MS) could make some dividend news, and based on that and whatever is announced by Bank of America (BAC), we’ll revisit our price targets for BAC and MS shares as needed.
Here's a closer look at the earnings reports coming at us next week:
Tuesday, July 2
Open: MSC Industrial (MSM)
Wednesday, July 3
Open: Constellation Brands (STZ)
Close: Blackberry (BB)
Portfolio Investor Resource Guide
Economic Data: Here's a List of Links to the Key Economic Data We Closely Watch
Investing Terminology: 16 Key Terms Club Members Should Know
10-Ks: Want to Know About a Stock? Read the Company's Reports
10-Qs: Unlock the Numbers and Key Information Behind Your Stock With the 10-Q
Income Statement: Our Cheat Sheet to Understanding This Financial Document
Balance sheet, Cash Flow Statements, and Dividends: How to Know If a Company Is Off-Kilter? Read Its Balance Sheet
Valuation Metrics: Everyone Wants a Value. Here's How Investors Can Find
The Portfolio Ratings System
1 - Buy Now (BN): Stocks that look compelling to buy right now.
2 - Stockpile (SP): Positions we would add to on pullbacks or a successful test of technical support levels.
3 - Holding Pattern (HP): Stocks we are holding as we wait for a fresh catalyst to make our next move.
4 - Sell (S): Positions we intend to exit.
