We Walked Through the Door of Giddy Only to Find Momentum Near a Peak
Let’s dig in to the sentiment, options, and momentum indicators.
You've reached your free article limit
You've read 0 of 1 free Pro articles.

The Market
Having turned optimistic on tech/semis/growth a few weeks ago, when I thought the negativity and selling had gone too far, I tend to want to continue to give those stocks that were so beaten up a chance to improve. But then I see the change in sentiment, and I want to run the other way!
Over the course of the last two weeks, we’ve gone from ‘tech/semis are a problem for the market’ to ‘okay, nothing more to worry about here’. The shift in sentiment has been dramatic. I’m not even sure it was this dramatic coming off the March low. But that mostly is, thus far, anecdotal.
I do expect the surveys to catch up to the chatter this week, though. The Investors’ Intelligence bulls jumped up just over four points this past week to 53.7%. The results are tallied through the prior Friday. With this Friday being an up day, I expect we will see, when the results are released on Wednesday, a move in the bulls to over 55%. I mean, how hard will it be to get this over 55%? Not hard.
The bulls peaked in late June at 55.8%. They peaked at 62.3% in early February. The bears sit at 14.8%. This is the lowest since late February. I think to myself if the bulls get to 56% and the bears tick down at 14%–none are big moves—then the ratio of bulls to bears is going to be 4.0. That is four bulls for every bear. And for me, that means we’ve gone from knocking on the giddy door to marching right through it.
Oh, I am sure someone will say, yes but AAII isn’t extreme. Long-time readers know I think AAII is mostly a garbage survey, taking into account around 300 old people who simply must point and click. But either way, let’s say you like this survey, do you know the last time the Bulls got over 50%? Two years ago, in July of 2024. Do you think that reflects the reality of market participants? I don’t. I mean, if you use this, it says folks are never optimistic on the market. Oh, and since that reading that was 52% bulls, we’ve had two ten percent drawdowns and one twenty percent drawdown.
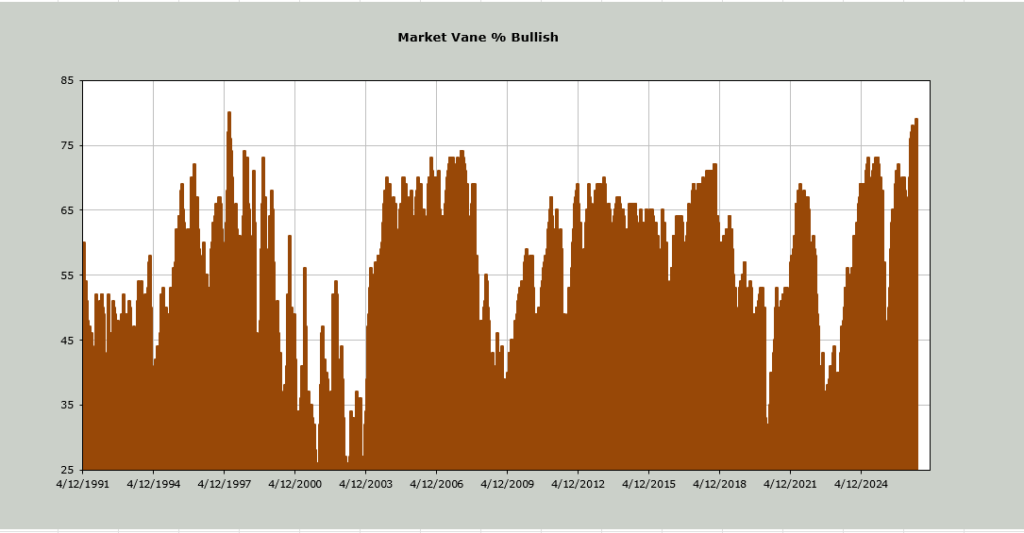
Anyway, this past weekend the Market Vane Bulls chimed in at 79%. That is the highest since June of 1997. Yep, almost thirty years. I highlighted this survey in early June (as the SOX was peaking) when it got to 77%, which was the highest such reading since the aforementioned July 1997.
For those unfamiliar with the market in 1997, let me note that the Asian currencies began revaluing in early July, throwing their markets into a tizzy. Our market didn’t seem to notice much until the fall, and then we got smacked for ten percent in a matter of days, causing bears to come out of the woodwork.
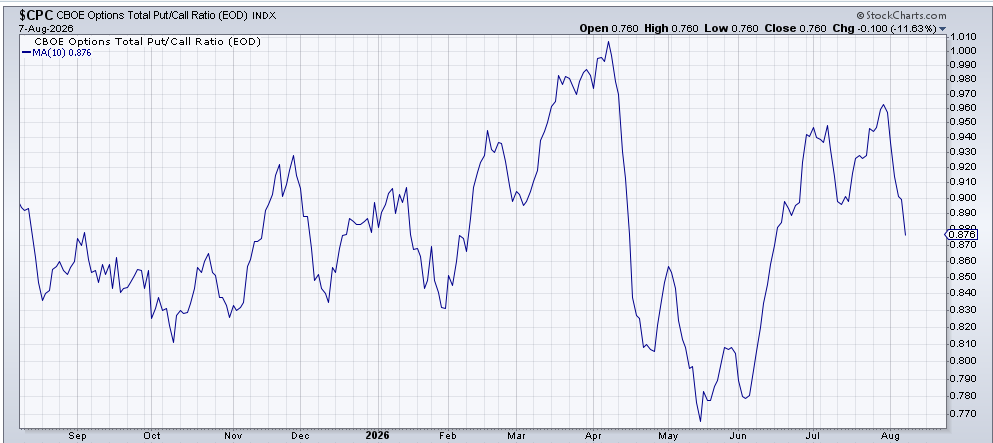
Then there is the ten-day moving average of the put/call ratio. It has not yet collapsed, although it is heading that way. In the last two weeks, it has gone from .96 to .87. My expectation is that by the end of this week, it will be back in the low 80s.
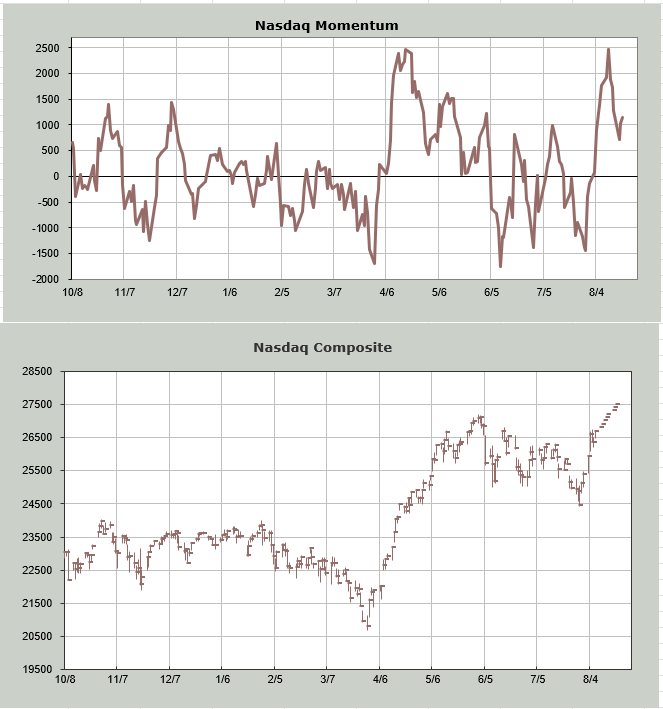
So naturally, I then look toward the Nasdaq Momentum Indicator and plug in higher closes for Nasdaq, taking it up another thousand points over the next week or so. No matter how I massage the numbers, this indicator peaks midweek (gets overbought) this week. Remember, this is not meant to find the exact day/date, but the general time frame, which I would say is this week.
Then there is the DSI for the VIX. It remained at 17 on Friday, unchanged from Thursday’s reading. If this gets to 15 or under, then I would say it portends a decent bout of volatility should come our way. At 17, we’re knocking on the door.
So midweek the market gets short-term overbought, and it’s possible the Investors Intelligence survey—out on Wednesday—shows a high bull/bear ratio, and the VIX DSI is knocking on the door to ‘too low’. And maybe the ten-day moving average of the put/call ratio even falls to the low 80s. I will be on the lookout for that setup.
New Ideas
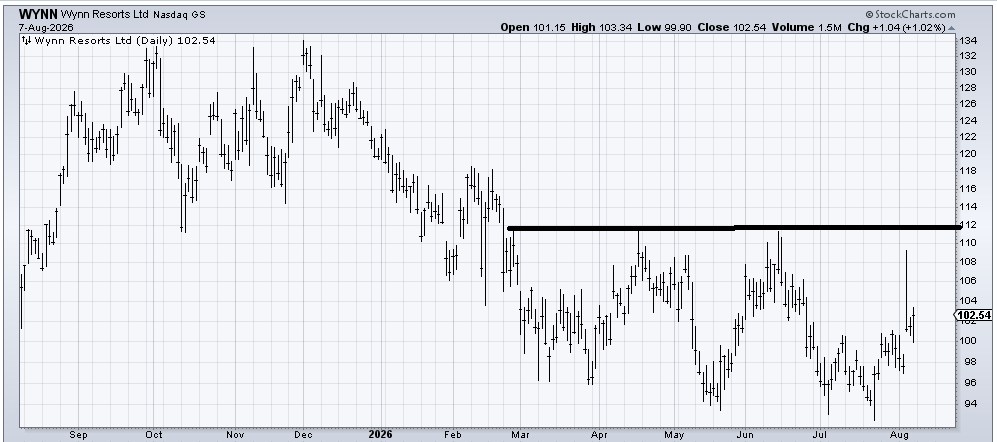
I recommended Wynn Resorts (WYNN) a few weeks ago, and it is up about five percent from then, but you can see the chart is still trying to base. It can pull back all the way to 98 and still be okay (gap fill), but I would prefer it stay over this 100 area. I still think the chart is improving.
Today’s Indicator
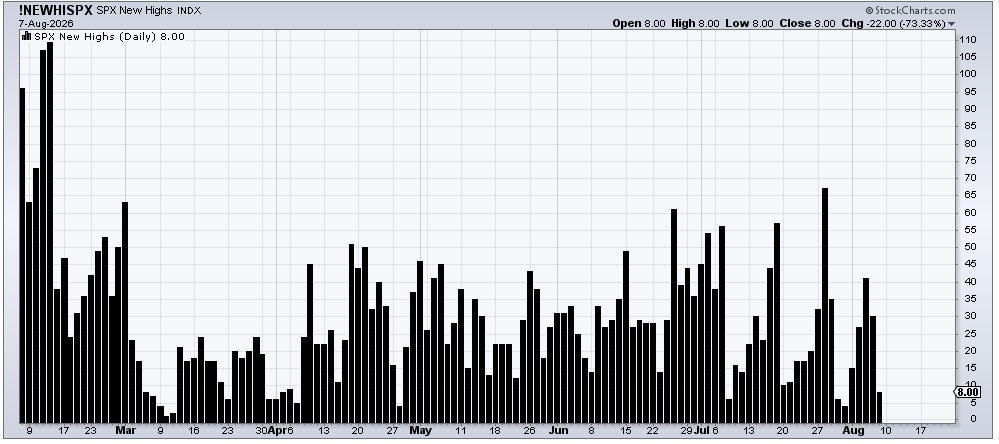
The S&P made a new high on Friday. Exactly eight members of the S&P made a new high, too. Pretty pathetic.
Q&A/Reader’s Feedback
Helene welcomes your questions about Top Stocks and her charting strategy and techniques. Please send an email directly to Helene with your questions. However, please remember that TheStreet.com Top Stocks is not intended to provide personalized investment advice. Email Helene here.
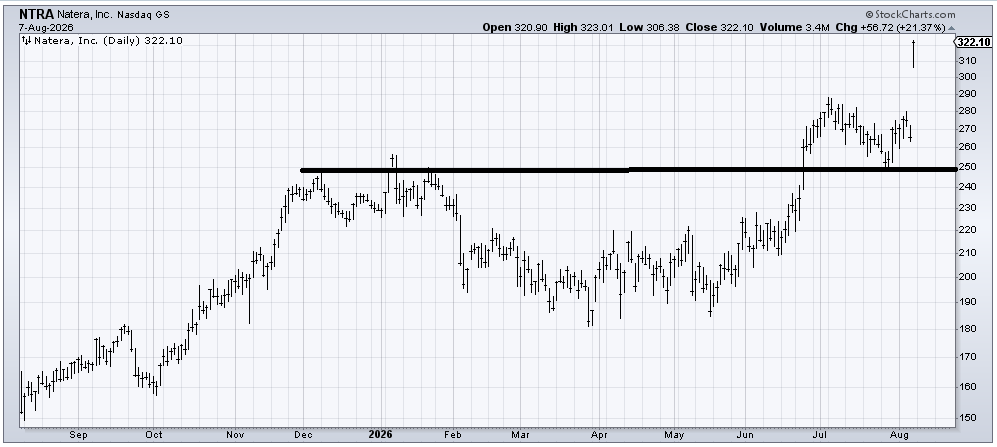
I am never going to like a chart like Natera (NTRA) because I am a bottom fisher, not a chaser. And while the stock has done nothing wrong, there is a measured target in the 315-335 area, so it’s already into the target zone. I’d lean toward taking a little something off the table and using a trailing stop.
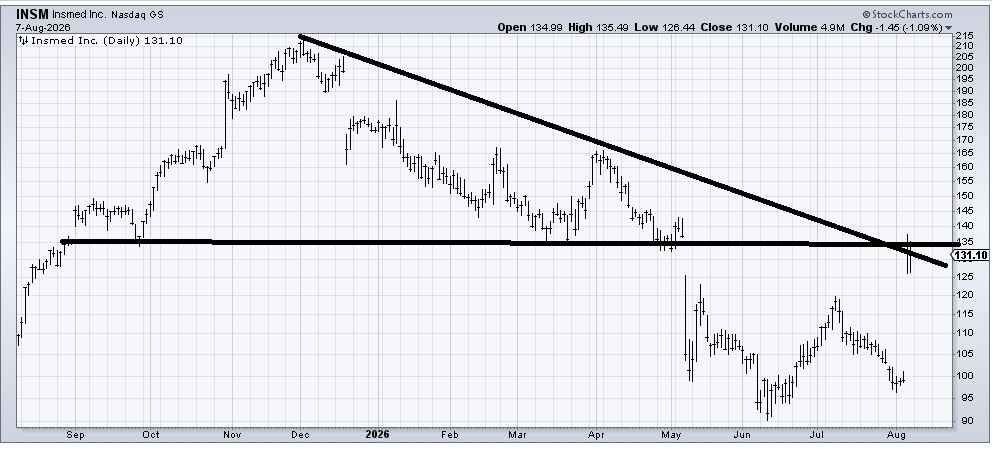
Insmed (INSM) had news that popped it the other day, so again, I am a terrible chaser. If the stock can push up over this 135 (where there is a lot of resistance), then it ought to be okay, but there is much resistance to chew through.
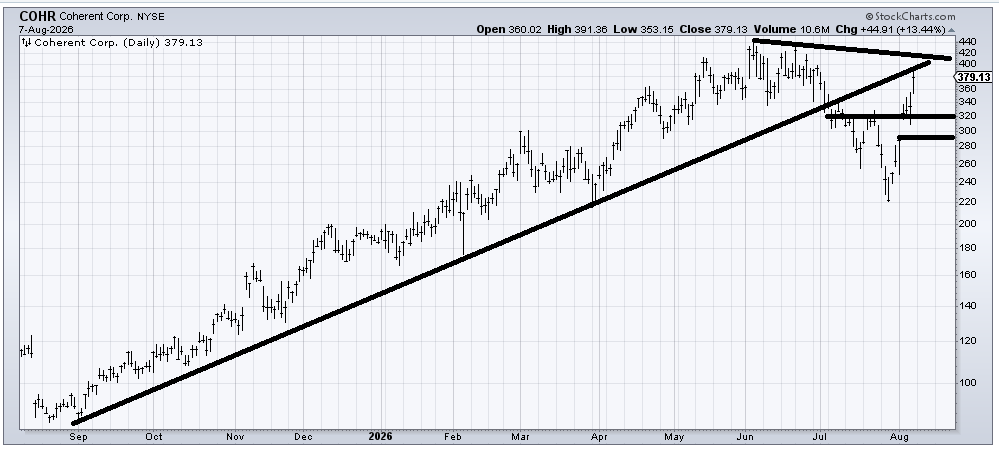
Coherent (COHR) has earnings out this week, so it’s a gamble. It is up against resistance, so let’s say it drops on earnings. I’d say if it drops and stays over 290, it’s probably a buy for a trade.
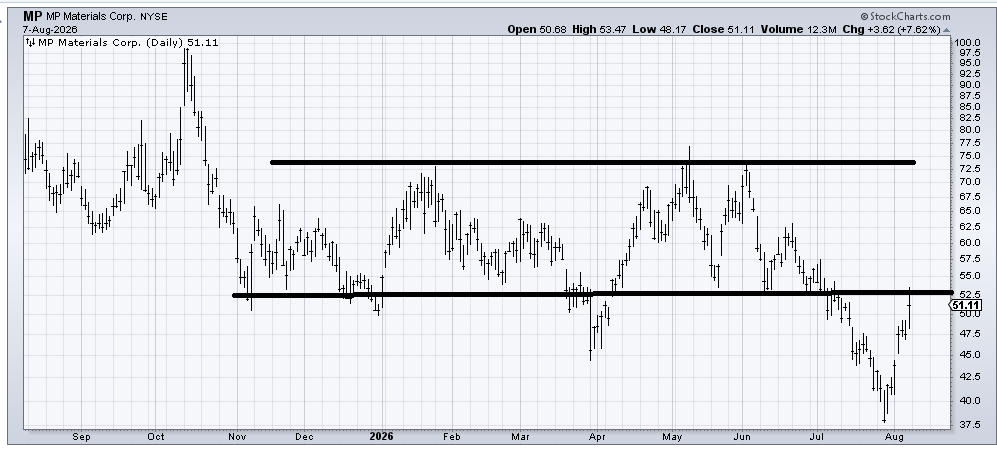
Just a few months ago, I thought MP Materials (MP) was building a base. I was very wrong as the stock dropped out of that base, falling an additional thirty percent. Now it is trying to get back into the base. Let’s say it does get over 55, there is still a lot to eat through for it to make much headway.
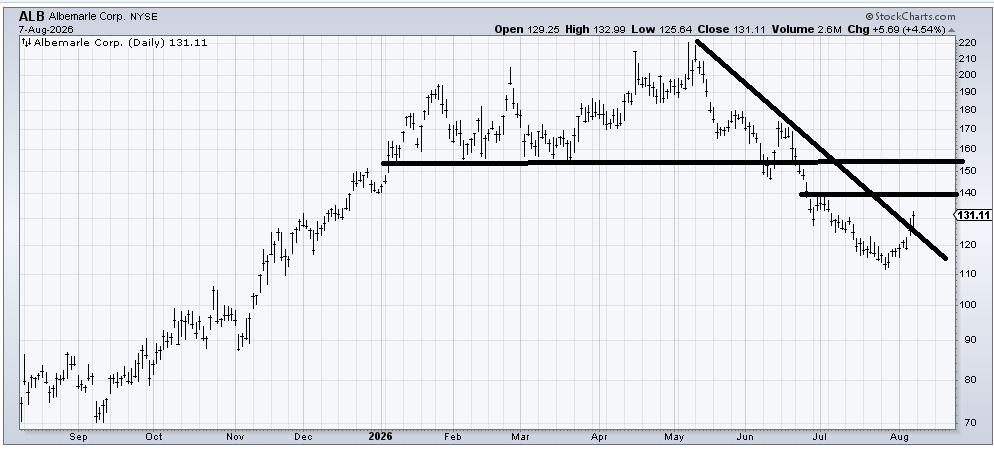
Albermarle (ALB) is trying to bottom. I suspect it gets to that resistance around 140 and maybe even near 150. But it runs out of steam there.
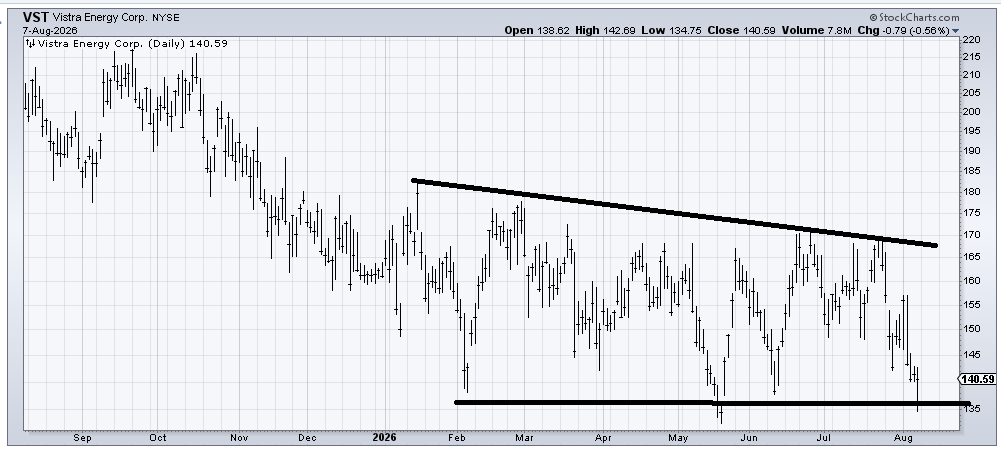
Vistra Energy (VST) must be so over-owned because I think I get asked about it at least once a week. It is oversold enough to bounce, but know that each time it bangs away at the support at 135, it weakens it. If the best the stock can do is rally to that 145 area and then turn back down, I’d get concerned.
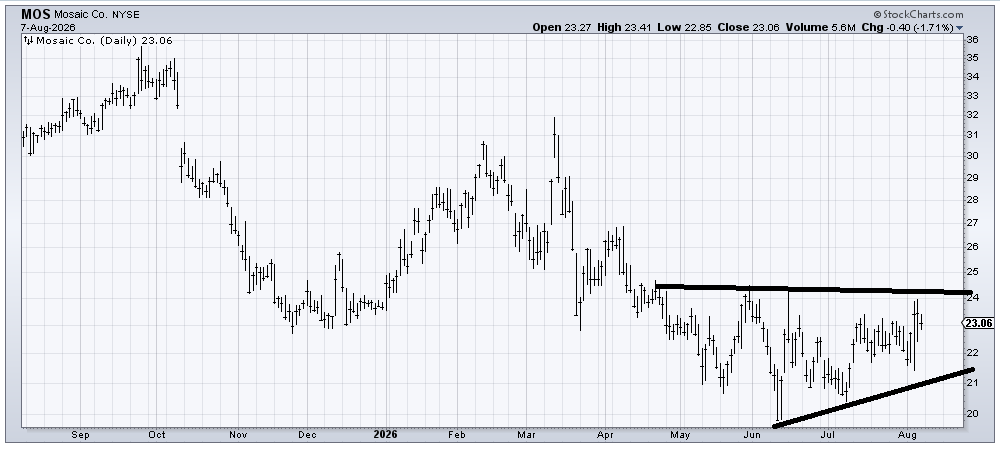
Mosaic (MOS) is one of those charts that sucks me in every time it starts doing this rounding under action as it has now. It did it in September last year, and it did it again in February of this year. With that as background, the stock needs to get over 24 as a first step because it hasn’t made a higher high in months, and it needs to do that to begin the process. It would not be out of the woods even if it crosses 24, but at least it would change the pattern. A stop under 20/21 is in order.
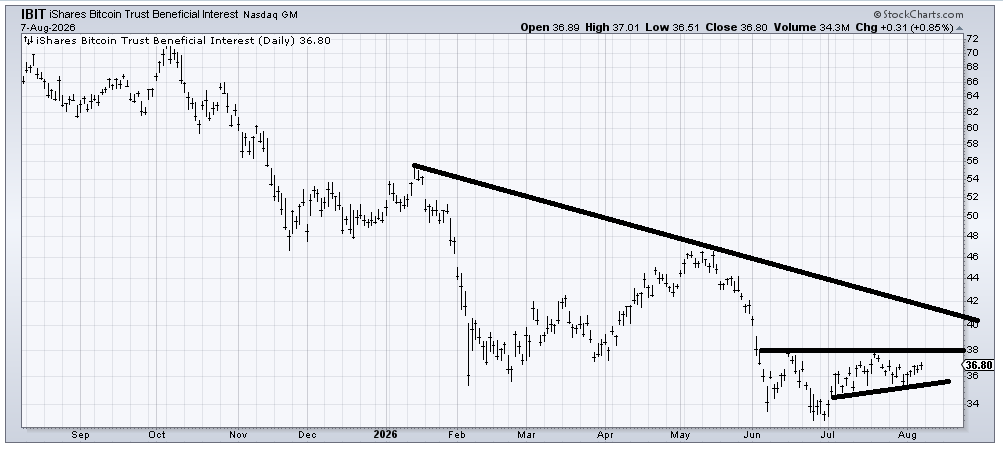
I want to like IBIT (IBIT), an ETF to be long Bitcoin (even though I think BTC is a scam). The reason is that BTC’s DSI is 17, so if it gets much weaker than this, I think the DSI will get under 15 and at least provide a trading opportunity. So a break of 35 could give it a bullish DSI.