Is it Time to Throw in the Towel on This Top Stock Pick?
Metal and mining company Vale SA is facing a pivotal close as it has struggled to meet expectations this year.
You've reached your free article limit
You've read 0 of 1 free Pro articles.
Vale SA VALE is a metal and mining company. It produces and exports iron ore and pellets, nickel, manganese ore, copper, ferroalloys, metallurgical and thermal coal, copper and cobalt.
It was one of my top recommendations for this year, so let's check out the charts and indicators of VALE.
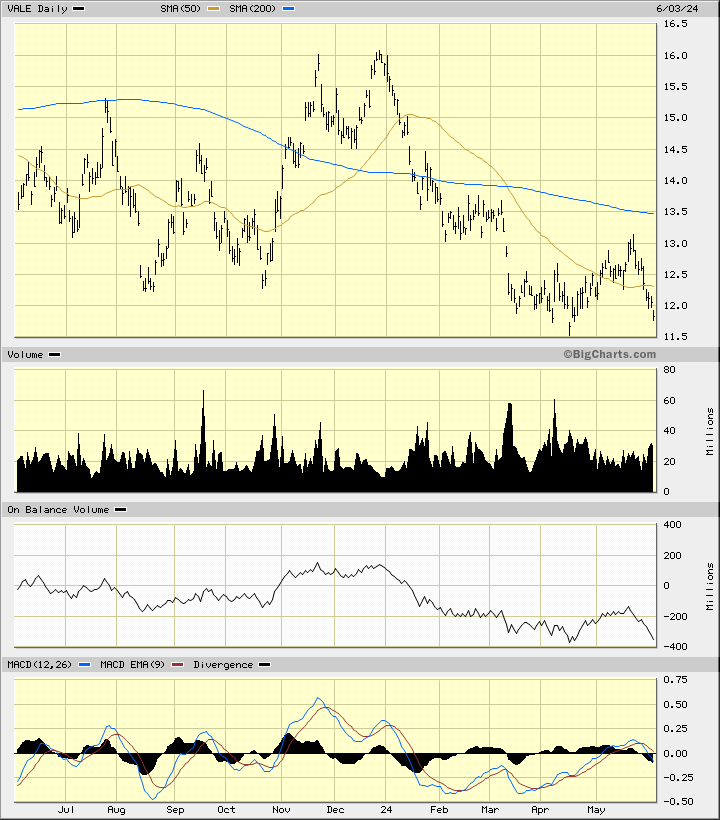
In this daily bar chart of VALE below, I can see several dips into the $12.50-$12.00 area and more recently dips into the $12.00-$11.50 area. Trading volume has been more active in the past three months and suggests we are seeing increased investor interest. The On-Balance-Volume (OBV) line made a low in April and another low, hopefully, in late May. The Moving Average Convergence Divergence (MACD) oscillator is now testing the zero line.
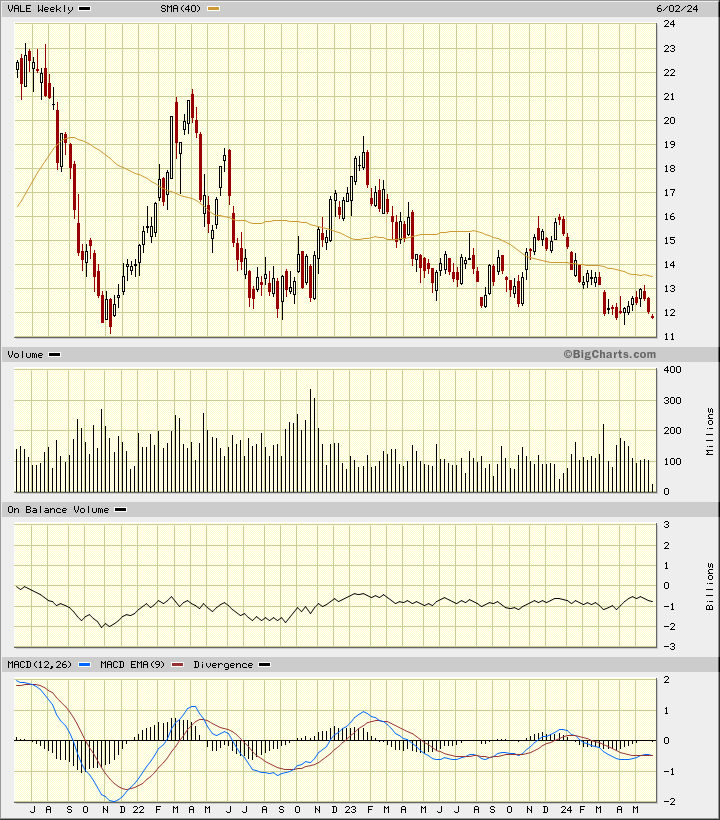
In this weekly Japanese candlestick chart of VALE, I can see a bigger picture of the price action. Going back three years, I can see how dips to the $12-$11 area have been bought. Prices trade below the declining 40-week moving average line and the highs have been weaker and weaker. By itself, this pattern suggests a major downside breakdown but the weekly OBV line has been steady for the past three years and the MACD oscillator has been making higher lows for a while now. VALE has had plenty of opportunities to break down but it hasn't. Is an upside move coming?
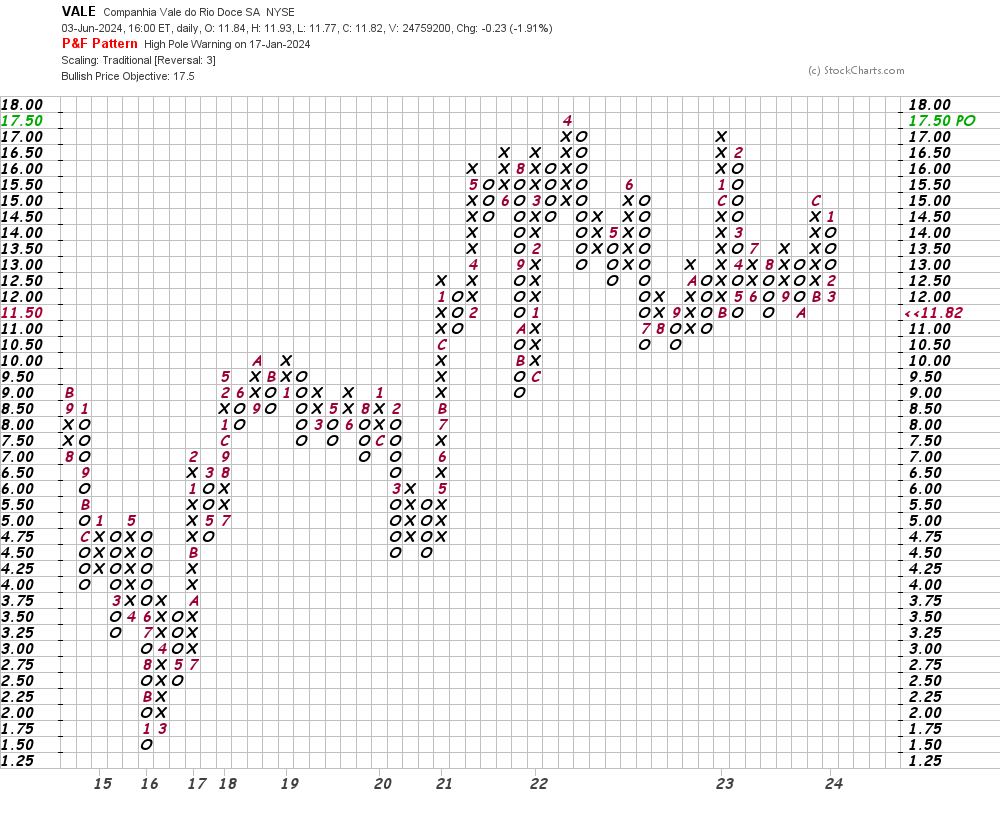
In this daily Point and Figure chart of VALE below, I can see an upside price target in the $18 area.
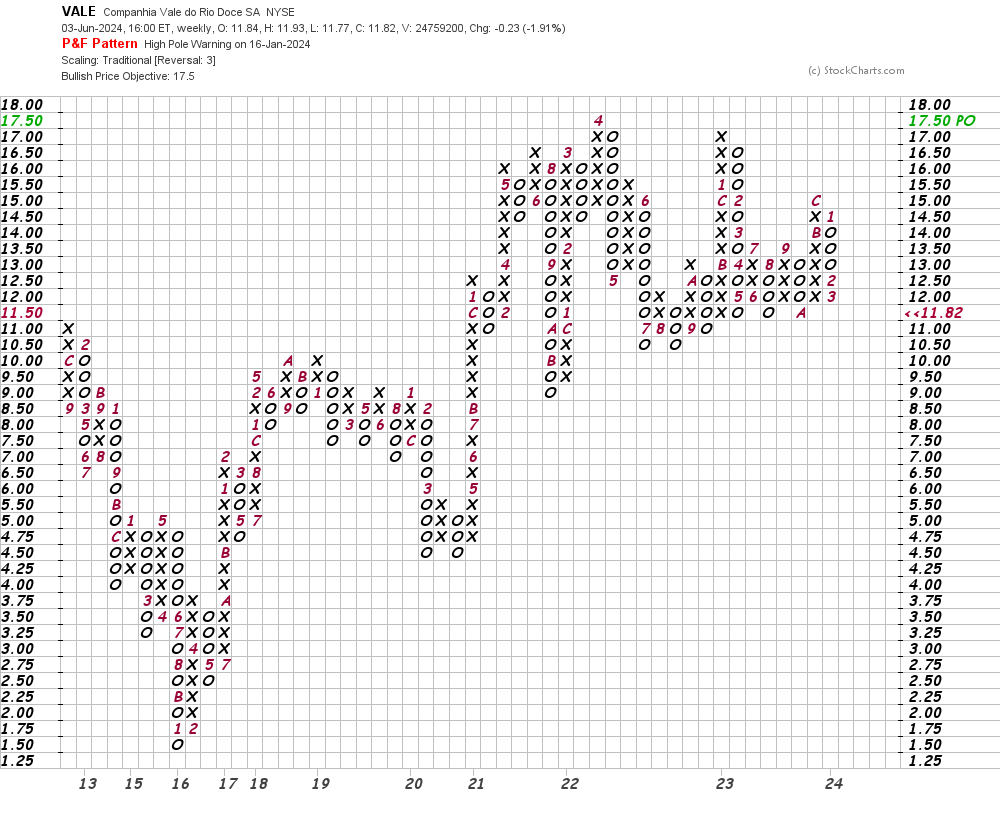
In this weekly Point and Figure chart of VALE, below, I can see the same $18 price target as the daily chart above. A trade at $11 could weaken this picture. A trade at $15.50 should strengthen the picture.
Bottom line strategy: VALE has struggled and I am disappointed after marking it as a top recommendation, but I'm not yet convinced that we should throw in the towel. A close above $13 will go a long way to improving the technical outlook.
Employees of TheStreet are prohibited from trading individual securities.