These 2 Mining Stocks Are My Top Recommendations for 2024
I continue to anticipate much higher prices for gold and eventually a strong rally in these shares.
You've reached your free article limit
You've read 0 of 1 free Pro articles.
In early 2023 I recommended Hecla Mining HL as my "top pick" for 2023 and probably 2024. While the performance of this mining company has been disappointing, I continue to anticipate much higher prices for gold and eventually a strong rally in the shares of HL.
Another mining name that I have recommended is Vale S.A. VALE .
Let's check out the charts and indicators.
Hecla Mining
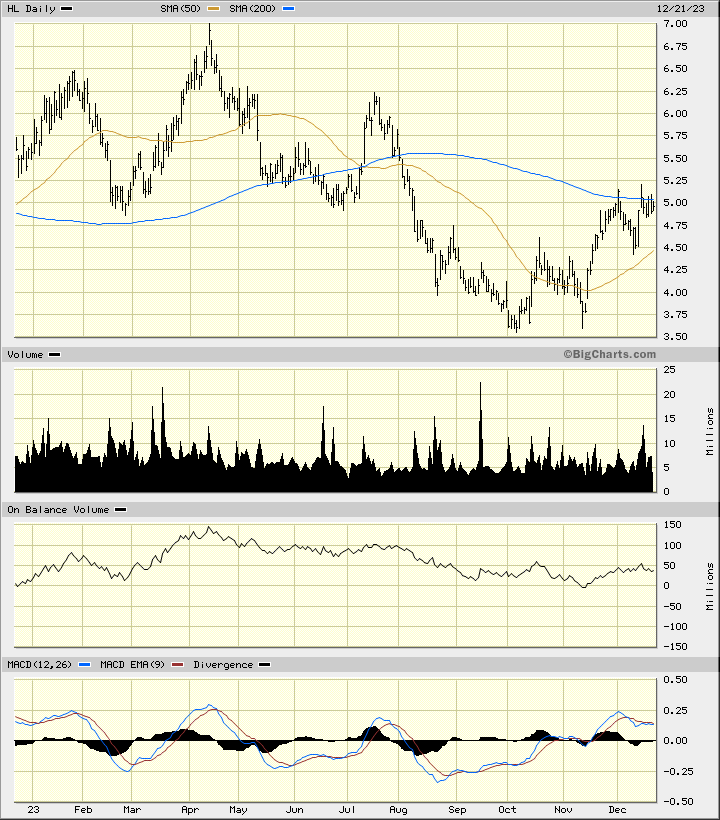
In this daily bar chart of HL, below, I can see that prices worked lower into early October. Prices bounced to the upside and made a retest of the October low in November before the rally got going, so to speak. Prices now trade above the rising 50-day moving average line as they test (and hopefully break above) the 200-day moving average line.
The daily On-Balance-Volume (OBV) line has improved slightly from a low in October. The Moving Average Convergence Divergence (MACD) oscillator is above the zero line and poised to turn higher.
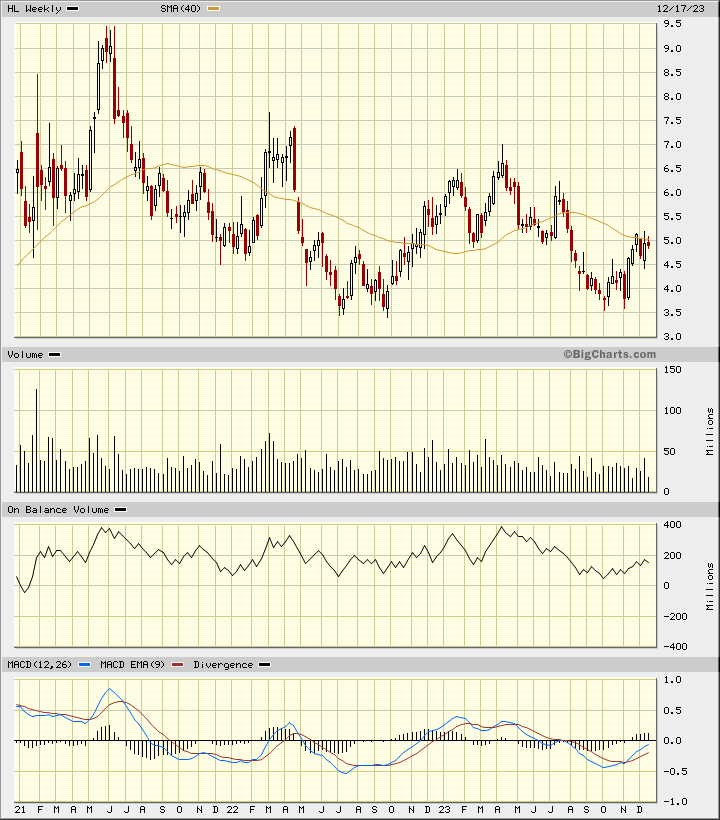
In this weekly Japanese candlestick chart of HL, below, I can see that prices are close to breaking a long-term downtrend line (not drawn) around the $5.75 area. The $3.50 area is major support.
The weekly OBV line has improved in the past three months. The MACD oscillator has crossed to the upside for a cover shorts buy signal and is not far below the zero line.
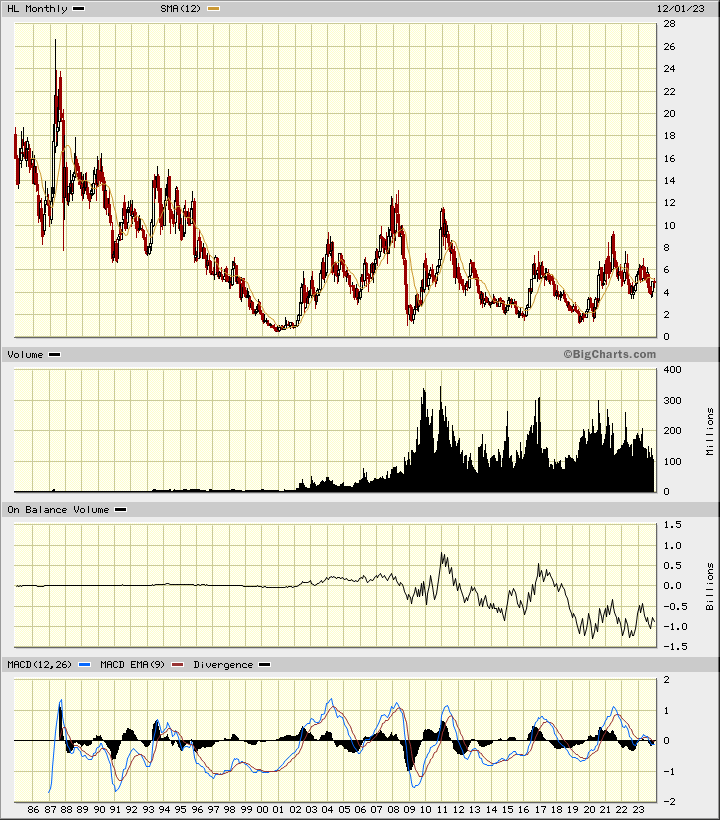
In this monthly candlestick chart of HL, below, I can see a 23-year base pattern. A close above the $12-$13 area will be a major breakout from a major bottom pattern.
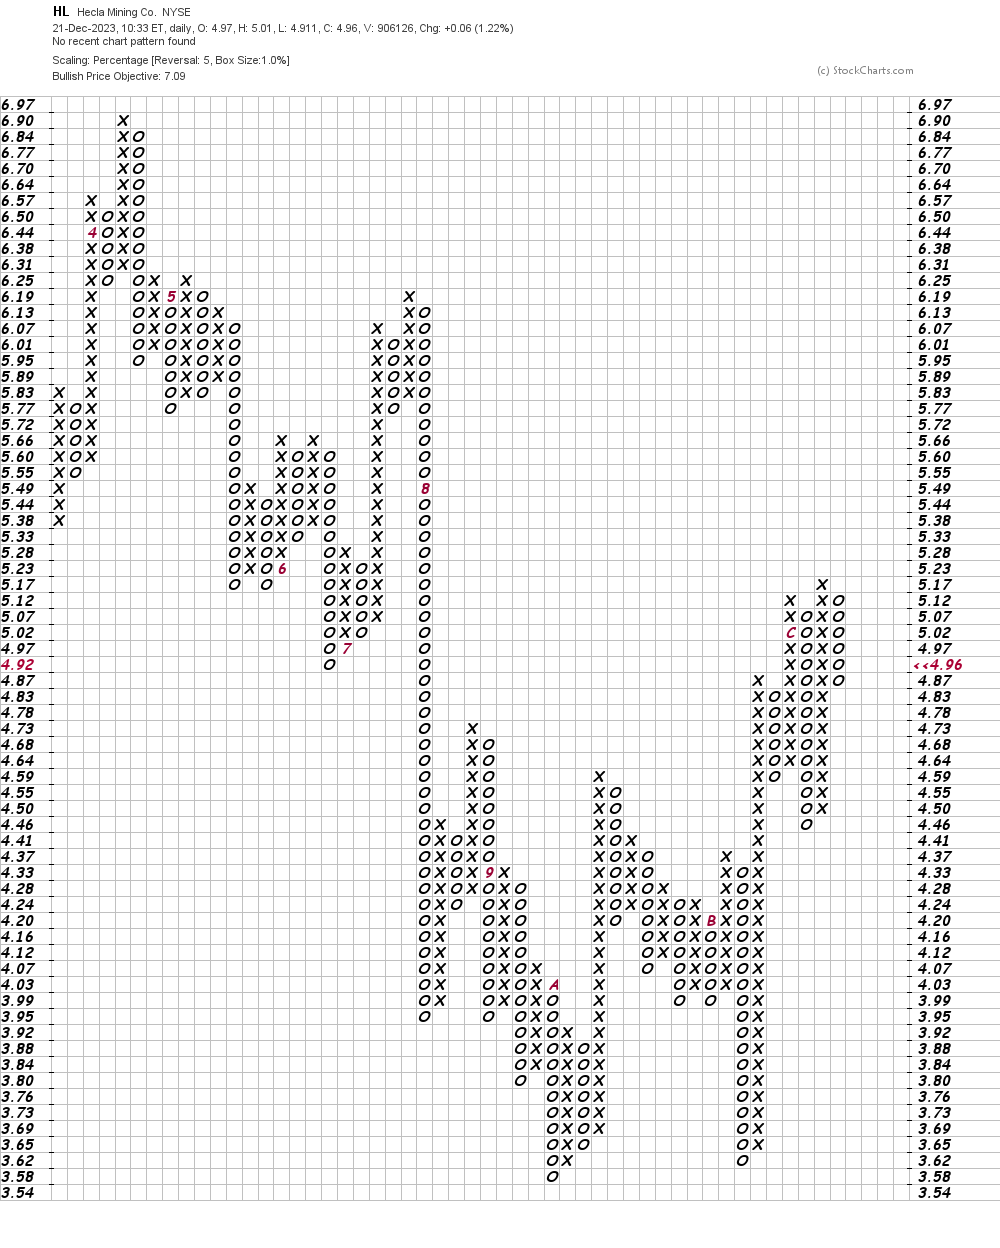
In this daily Point and Figure chart of HL, below, I can see a price target in the $7 area using a five box reversal filter.
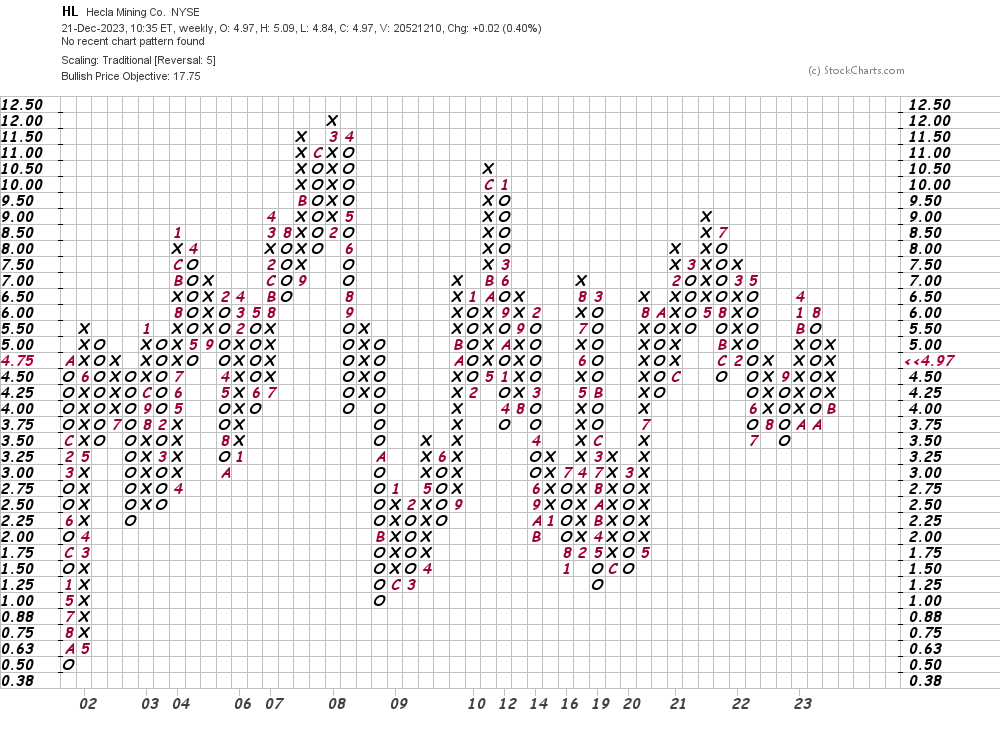
In this weekly Point and Figure chart of HL, below, I also used a five box reversal filter. Here the price target becomes $18.
Vale
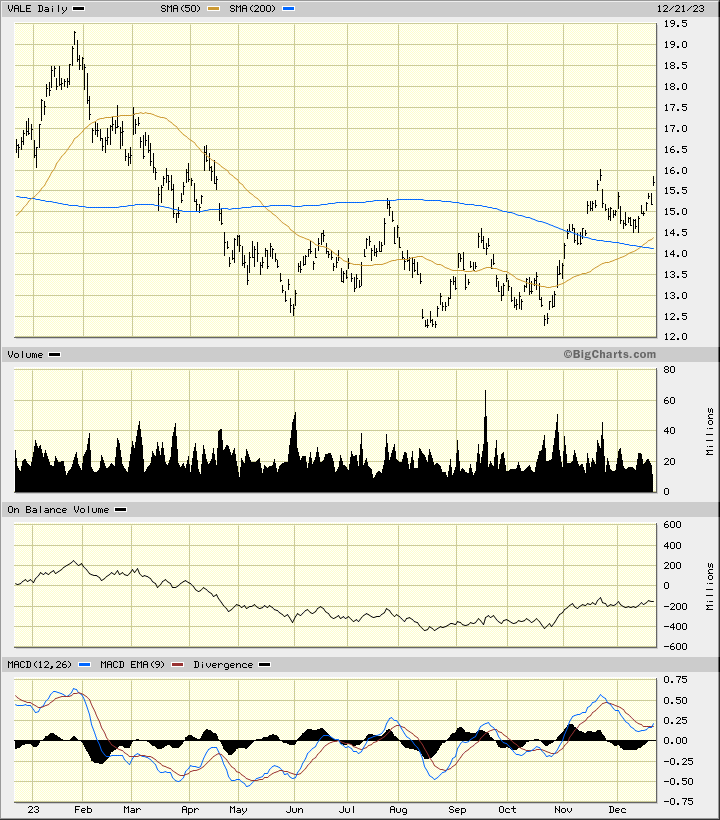
In this daily bar chart of VALE, below, I see a "triple bottom" pattern with buyers of VALE showing up in the $12.50-$12.00 area. Prices trade above the 50-day and 200-day moving average lines. The 50-day line just crossed above the 200-day line for a bullish golden cross.
The daily OBV line has been improving since August. The MACD oscillator is above the zero line and poised for a fresh buy signal.
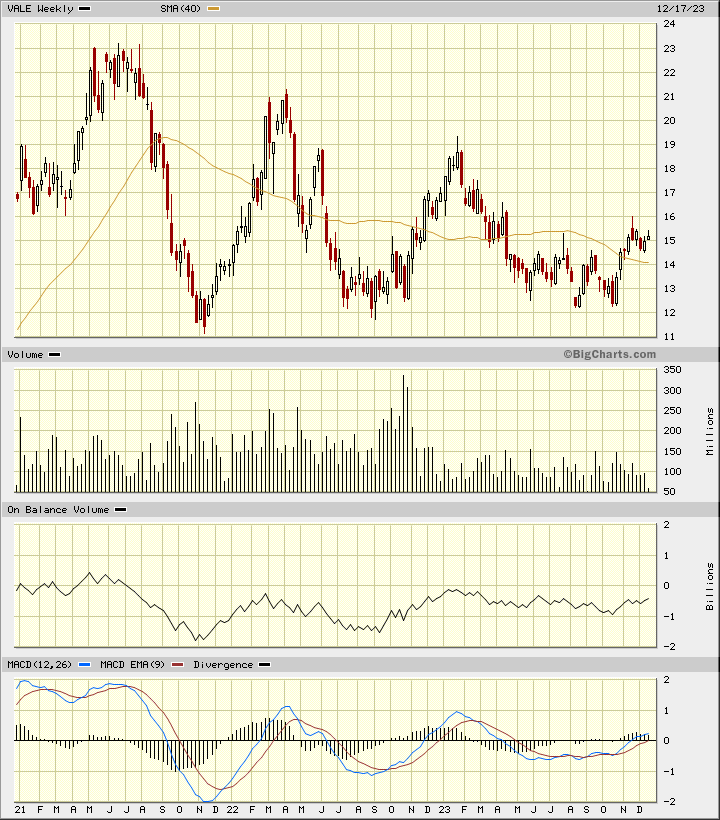
In this weekly Japanese candlestick chart of VALE, below, I can see that prices have made lower highs for several years. A strong close above $16.50 should break the downtrend. Every decline below $13 has been bought.
The weekly OBV line shows us higher lows the past two years. The MACD oscillator is now moving above the zero line for an outright buy signal.
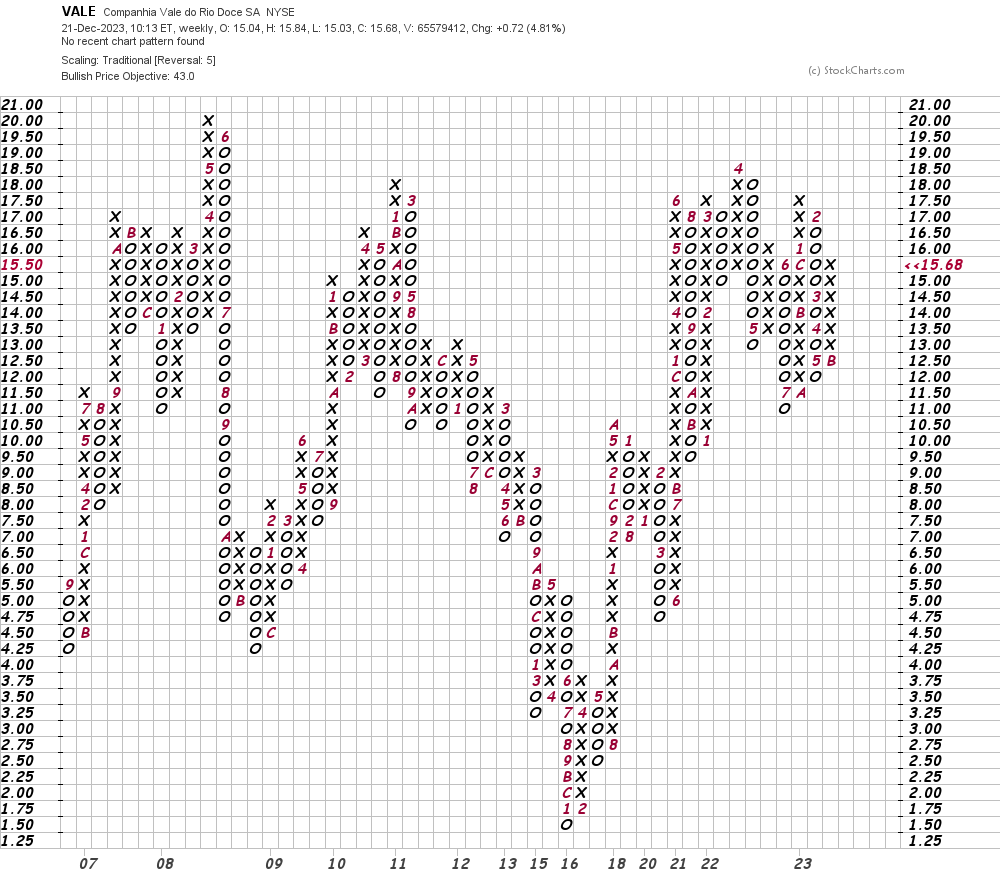
In this Point and Figure chart of VALE, below, I used weekly price data with a five box reversal filter. Here the chart suggests a price target in the $43 area and if you add in the hefty dividend that VALE pays and you could have a really great total return opportunity.
Bottom-Line Strategy
HL and VALE are just two names I think will do well in 2024, but in practice I am sure other winners will be found as the year unfolds.
Employees of TheStreet are prohibited from trading individual securities.