Toyota Is Still Putting the Pedal to the Metal
The stock has been in a major advance for a long time and could see gains that are multiples of one key price level.
You've reached your free article limit
You've read 0 of 1 free Pro articles.
In my January 10 update on Toyota Motor (TM) I wrote that "TM looks ready for an upside breakout. Traders could go long TM or add to TM longs on strength above $196. The $225 area is my next target. Risk to $176 now."
Now that TM trades around $244 a refresh look at the charts is needed along with new targets and stop recommendations.
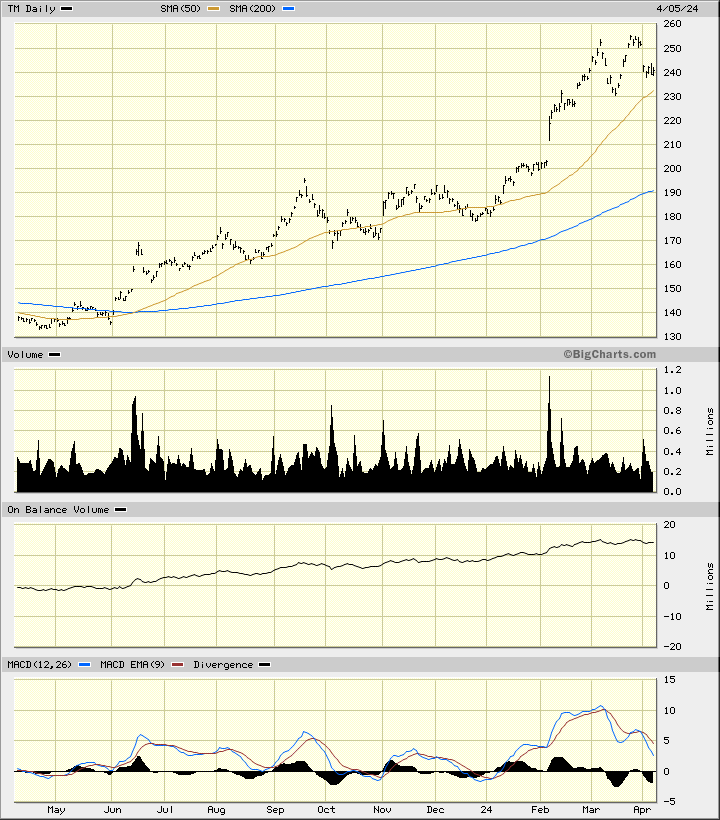
In the updated daily bar chart of TM, below, I can see that share prices have made a new consolidation pattern after reaching my $225 price objective. The past five weeks of sideways movement gives time for traders to adjust their positions — doing some profit-taking on rallies and adding to longs on dips. TM trades above the rising 50-day moving average line and above the rising 200-day line.
The On-Balance-Volume (OBV) line shows a positive trend the past year and only a sideways move the past month. The Moving Average Convergence Divergence (MACD) oscillator is still above the zero line but has been correcting lower since early March.
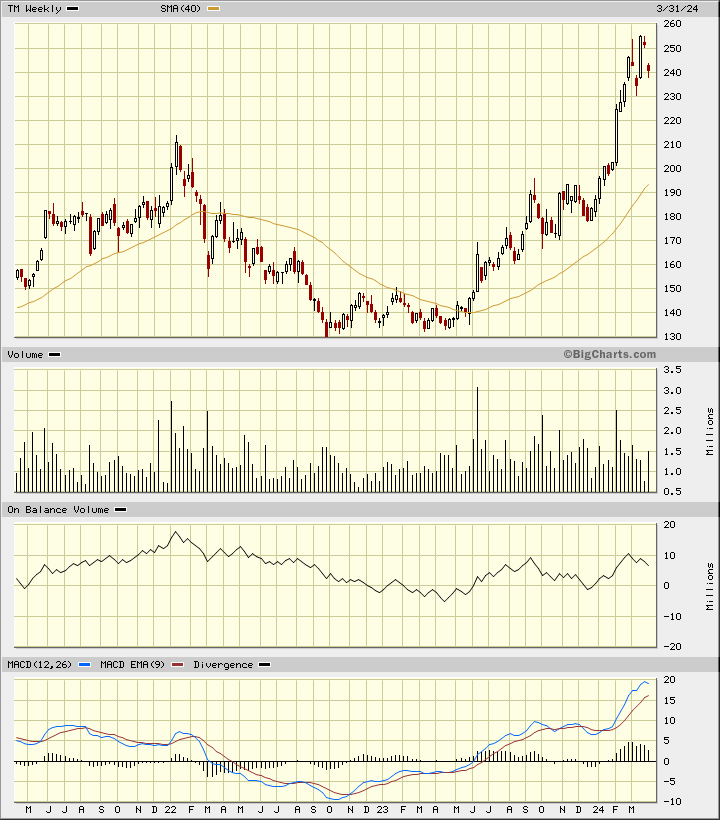
In the weekly Japanese candlestick chart of TM, below, I can see that the shares formed a large saucer bottom and made an upside breakout. TM trades above the rising 40-week moving average line. The weekly trading volume histogram has been more active since May and tells me that investors are showing more interest.
The weekly OBV line has not confirmed the price gains in the past two months and that is a disappointment. The MACD oscillator is well above the zero line but has been narrowing recently. The weekly candle patterns show me a mixed story.
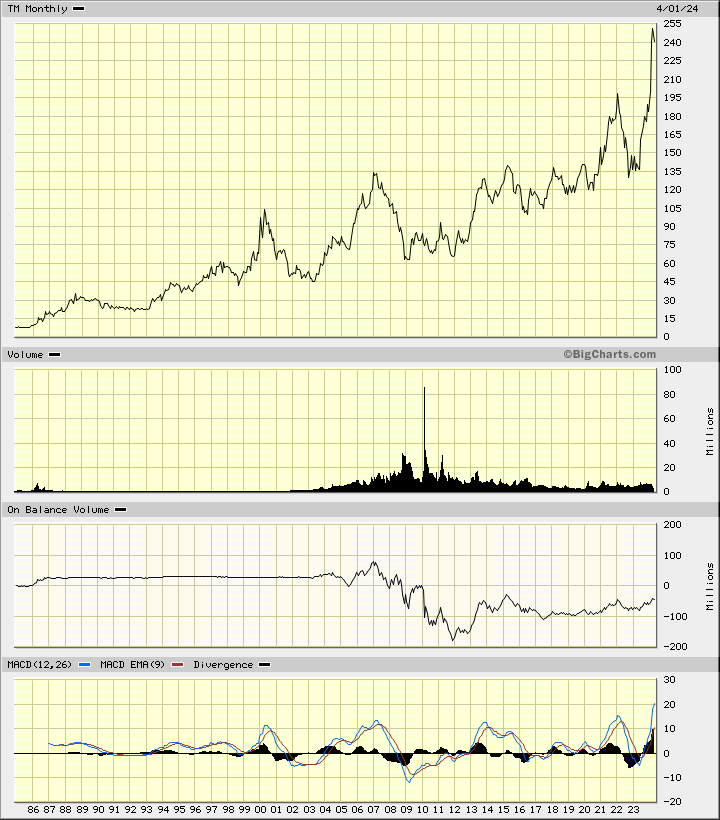
In this monthly line chart of TM, below, I can see that the stock has been in a major advance for a long time. We could see gains to the upside that are multiples of the $135 level. The $270 area could be the next price target.
In this daily Point and Figure chart of TM, below, I can see a price target in the $401 area.
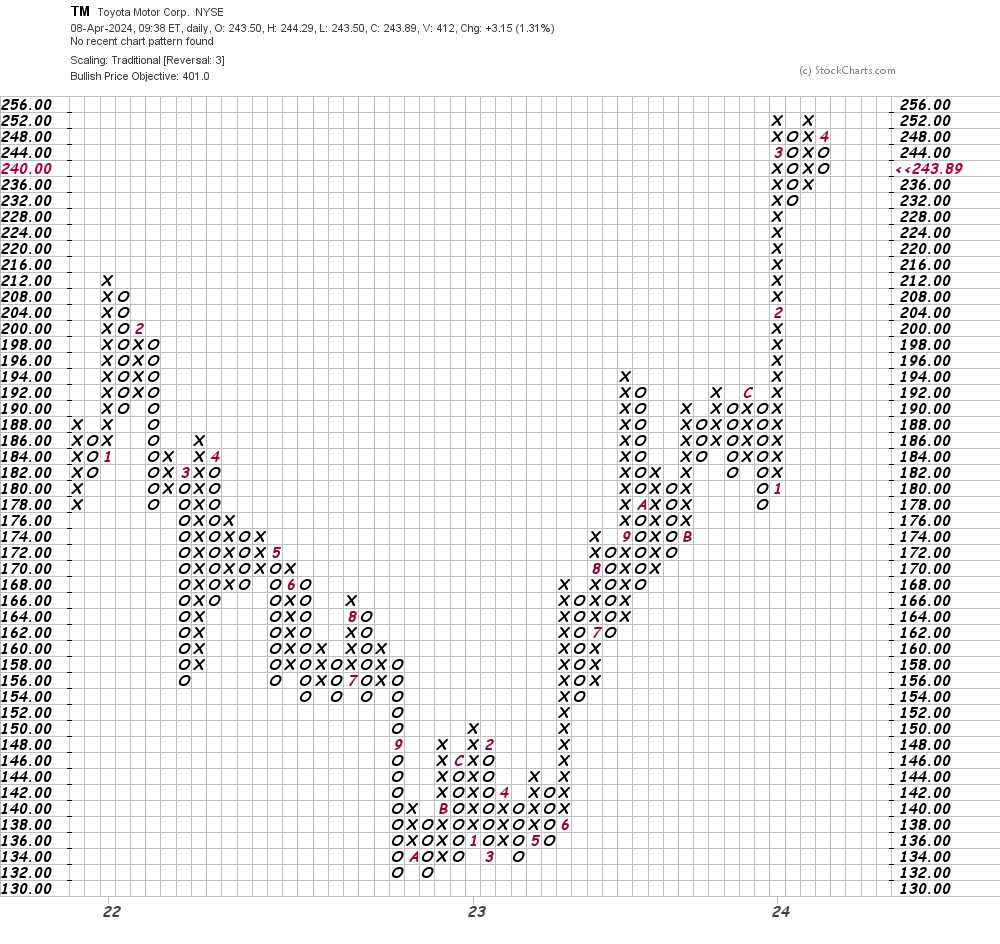
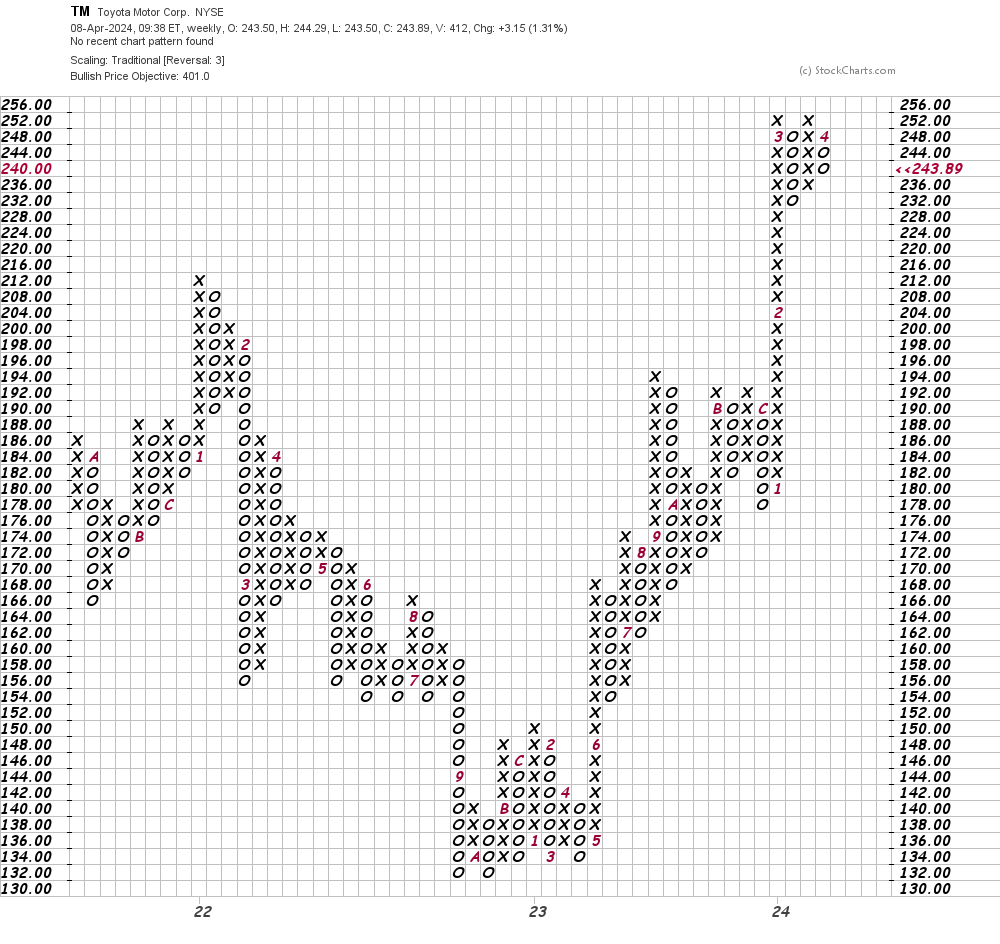
In this weekly Point and Figure chart of TM, below, I can see the same $401 price target as the daily chart above.
Bottom-line strategy: Traders who are long TM from earlier recommendations should continue to hold those positions. Raise stops to $220 to lock in gains. The $270 area is my next price target.
Employees of TheStreet are prohibited from trading individual securities.