Toyota Is Poised for an Upside Breakout: Here's How to Play It
These price levels are key for traders.
You've reached your free article limit
You've read 0 of 1 free Pro articles.
Last June I recommended the purchase of Toyota MotorTM where I wrote that "Traders could go long TM at current levels and add to longs on a move above $150. Risk below $140 for now. My first target is $165 for now but TM could be a big long-term investment if they dominate the EV market in the years ahead. You never know."
The shares reached my $165 price target fairly quickly and have continued to advance.
Let's check out the charts of TM again.
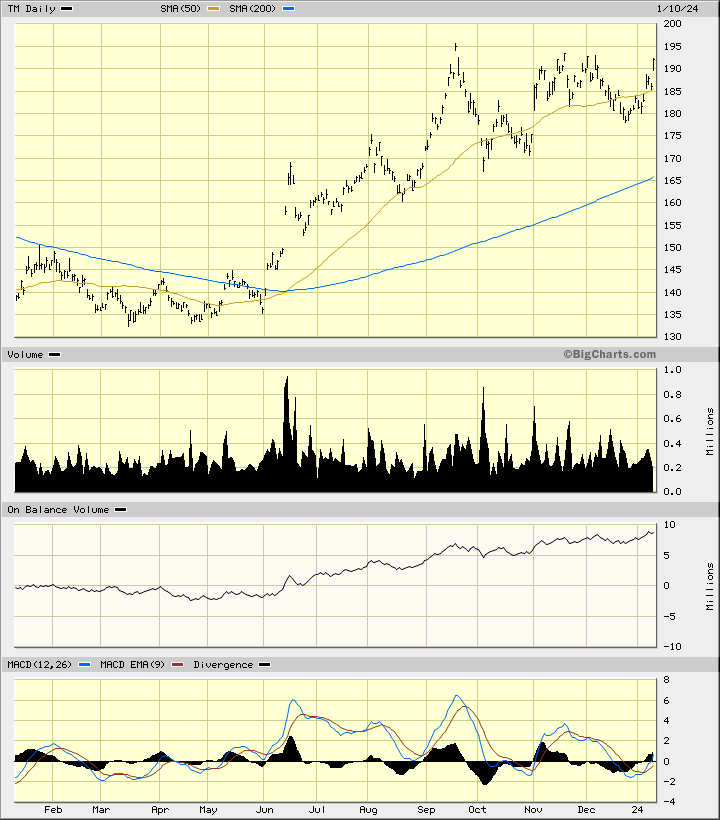
In this daily bar chart of TM, below, I can see that the shares surged to $195 before correcting lower into October. TM recovered with the broader market and has formed what chartists call a bullish or ascending triangle formation. You can see equal highs roughly around $195 and higher lows from October to December. TM trades above the rising 50-day line and the bullish 200-day line.
The On-Balance-Volume (OBV) line has been strong the past year and tells us that buyers of TM have been more aggressive than sellers. The trend-following Moving Average Convergence Divergence (MACD) oscillator is trying to move back above the zero line for a fresh outright buy signal.
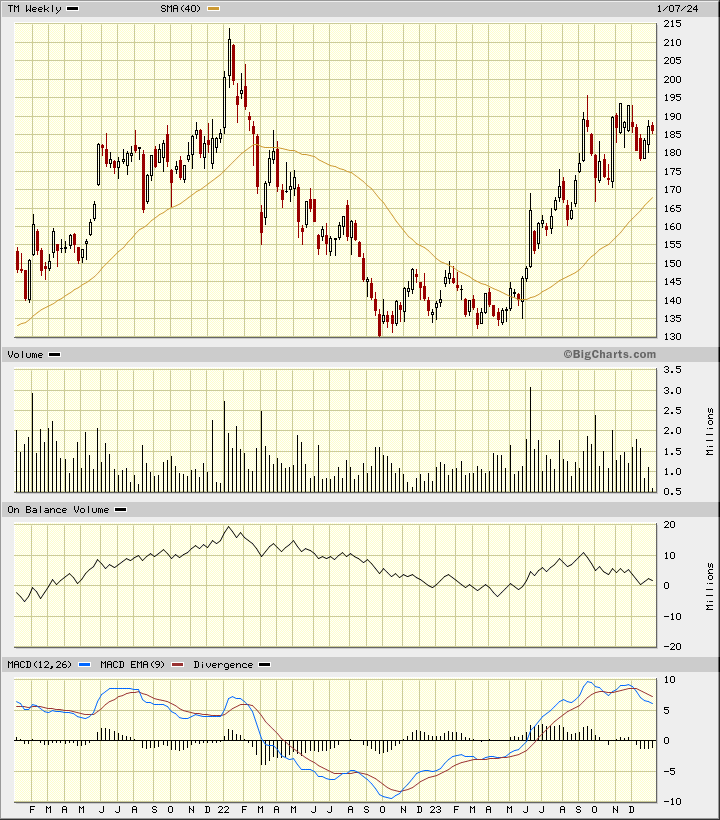
In the weekly Japanese candlestick chart of TM, below, I can see that the shares have formed a triangle pattern the past four months. Prices have traded in a tighter and tighter range and look ready for an upside breakout.
The weekly trading volume has declined and the OBV line has weakened -- this is not uncommon for triangles. The MACD oscillator is above the zero line but has been correcting the past three months.
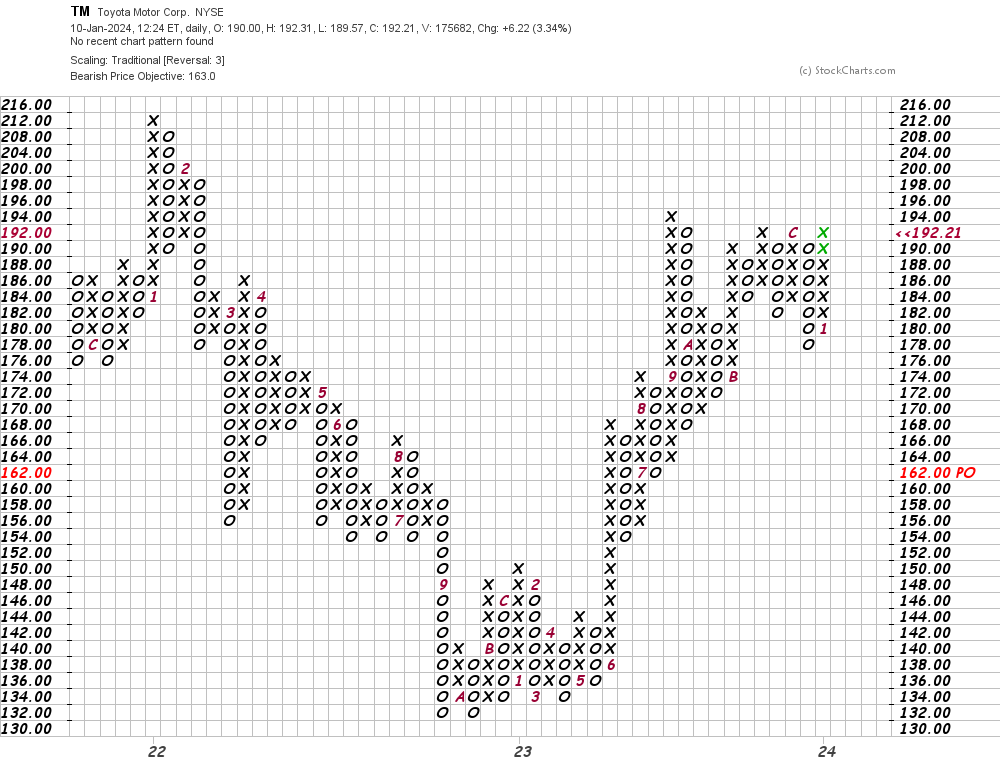
In this daily Point and Figure chart of TM, below, I can see a possible downside price target in the $162 area. A trade at $196 will be a new high for the move up and should refresh the uptrend. This would be a breakout.
In this weekly Point and Figure chart of TM, below, I used close-only prices. Here the chart suggests an upside target in the $225 area. A weekly close at $194 will be a breakout.
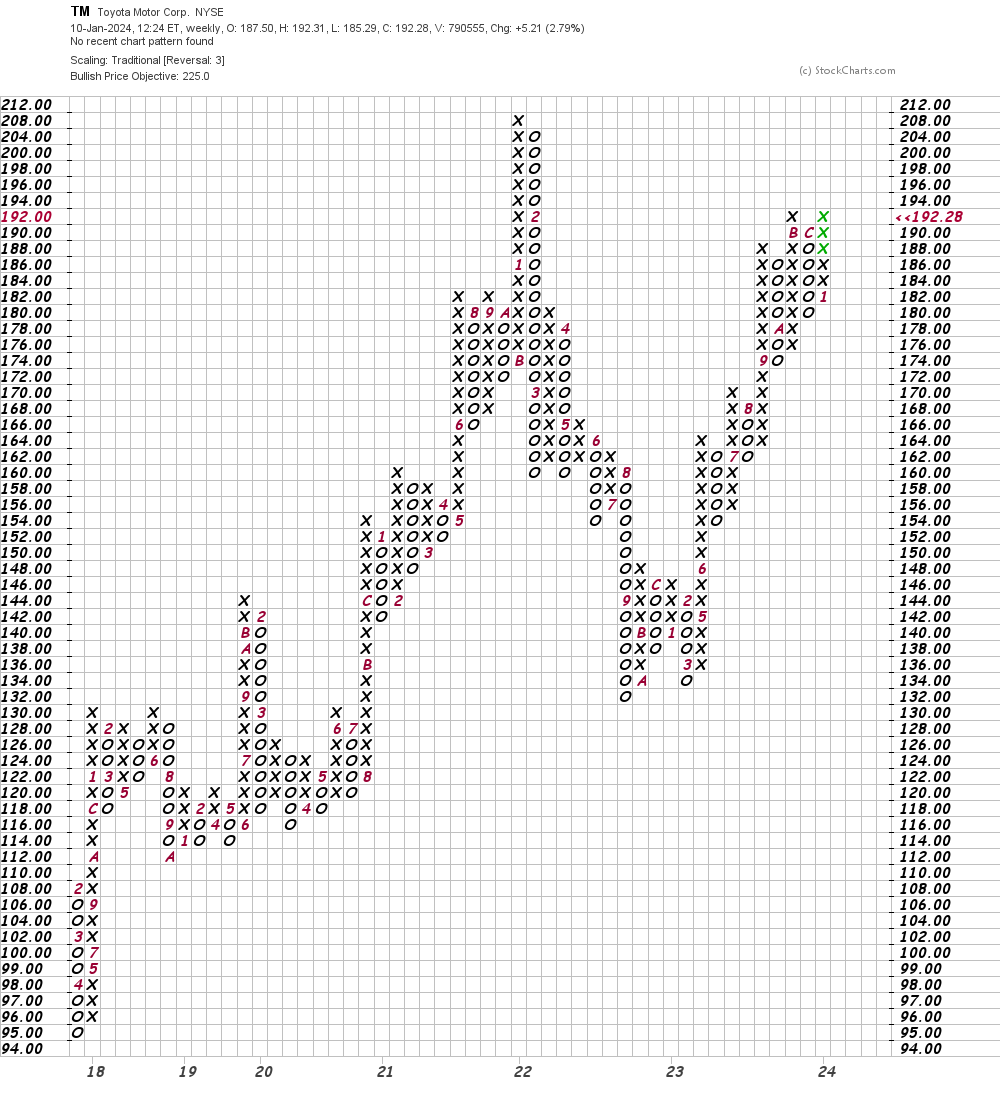
Bottom-line strategy: TM looks ready for an upside breakout. Traders could go long TM or add to TM longs on strength above $196. The $225 area is my next target. Risk to $176 now.
Employees of TheStreet are prohibited from trading individual securities.