Tuesday Had Something for Everyone
Ups, downs, and sideways. Plus, we'll look at IWM, TLT, SNOW, MNDY, SYNA, and WING.
You've reached your free article limit
You've read 0 of 1 free Pro articles.
The Market
Note: I will be a panelist on a Twitter (it will always be Twitter to me) Spaces on Wednesday morning at 11 am EST. If you would like to listen, here’s the link https://x.com/i/spaces/1BdxYEgjBABxX/peek
Today had something for everyone. If you wanted the S&P down, you got it. If you wanted the small caps up, you got that too. I would call today a wash.
IWM got up to the old highs (resistance) and failed up there. The S&P lost 45 points, and breadth was flat. Nasdaq was down pretty good, and down on volume that was the highest since August 5th (remember August 5th’s panic?) and yet the number of stocks making new lows did not expand.
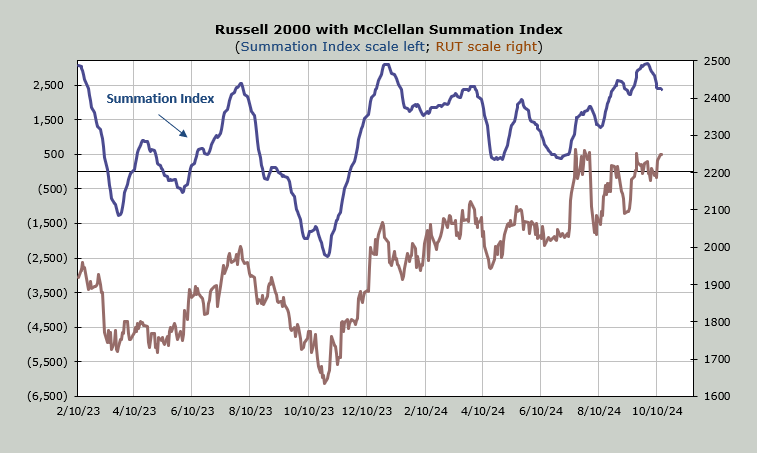
While breadth has improved in recent days, the McClellan Summation Index (shown below) is still heading down and needs a net differential of +700 advancers minus decliners to halt the decline. The chart is shown below.
What really caught my eye was the wild moves in individual stocks. And I’m not just talking about the semis. Take a look at something like Morgan Stanley or Citibank. Or from the other side of the fence, there is Johnson and Johnson and Bristol Myers. Just a lot of erratic trading overall.
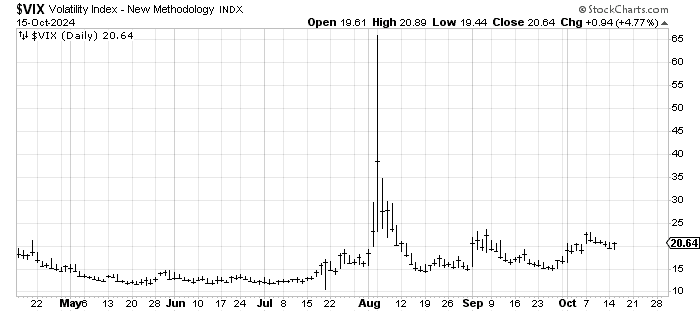
So, while the VIX only moved up marginally, individual stocks were quite volatile. And that chart of the VIX continues to make higher lows and look to me like we should get a bout of volatility. If this was a stock you’d call that a base. The DSI popped to 18.
New Ideas
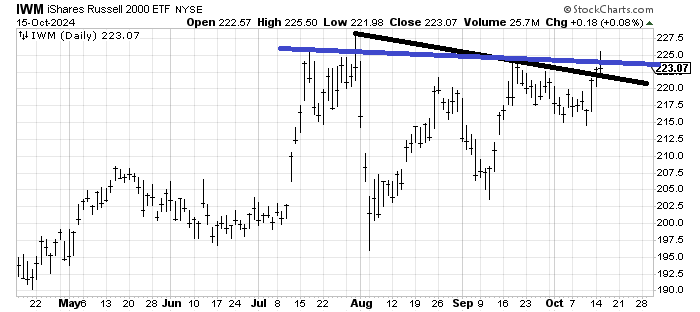
IWM has resistance (blue line) but it crossed that short-term downtrend line (black). If it can hold over 221-222 then I give it a chance to rally one more time.
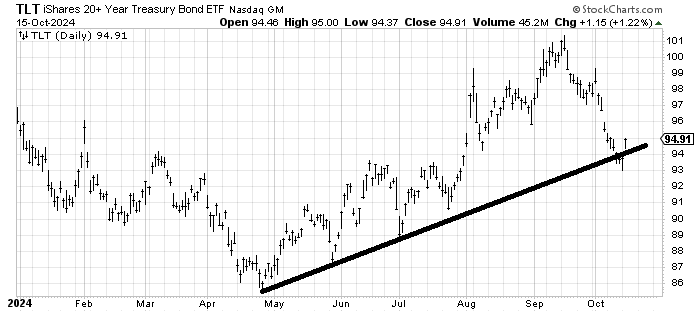
TLT finally moved up! Today was the first day since October 1st that it started the day on the upside. There is likely to be some backing and filling along the way but for now, I’m thinking that gap at 97 ought to get filled.
Today’s Indicator
The McClellan Summation Index is discussed in full above.
Q&A/Reader’s Feedback
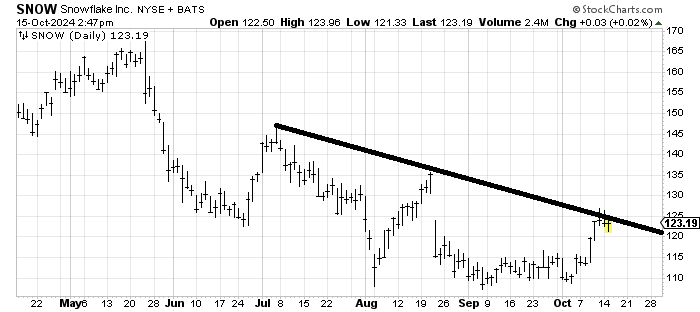
A few weeks ago when Snowflake SNOW was around 115, I said I thought it could/should rally to fill that gap around 130-ish. It has stopped at the downtrend line for now. My guess is as long as it stays over 120, it will go up and fill that gap but under 120 and I am wrong.
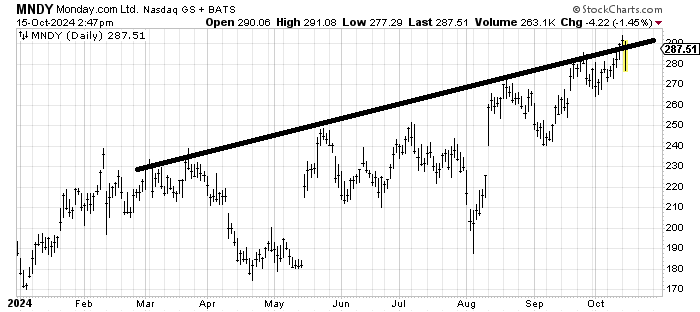
Monday.com MNDY is at a measured target (290-300) and has that resistance line to contend with. The chart is not bearish but it says to me on a trading basis, I’d take some profits here.
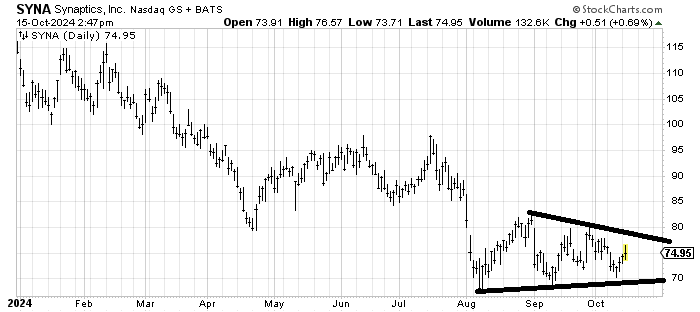
Synaptics SYNA has tried to base before (see the sideways action from April through mid July) and then it gave way. So if you want to use a stop under 70 wondering if this is the bottom, that’s what I would do but with the small caps getting overbought by the end of the week I’d say the risk/reward is not great with the stock at 75.
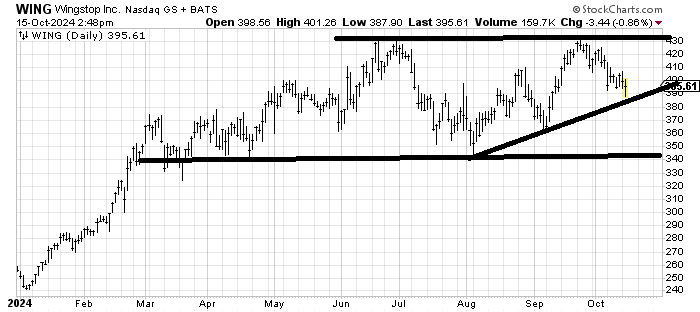
Wingstop WING had better hold here (385-ish) because if it breaks I think it will come down to the lower end of the range it has been in since March.