Things We Know and What They Tell Us
There are things we know about this market. And we can use our knowledge of market history to understand what to expect next. We'll also look at EWM, QQQ, AMGN, FSLR, PDD, DKNG, and TGT.
You've reached your free article limit
You've read 0 of 1 free Pro articles.
The Market
Let me reiterate that the market never got fully short-term oversold. Had it done so, this bounce would have had more vigor. Let me also reiterate that the intermediate-term indicators are not oversold. If you are waiting for the right time to buy, I suggest you wait for them to get oversold.
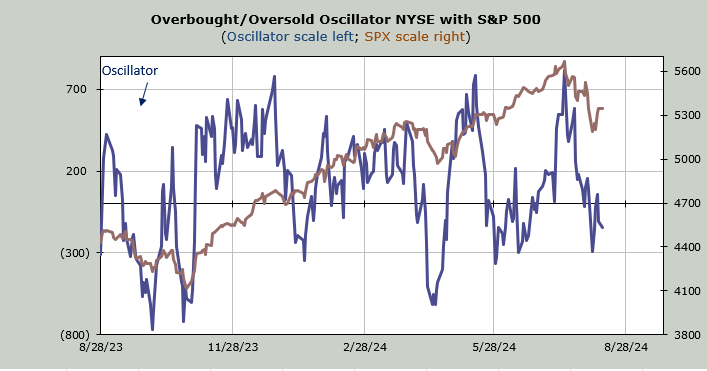
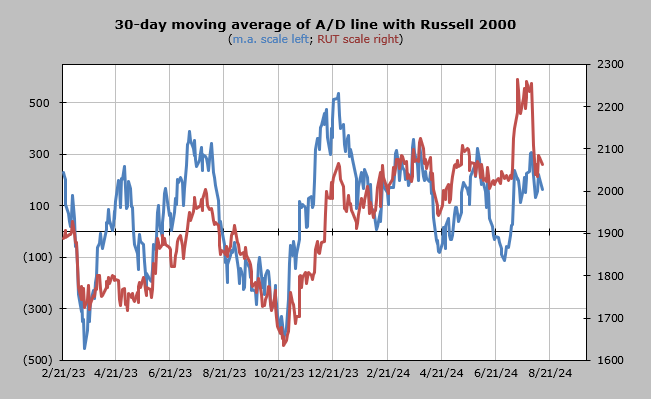
We already know that the Volume Indicator was at 52% after Friday. We know that it gets oversold at 47% (if not lower). The 30-day moving average of the advance/decline line, what I use as an intermediate-term Overbought/Oversold Oscillator isn’t even near the zero line, let alone under it. That indicator needs time to get there. The chart is shown below.
We know the Nasdaq Hi-Lo Indicator is pushing lower but it too is not oversold yet as it sits at .33. This is down from near .60 coming into last week but it needs to get under .20 to get oversold.
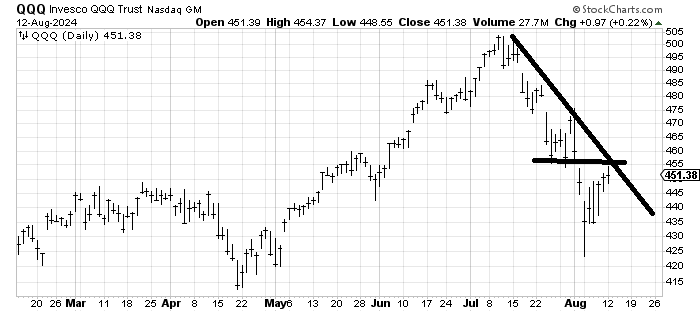
Short-term, if we back off another day or so, we’ll probably rally again. But that is chop, that is trying to game the wiggles. Sure, the QQQs, where the rally has been situated, have gone from 435 to 452, but in a market that had gotten truly oversold, one week later the QQQs would have been over 460 by now because they would have rallied the twenty handles in two days.
Speaking of the QQQs, they are touching up against that first resistance area of 455-460.
So that leaves us with a sloppy market. I would love to see one more rally into the end of the week just to work off the short term oversold condition we did get.
New Ideas
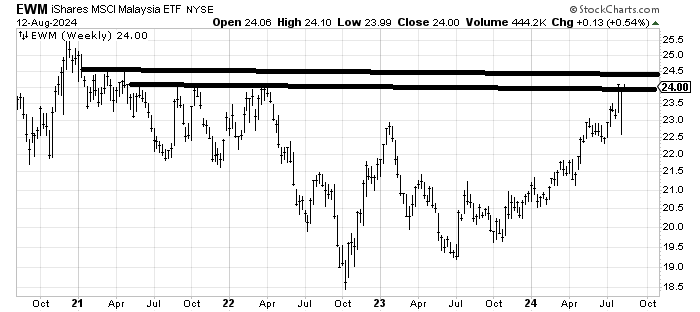
I was asked to follow up on EWM, an etf to be long Malaysia. I recommended this chart as we headed into 2024. It has done well but it is up against some resistance. I’ll couch the resistance at 24-25. This is a weekly chart (4 years) so you can see it’s still a good long term chart but on a shorter term basis it’s got trouble here. I’d be inclined to sell some up here and then use a trailing stop on the rest.
Today’s Indicator
The 30-day moving average of the advance/decline line is discussed in full above.
Q&A/Reader’s Feedback
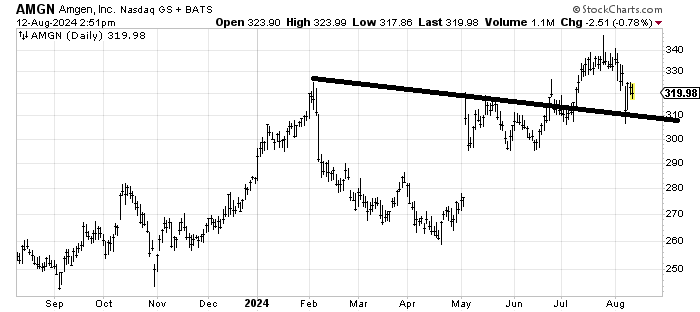
I am not yet ready to declare Amgen’s AMGN run over yet but I am not yet willing to step to the plate to buy it. If it can test that 310 spike low, and do so around the time we get intermediate term oversold, then I’d step up to the plate on the stock, otherwise it seems to me it’s in nowhere land.
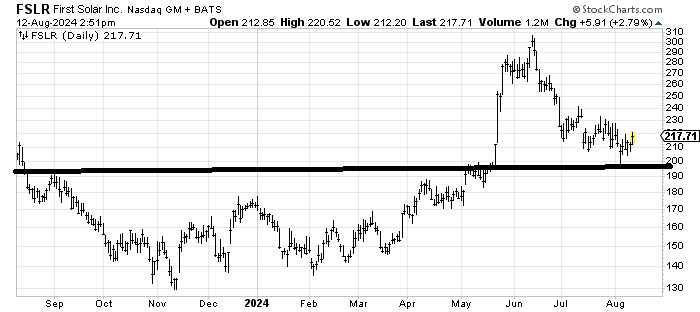
I am interested in First Solar FSLR because it appears to be about 50% through the correction. I would like to see it continue sideways and not break that 190-200 area by the time we are back to an intermediate-term oversold condition. That ‘s what I would watch in the weeks ahead.
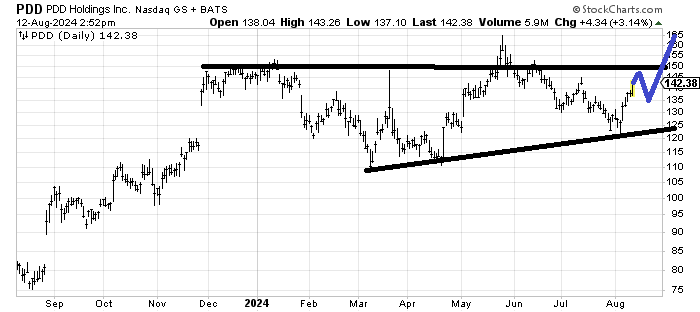
PDD Holdings has held up well. It’s got decent resistance around 150. I think if it can rally another day and then pullback a bit, it would give it some oomph to get through resistance.
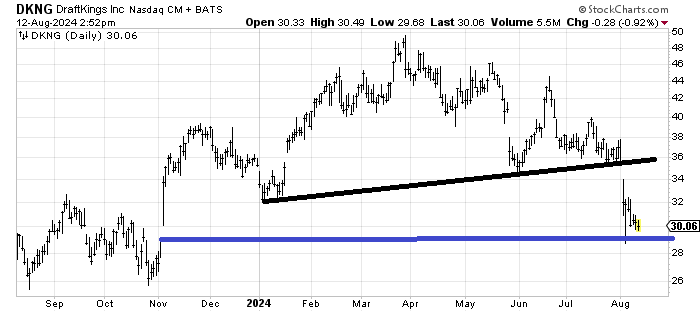
DraftKings DKNG filled the gap from last November on that spike low last week so the key is if it can hold it on the next trip down. I think in the near term that is possible but with all that resistance overhead I don’t think it is going anywhere special. 34-36 looks like the limit to me.
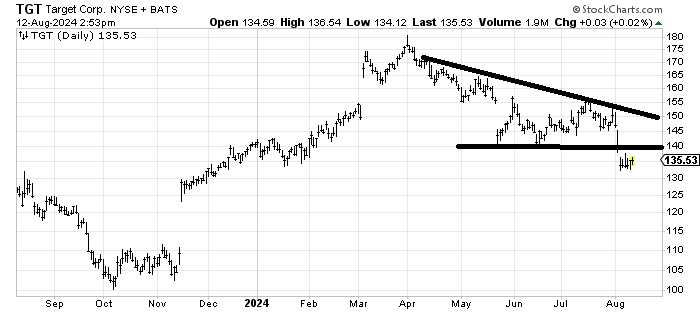
Unless Target TGT can jump back over 140, the chart looks to me like resistance overhead is what this chart is in for should it rally. Only a jump over 140, leaving the last week as an island would have me thinking the chart is bullish.