The Selloff Was Widespread, But Did It Change Anything?
Let's check the indicators as Nvidia continues to play its own tune as everyone else takes a hit. And who's wrong, bonds or the Utes? Plus, what to watch for the SOX, Russell, Boeing and RH.
You've reached your free article limit
You've read 0 of 1 free Pro articles.
The Market
Monday was proof that when Nvidia NVDA rallies everything else must sit it out. But that’s what happens when we are overbought. Remember an oversold reading should rally the others while an overbought reading should sell the others off. Nvidia is in its own world.
That having been said, the selloff was widespread because breadth was the worst it has been since August 5, the day the market panicked over the Yen Carry Trade. But did it change any of the indicators? It did not.
The same way last week’s rally did not lift the McClellan Summation Index, Monday’s decline did not change the (now downward) direction of the Summation Index. Another few days of this sort of selling and maybe we’d see the "what-if" get to +3,000 or +4,000 so that I could call it oversold using this indicator, but at +1,800 (meaning what it will take to halt the decline in the indicator, advancers minus decliners on the NYSE) it’s in the middle of nowhere.
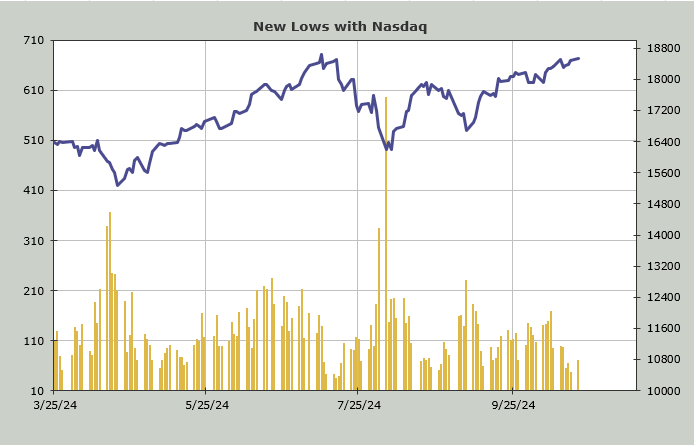
The decline didn't even change the number of new lows. Yesterday we discussed the lacking new highs (still an issue) but on down days we look at new lows and while they upticked a bit you can see they are not nothing to write home about on the Nasdaq (the NYSE is the same). We will monitor it to see if it rises much but right now, it looks pretty standard.
As much as I think the VIX needs a good bounce even that didn’t show any life during the decline, barely closing up on Monday.
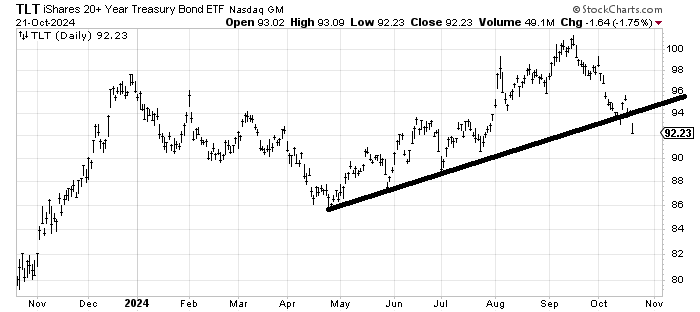
Sentiment wise we did not see much change either on the stock side of things. We did, however, see the DSI for bonds drop to 26. When I said last week I thought the rally in bonds would see more choppy action, some ebbing and flowing, I did not have Monday’s action in mind. Not at all.
The line broke and did so in a serious fashion. I could draw in another line, a flatter line but it’s clear I am wrong. Yet I will tell you that I still think bonds (iShares 20+ Year Treasury Bond ETF TLT) should rally. There is too much support in this whole area for me to panic out. And the DSI is already 26.
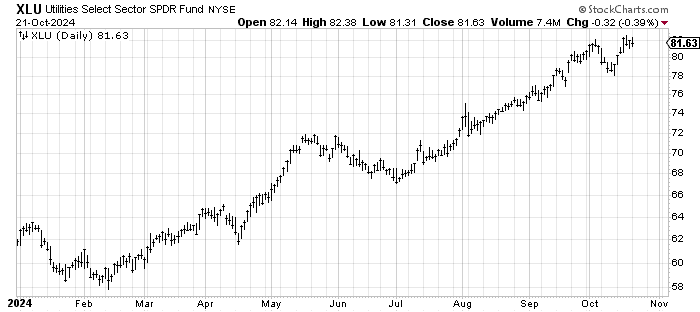
I do want to finish up with the chart of the Utes. I have not been a fan of the Utes for a month or so now but I can tell you this: they have not budged in a week, despite the move in bonds. So one of them is wrong. Obviously I am hoping (hope is a four letter word!) it’s bonds and that TLT will rally.
Lastly, the SOX has been green for four straight days. It hasn’t gone longer since April. Let’s see if that pattern breaks Tuesday. And the Russell 2000 has been red for three straight. It hasn’t gone four since early September.
New Ideas
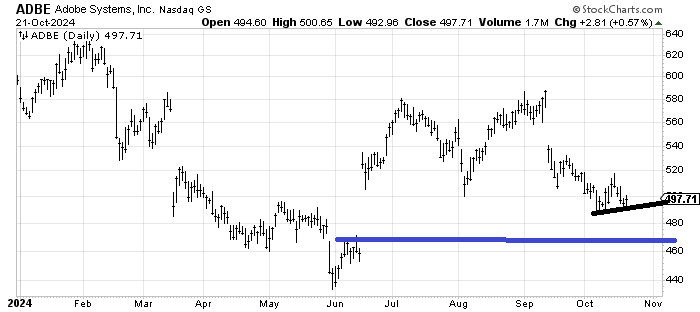
I want to follow up on Adobe ADBE, which I was asked about a few weeks back. I was non-plussed when it came to the chart. I wanted it to fill that gap (blue line) around $465 but for now it is holding that early October low. So if you want to take a stab at a trade, the risk/reward isn’t bad. You know you are wrong if the stock cracks under $490 (and then should fill the gap). Or it’s a (short term) double bottom.
Today’s Indicator
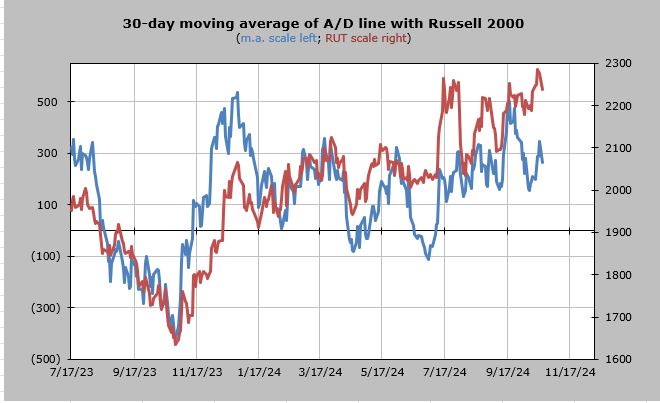
The 30-day moving average of the advance/decline line is overbought.
Q&A/Reader’s Feedback
Helene welcomes your questions about Top Stocks and her charting strategy and techniques. Please send an email directly to Helene with your questions. However, please remember that TheStreet.com Top Stocks is not intended to provide personalized investment advice. Email Helene here.
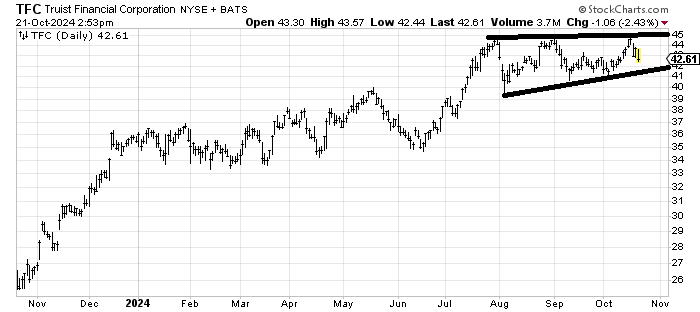
Truist Financial TFC, who I once had a mortgage with when it was BB&T, should have broken out by now. When we consider that the Bank Index managed to get over 115 and make a run toward 125 we should expect the stocks in the index to at least break out and TFC has not. If the stock comes down to $41-ish the risk/reward is better because then you know you are wrong with a strong trade under there. Otherwise, the chart looks like a big giant sideways to me.
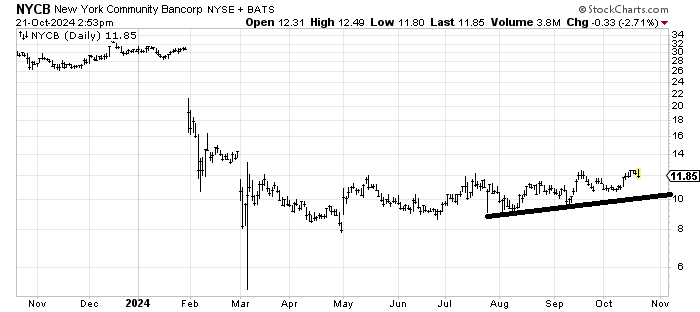
New York Community Bancorp NYCB should also have broken out already, although it has different issues than TFC. Yet I am drawn to that big base. Once the market gets oversold again, or if the stock gets down near $10 I’d probably be willing to take a stab at this.
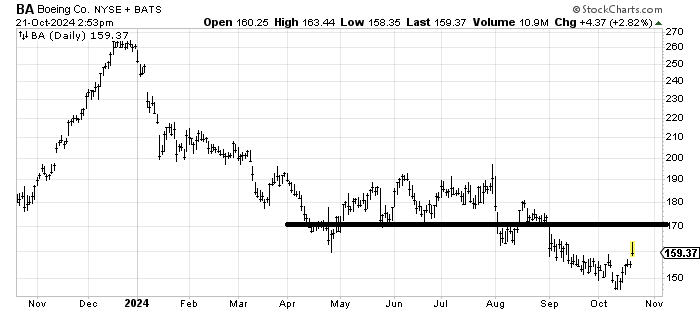
Boeing BA has seen a fair amount of tax-loss selling in the last six weeks. The question I have is when does the secondary show up? If there is a secondary in the next week or so and the stock can’t break to a lower low then it’s worth a trade to the upside.
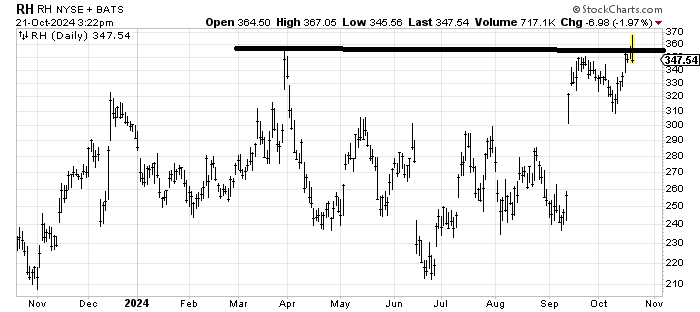
It looks to me as if RH RH continues to have resistance in this $350-360 area. Monday’s reversal doesn’t look great but we often find these reversals have a little bit of follow-through and then the selling dries up. I would like to see the stock come down to the $330-335 area and if it can hold there, take another look at it.