Expecting an Overbought Condition This Week
A short note today due to computer problems.
You've reached your free article limit
You've read 0 of 1 free Pro articles.
Note: Due to computer problems this will be a short note today since my (relatively new) PC died and I am using an old one. With any luck, I will be back up and running at full speed tomorrow. My sincere apologies.
The market should be back at an overbought condition early this week. What strikes me is that it is already reacting to that overbought condition with the Russell 2000 red for the last two days. The math says a Monday/Tuesday rally is not out of the question but after that, especially if those days are up, we’re overbought.
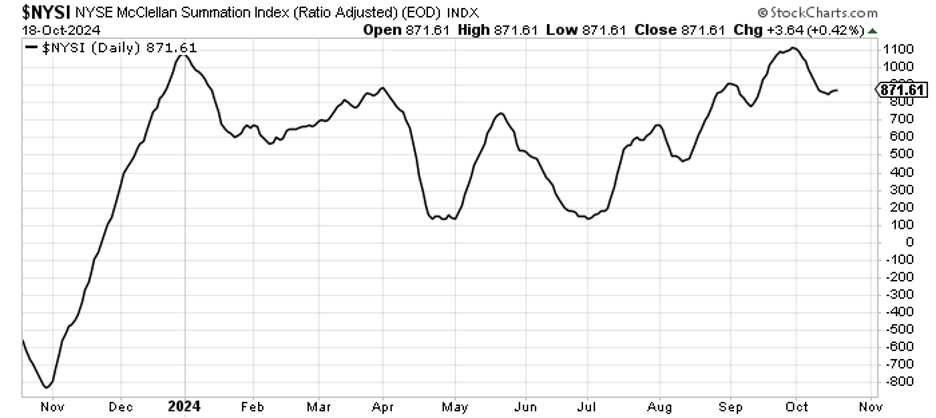
What also strikes me is that despite breadth rejuvenating itself since we got oversold just over a week ago and breadth being positive for seven of the last ten trading days, the McClellan Summation Index has still not gotten in gear. It still requires an up day to turn upward. Right now, all it did was stop going down.
There has been a lot of churning around lately, too. To me, that shows that while we get group rotation, there isn’t a lot of follow through. Yet we also see very little selling. In fact, if we look at CSX, which I had liked a week or so ago, it had a nice little run, reported crummy earnings, and gapped down. Terrible, right? Yet what did it do the very next day after gapping down? Rallied, right back to where it was when I first recommended it.
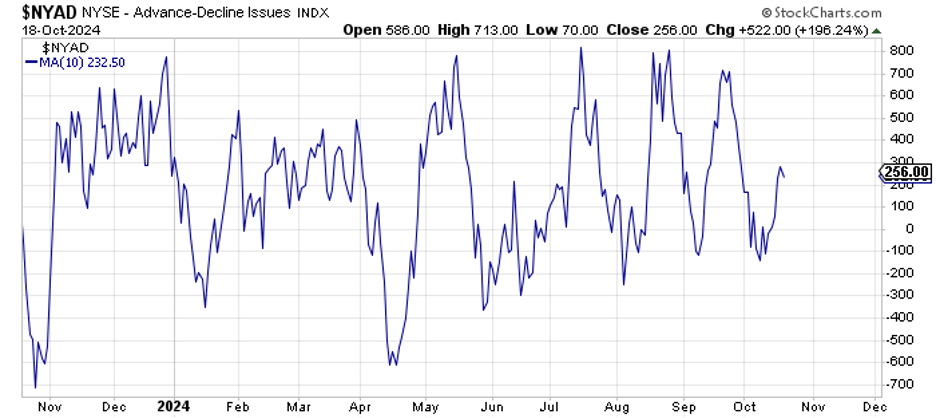
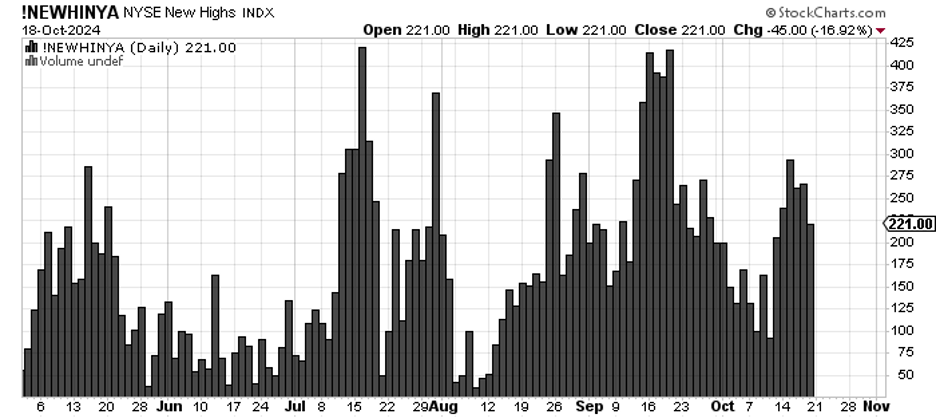
So, what I see on the upside, I also see on the downside. We can see that in the number of stocks making new highs. They contract on an almost daily basis now. Not only that, but the new lows also don’t expand anymore either. It’s as though we’re just shuffling around now.
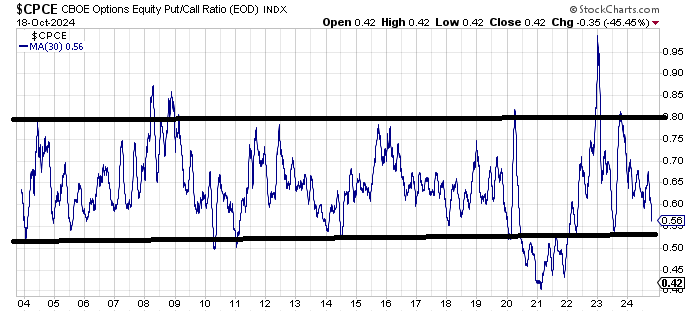
Then there is sentiment. We haven’t seen much change in the DSI readings as the indexes still hover in the low 80s while the VIX hovers either side of 15, but the equity put/call ratio fell to .42 on Friday, which is the lowest reading since mid-July 2023 when it got to .39 (just prior to a 10% correction in the market). If we step back and look at the 30-day moving average of this metric, the level of bullishness is starting to get quite extreme.
In the last 20 years, we have rarely fallen out of the range I have indicated on the chart (around .55 on the lower end and .80 on the upper end). In fact, the only time we have really fallen out of the range on the bottom has been in those wild days of 2020-21. It’s always possible we will go back to that, but I generally don’t look for outliers but rather for what is typical. With this reading now at .56, it is the lowest since mid-July 2023 and lower than it was in July of this year. I’d say folks are ‘all in’, and while maybe we don’t see ‘giddy’ in the other indicators yet, we certainly see a high level of complacency.
I don’t know what could trigger a sell-off, and we are in the middle of earnings season, which so far seems to see earnings coming in okay, but we are starting to see some extremes creeping into the market. Stay alert.
