Super Micro Computer Is Approaching a Fork in the Road
With equilateral triangles you don't know if the breakout will be to the upside or the downside.
You've reached your free article limit
You've read 0 of 1 free Pro articles.
Super Micro Computer SMCI has had quite a run this year, with shares of the AI name going parabolic. However, the stock is now at a key juncture.
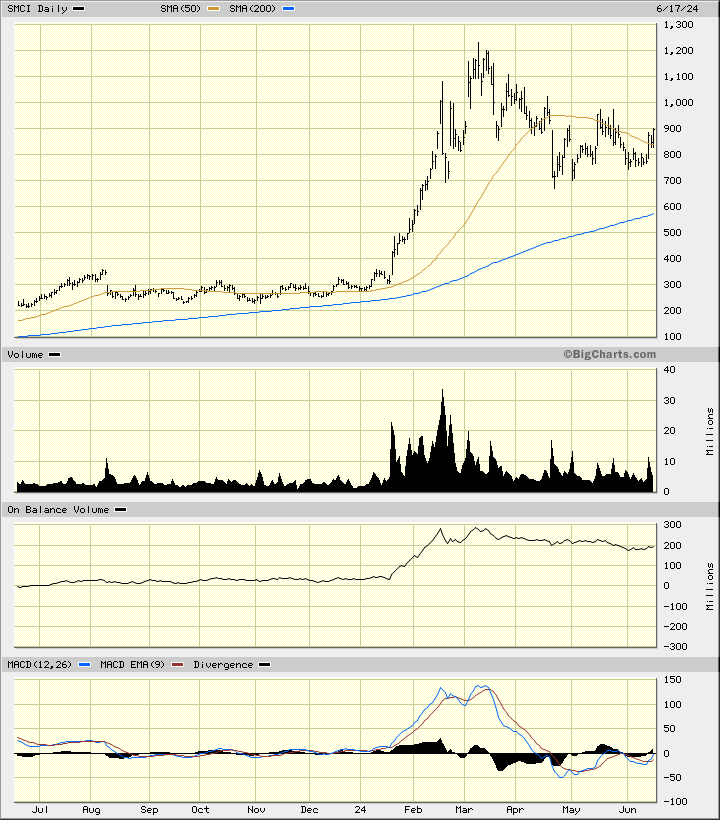
SMCI shares have formed a large equilateral triangle on the daily bar chart (below). The stock has made lower highs on the chart since March and higher lows since April and the apex of these trendlines (not drawn) is approaching fast.
Ascending triangles tend to break out on the upside and descending triangles tend to break out on the downside. With equilateral triangles you don't know if the breakout will be to the upside or the downside.
Let's check out a few charts and indicators.
In the daily bar chart of SMCI, below, I can see that equilateral triangle (when you look at charts for more than 10,000 hours it becomes easy to recognize). Prices are trading above the 50-day moving average line but the slope of the line is negative. The slower-to-react 200-day moving average line is positive and intersects around the $590 area.
Trading volume has been shrinking since February. The On-Balance-Volume (OBV) line has been in a decline since March. The Moving Average Convergence Divergence (MACD) oscillator is slightly below the zero line.
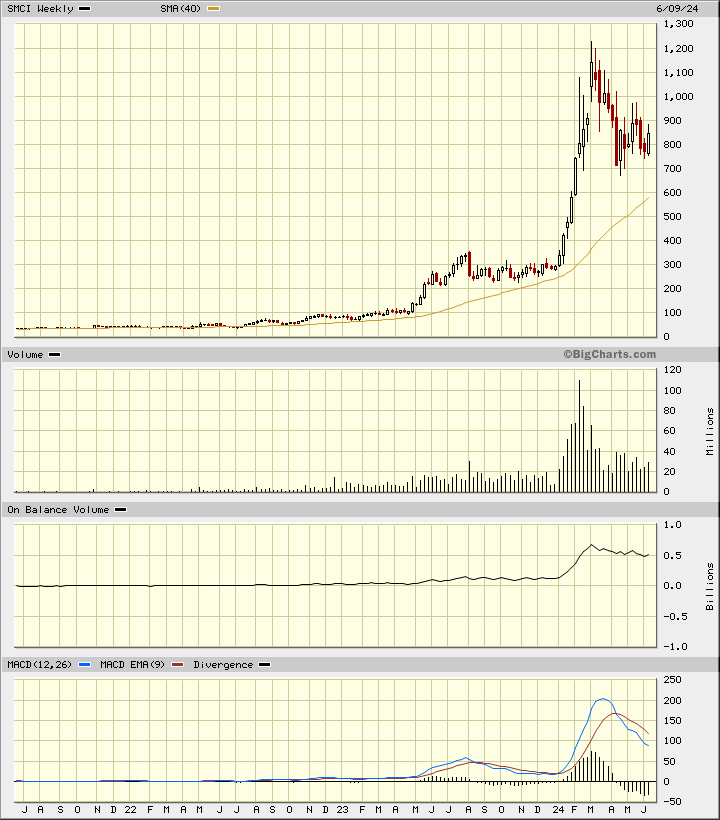
In the weekly Japanese candlestick chart of SMCI, below, I can see both upper shadows and lower shadows since March. More upper shadows would be a bearish clue and more lower shadows would be a potential bullish clue. The slope of the 40-week moving average is bullish.
The weekly OBV line has been declining from a peak in early March. The MACD oscillator has crossed to the downside for a take profits sell signal.
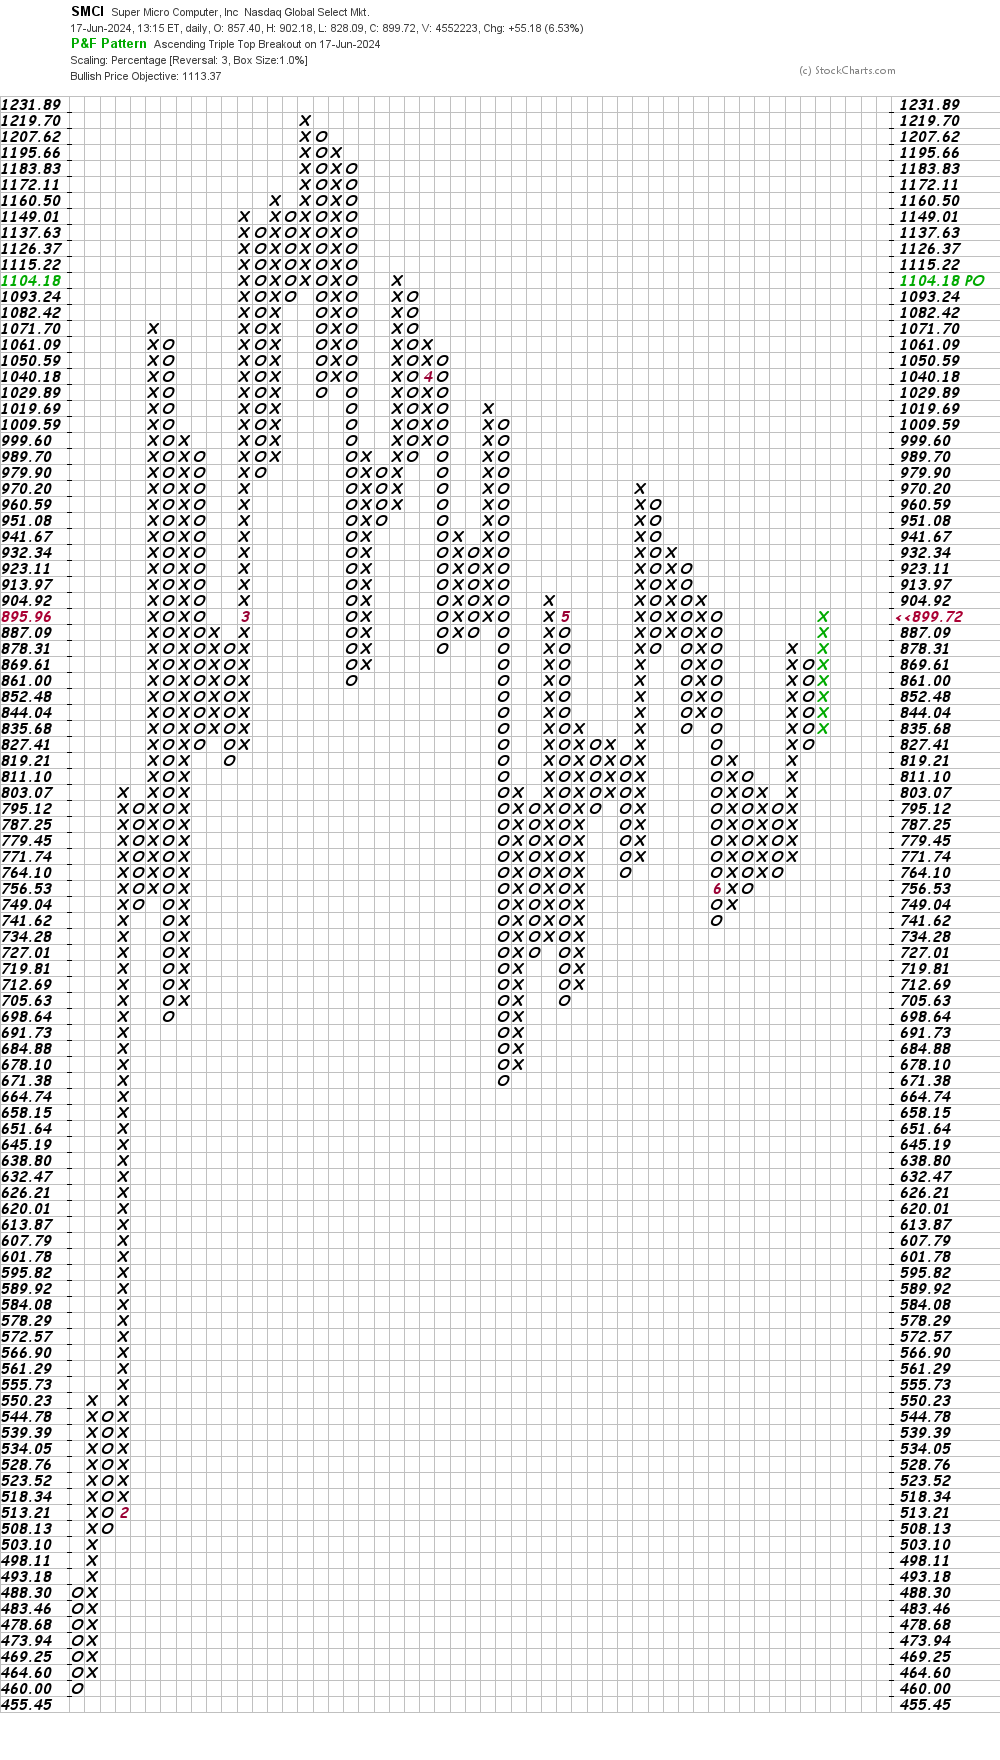
In this daily Point and Figure chart of SMCI, below, an upside price target in the $1,113 area is shown.
In this weekly Point and Figure chart of SMCI, below, I can see a downside price target in the $504 area.

Bottom-line strategy: Equilateral triangles are hard to analyze and hard to trade. Call me chicken but I am going to sit on the sidelines.
Employees of TheStreet are prohibited from trading individual securities.