Stocks Are Sitting at a Crossroads
Are they oversold or not? Will the chopfest continue or not? We’ll be watching the others to see what could come next.
You've reached your free article limit
You've read 0 of 1 free Pro articles.
The Market
From my vantage point, the market is at a crossroads. Using some of my shorter-term indicators, we’re oversold. Using some other indicators, the market is screaming we need some downside to get a reset that is good.
In other words, if the short-term oversold condition wins out over the ‘need some downside,’ I don’t think it changes much of what we’ve seen for the last several weeks, which has been a giant chopfest.
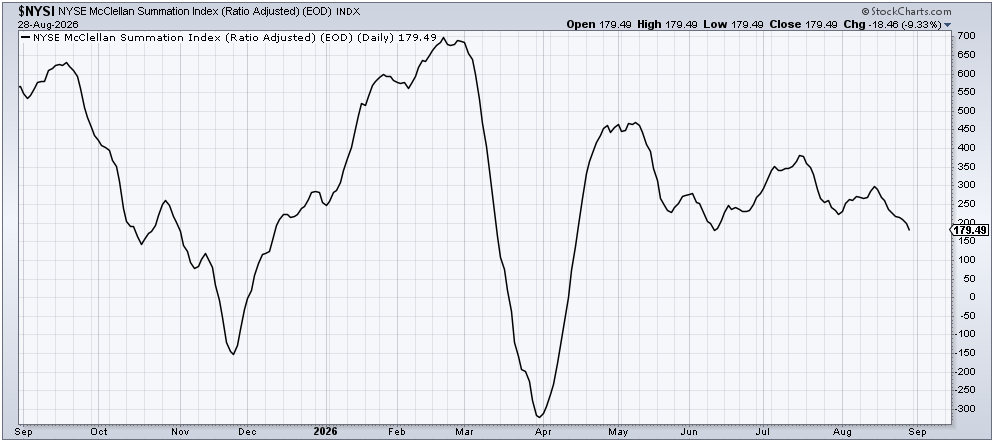
When we look back at the month of August, you might recall I had been of the mind that the ‘others’ would have a difficult month. It did not pan out as I envisioned. However, indicator-wise, you can see perhaps it has. Look at the McClellan Summation Index, which I think shows us what the majority of stocks are doing. It has been trending down for more than two weeks already, and if you squint hard enough, you can see it has made a lower low than late July and is closing in on the early June low.
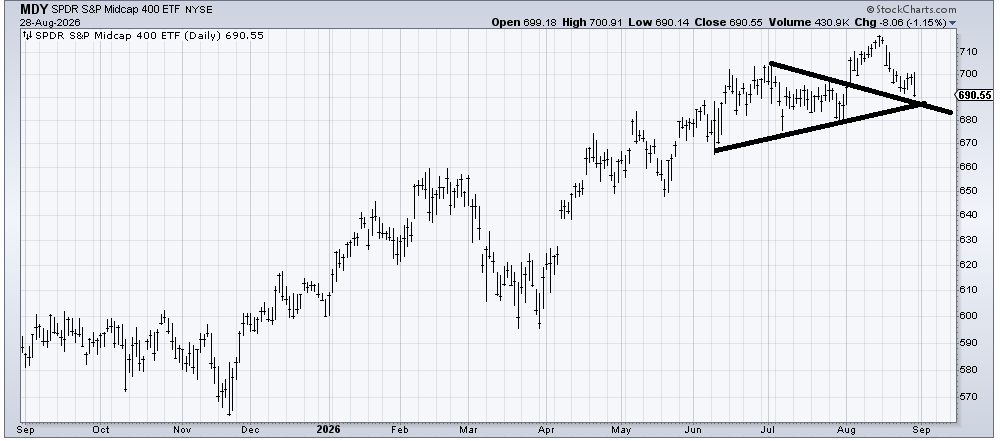
If we look at the chart of the Mid Caps, we can see they are pretty much down on the month. The chart shows that rise early in the month that has been leaking without much fanfare for the last two weeks. It is coming into some decent support in the 685 area.
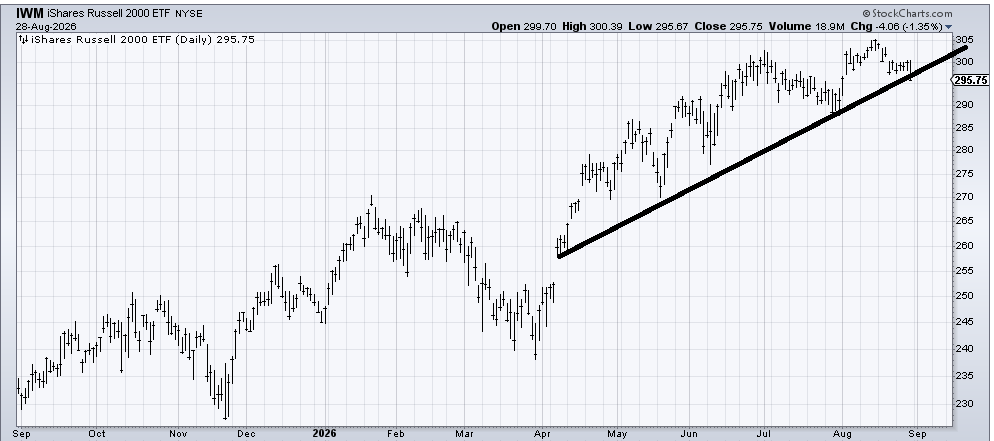
The IWM hasn’t escaped the same type of leakage. It too is back where it was in early August, having given up the gains that got folks so excited early in the month. It is also back where it was in June.
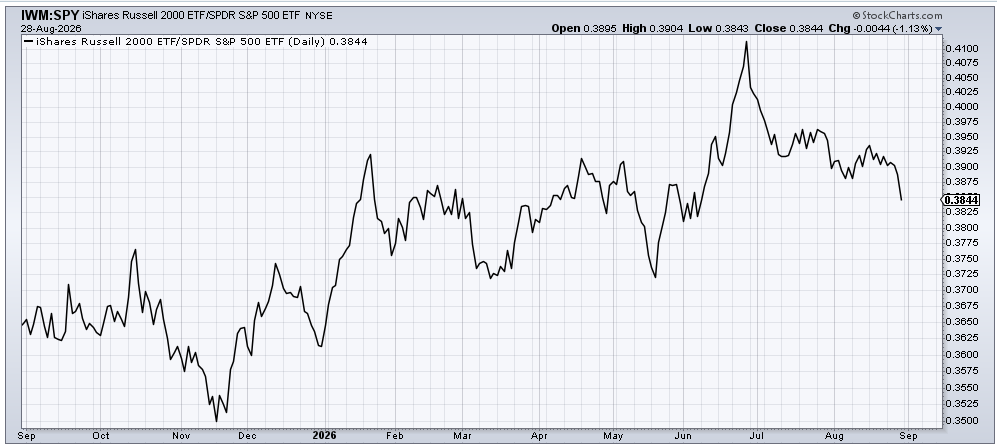
For all the hootin and hollerin about how great small caps were (are?) relative to large caps, the ratio of IWM to SPY says that narrative is wrong. That ratio peaked two months ago and just made a minor lower low. You can see it accelerated in the last week.
And what of everyone’s new favorite ETF, the RSP (equal-weight S&P)? Aside from the fact that the ratio peaked back in late February, notice all that supposed broadening out peaked in late July—exactly when the SOX/tech stocks made their lows. This ratio turned south last week as well.
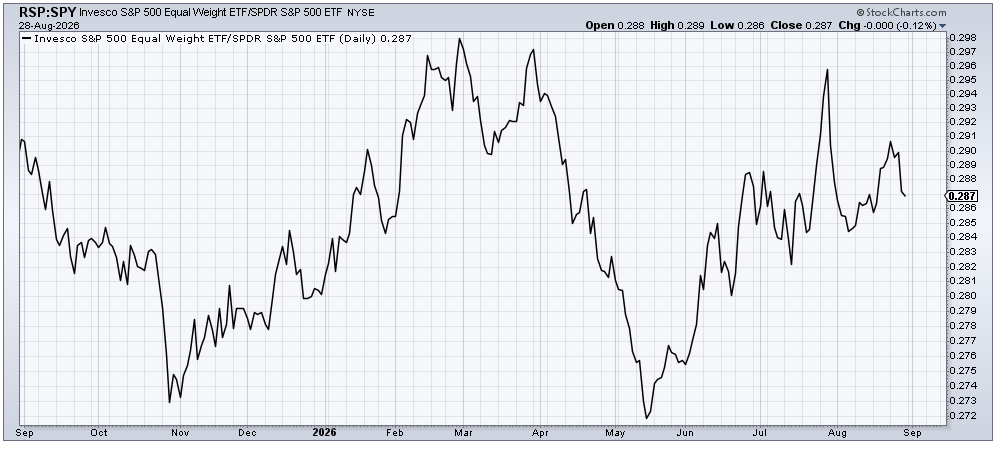
When you see these charts, you can understand why in the very short term, the market seems oversold. But you can also see that the Either/Or Market remains intact.
As we head into the week, we’ve got the usual end-of-the-month/beginning of the new month dynamics, which often has an upward bias. My notes say the oversold condition is not a great one, meaning the runway is likely short. Notice that several of the Mag 7 (or 10 or whatever they are these days) were up quite a bit on Friday while the rest of the market drooped. That is not helpful if we want to change the pattern we have been in for a month.
Bonds continue to be the focus. I still think they are bottoming, but I must say that interest rates getting out of hand for a bit might be the only way to get some old-fashioned whoosh in the market.
New Ideas
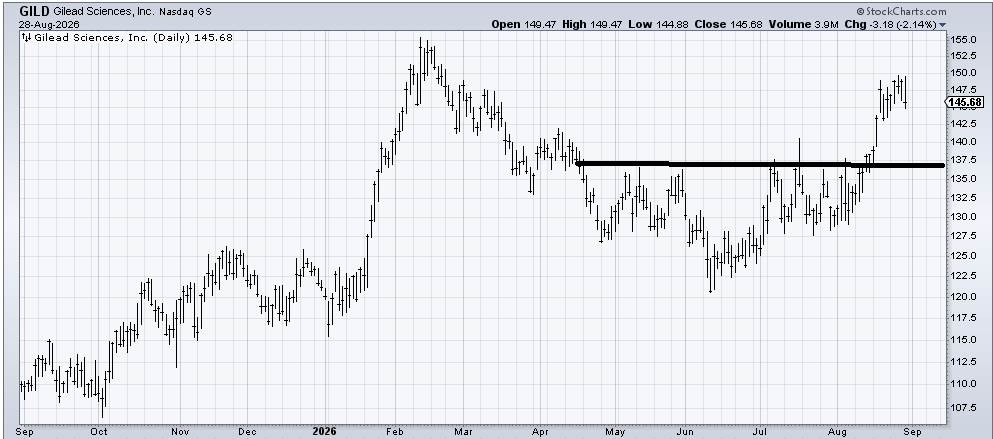
I recommended Gilead (GILD) in early August. I had thought it could/should get to the old high, but it has stalled out. It probably still has another run in it after a pullback, but I’m a fan of taking some profits up here.
Today’s Indicator
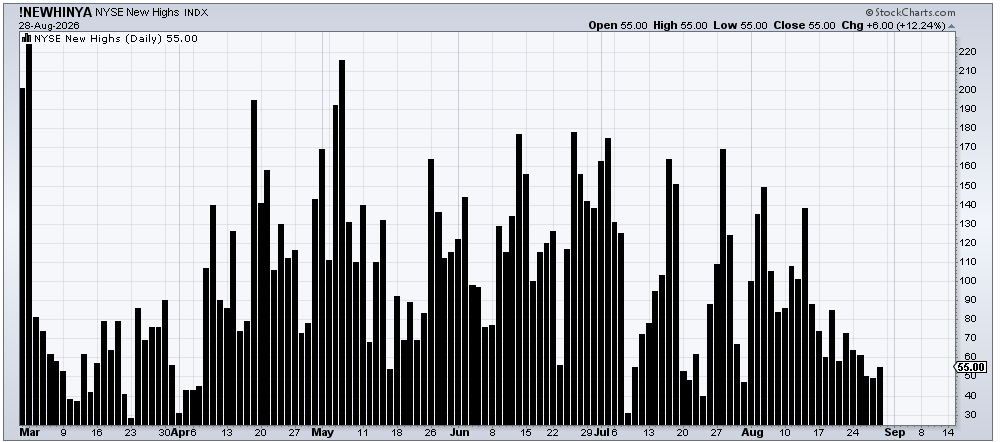
The number of stocks making new highs has been and remains pathetic. The new highs have been trending down for a month now.
Q&A/Reader’s Feedback
Helene welcomes your questions about Top Stocks and her charting strategy and techniques. Please send an email directly to Helene with your questions. However, please remember that TheStreet.com Top Stocks is not intended to provide personalized investment advice. Email Helene here.
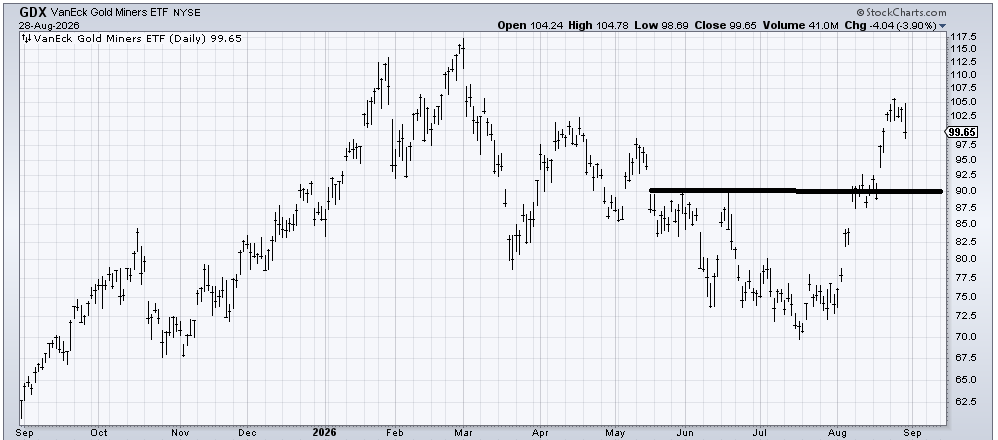
(GDX), an ETF to be long gold stocks, met its measured target when it tagged 100. There is some decent support back in the 90 area.
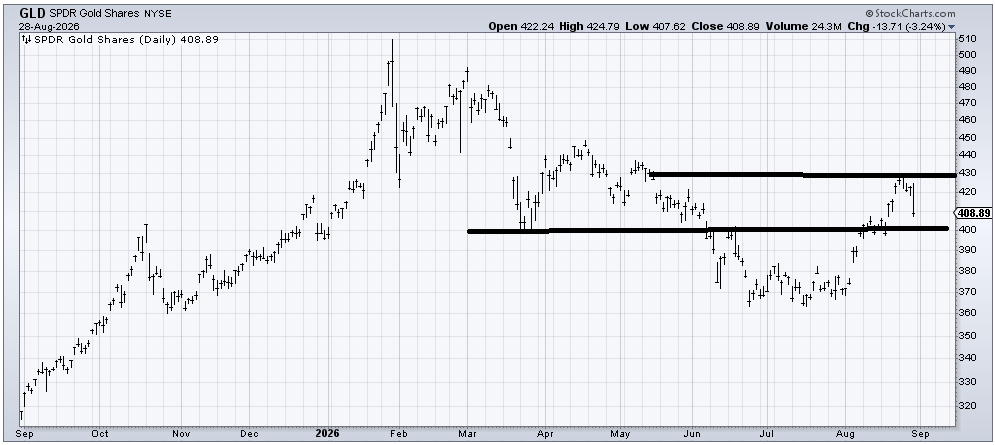
(GLD) will come into some support around 390-400. I would expect a bounce if it gets down there.
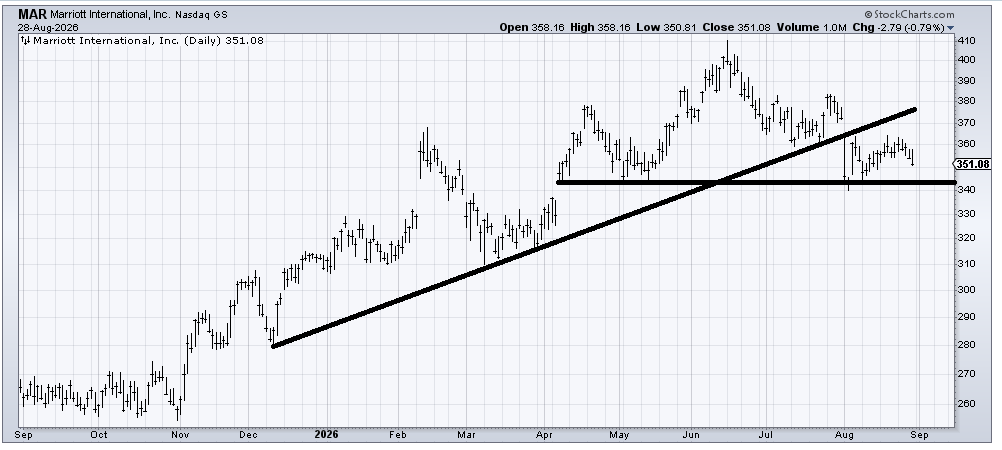
I had thought Marriott (MAR) could fill that gap up at 370, but I was wrong. A break of 340 will complete a head and shoulders top. My guess is 335-340 holds on the first trip down, but the chart looks quite toppy now.
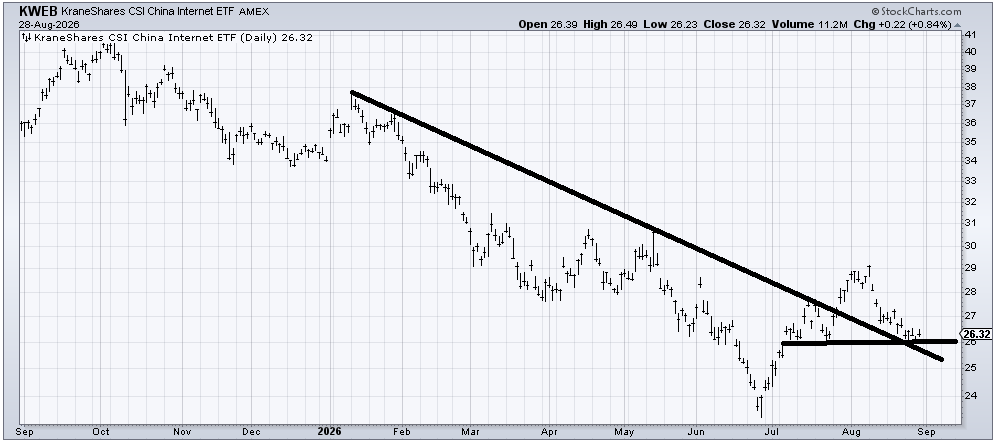
I have not had much luck bottom fishing in KWEB (KWEB) this year. Each time I have tried it, It has proved me wrong. The risk/reward at 26, though, is good. A break of this area and you know you are wrong fast.
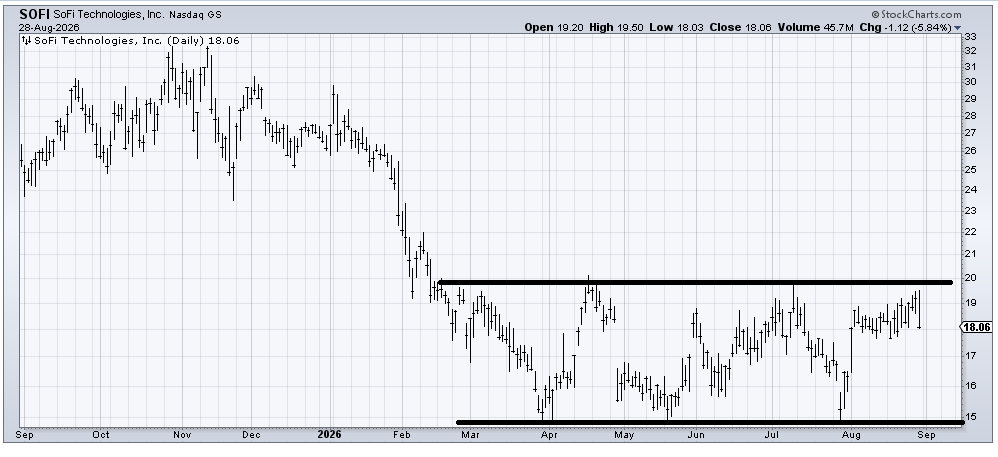
SoFi Technologies (SOFI) has been building what the textbooks call a rectangle. I would like to see this make its way toward the lower end of the range in the coming weeks because if it can do that and hold, I think as we get into the time of the year where tax loss selling candidates rally, this would be on my list.
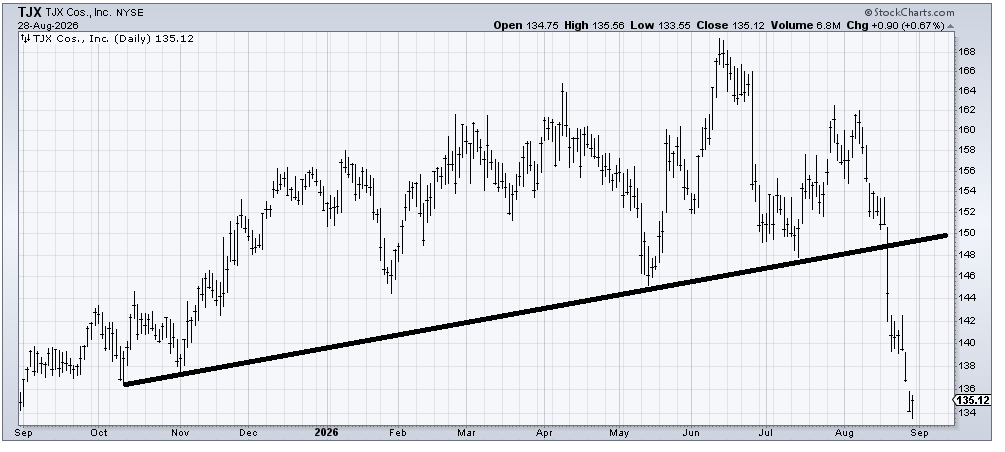
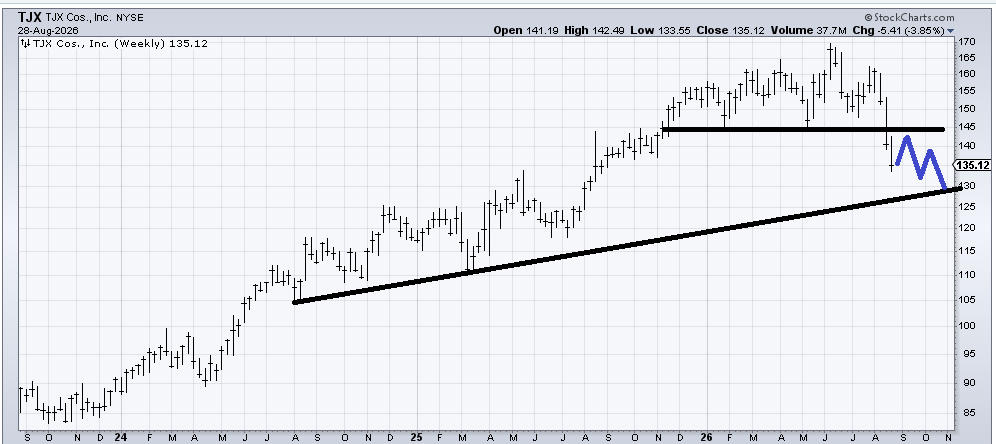
When we looked at TJX (TJX) a few weeks ago (before earnings) I said a break of that line is bearish. The stock is obviously oversold down here. But this is a candidate to get sold in tax loss selling season. My guess is it follows a path somewhat akin to what I have drawn in blue on the weekly chart. If it is at that 130 area late this year, it could set up for a tradable rally into 2027.
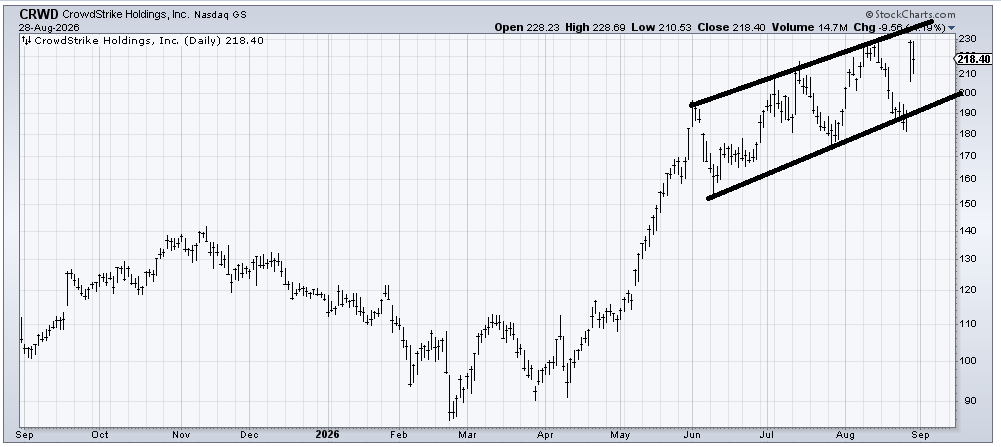
Crowdstrike (CRWD) is not my kind of chart because I like down and out or rounding under charts, and this is not that! It is, however, in a rather defined channel since June, so I would use that as my guide. A lower high puts it on a watch list (for doing something wrong), and a lower low puts it on a list that says it has finally done something wrong.
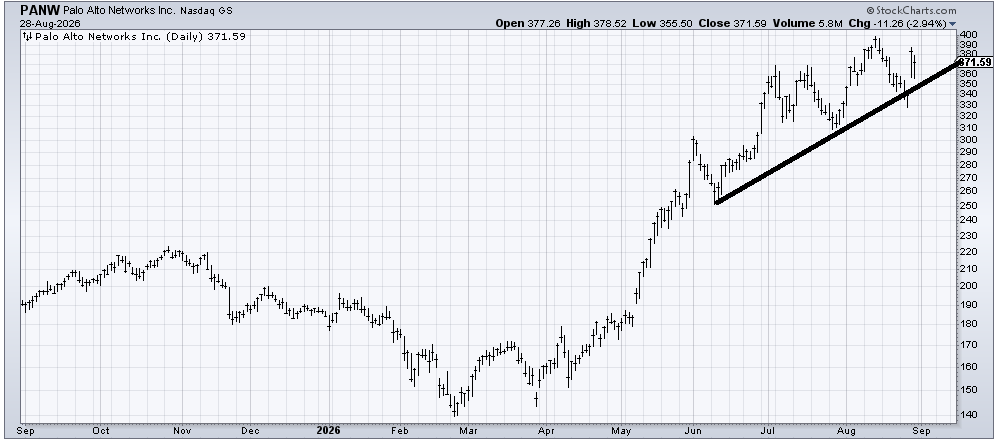
Palo Alto Networks (PANW) is also not my kind of chart. As long as that uptrend line stays intact, the stock is fine. A break of the line and I’d call it an early warning. A lower low and it will have done something wrong.
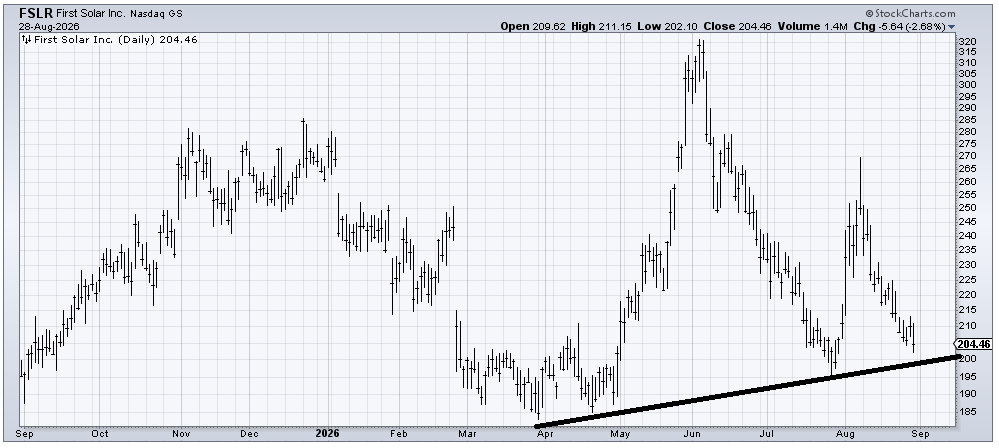
First Solar (FSLR) has my interest down here. It’s got some support around 195-200 (and more under there), so near 200 the risk/reward for a tradeable bounce seems good.