Shares of Government Contractor L3Harris may go on Defense
Let's take a look at the charts for LHX
You've reached your free article limit
You've read 0 of 1 free Pro articles.
L3Harris LHX provides "advanced defense and commercial technologies across air, land, sea, space and cyber domains" - real cutting edge stuff.
Let's check out some "old school" charts and indicators.
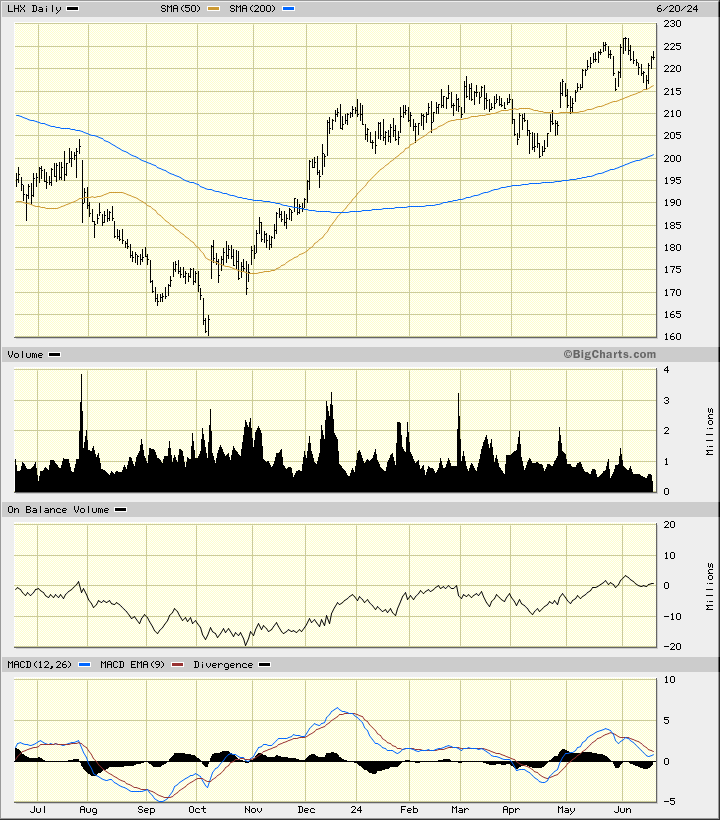
In this daily bar chart of LHX, below, I can see that prices have been "chopping" higher since making a low in early October. LHX trades slightly above the rising 50-day moving average line and has been bouncing off the line in recent weeks. LHX trades above the rising 200-day line. The trading volume has been declining the past three months and suggests that investor interest has moved to other names. The daily On-Balance-Volume (OBV) line made a move higher from late October to early June. The Moving Average Convergence Divergence (MACD) oscillator has moved lower since late May and is only slightly above the zero line.
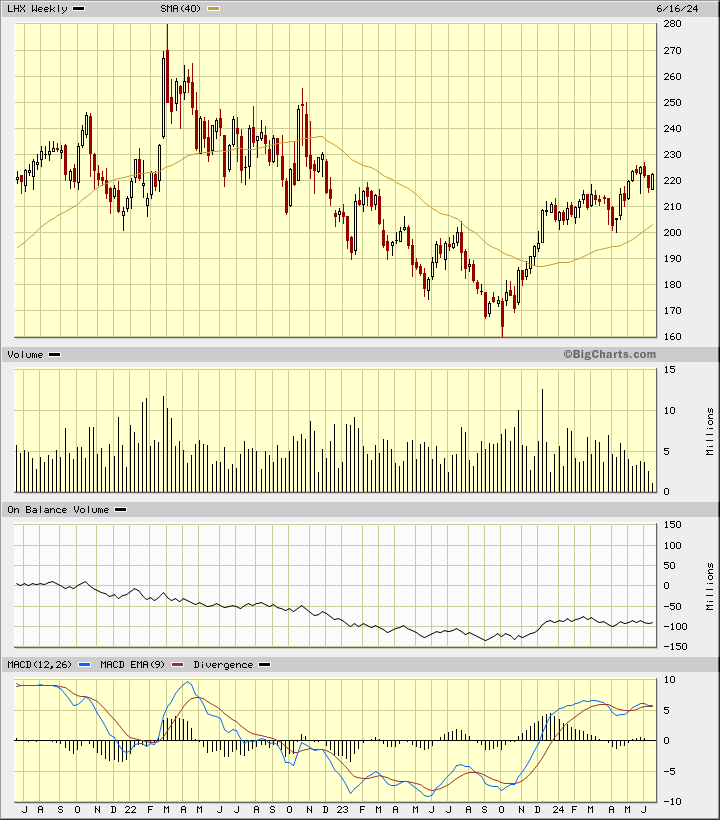
In this weekly Japanese candlestick chart of LHX, below, I see a weakening setup. Prices do trade above the rising 40-week moving average line but a top reversal pattern is showing in late May. The weekly OBV line has worked lower since February and shows us a bearish divergence recently as prices made a new high for the move up but the indicator did not. The MACD oscillator shows us both a downside crossover and a bearish divergence.
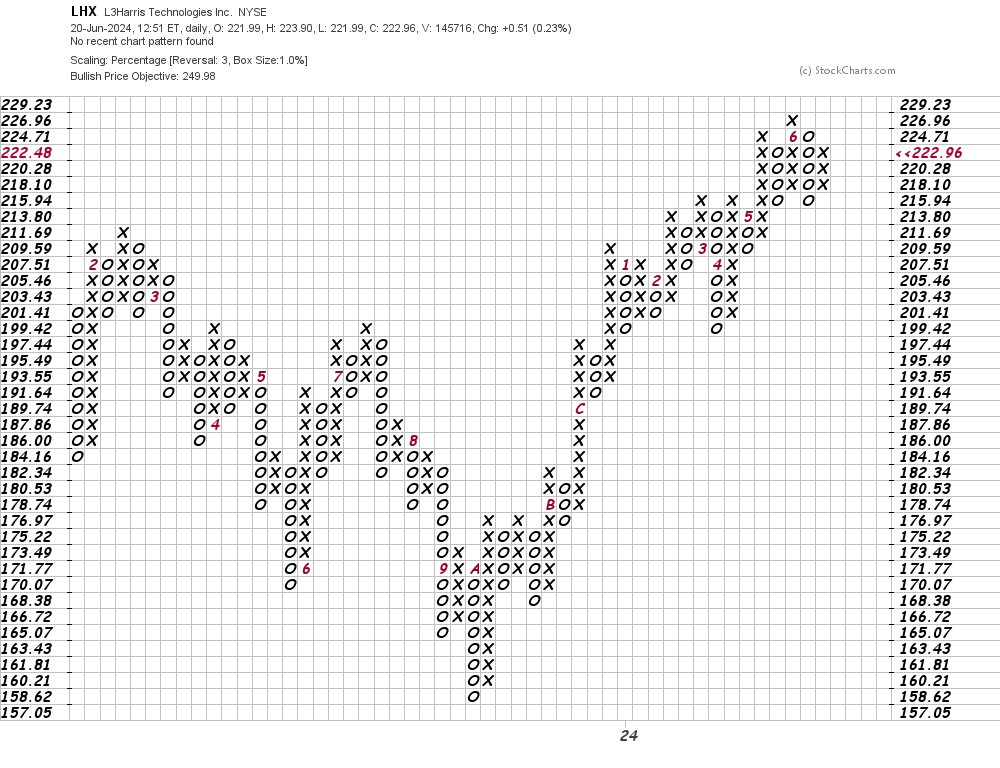
In this daily Point and Figure chart of LHX, below, I can see a potential upside price target in the $250 area but a trade at $213.80 or lower may start to weaken this chart.
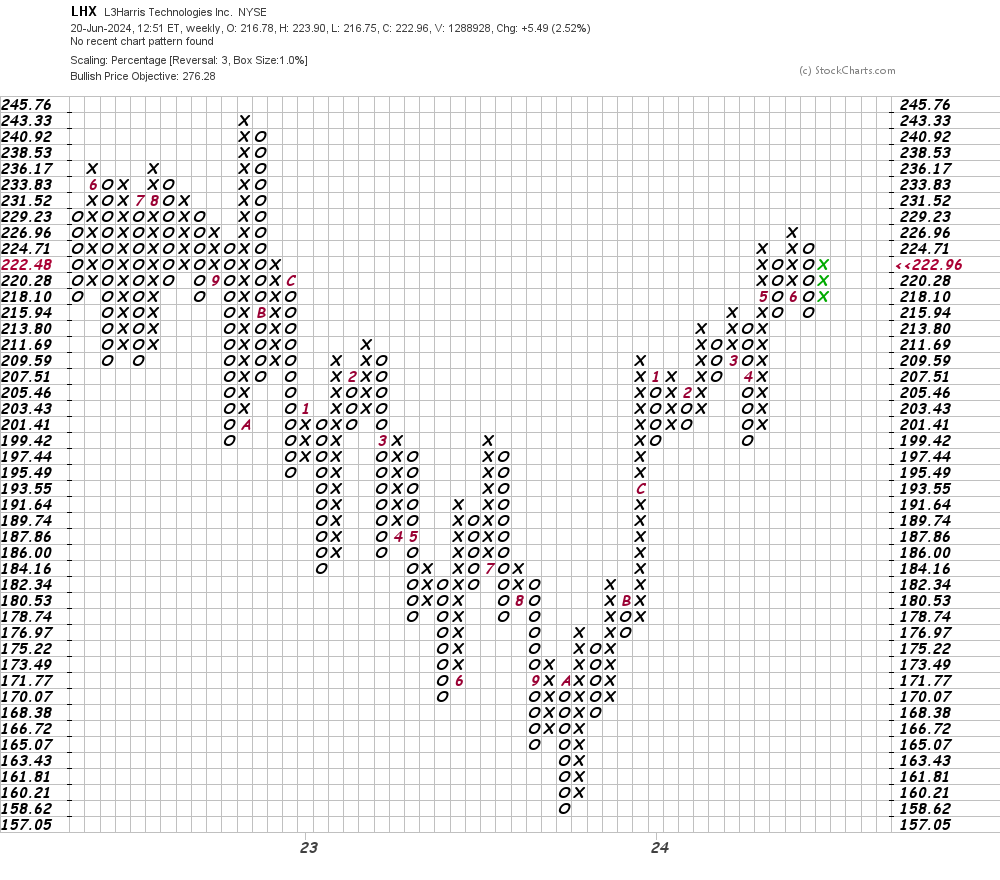
In this weekly Point and Figure chart of LHX, below, I can see a potential upside price target in the $276 area. A weekly trade at $213.80 or lower should weaken this picture.
Bottom line strategy: in my February 15 update on LHX I wrote that "Aggressive traders could go long LHX on strength above $216. Risk to $204. The $250 is my price target." Prices dipped in April and hit my risk point so traders should have sold. LHX managed to rally from an April nadir but the condition of the indicators have weakened.
I would avoid the long side of LHX for now and wait for a better buying opportunity in the months ahead.
Employees of TheStreet are prohibited from trading individual securities.