L3Harris Is Ready for Liftoff to a New High
Let's check out the charts and indicators.
You've reached your free article limit
You've read 0 of 1 free Pro articles.
L3Harris Technologies LHX is a defense contractor specializing in surveillance solutions, microwave weaponry, and electronic warfare. In my last review of LHX on December 15, I recommended not chasing the rally. Prices have traded sideways since the middle of December but they may now be ready for another move higher.
Let's check out the charts and indicators.
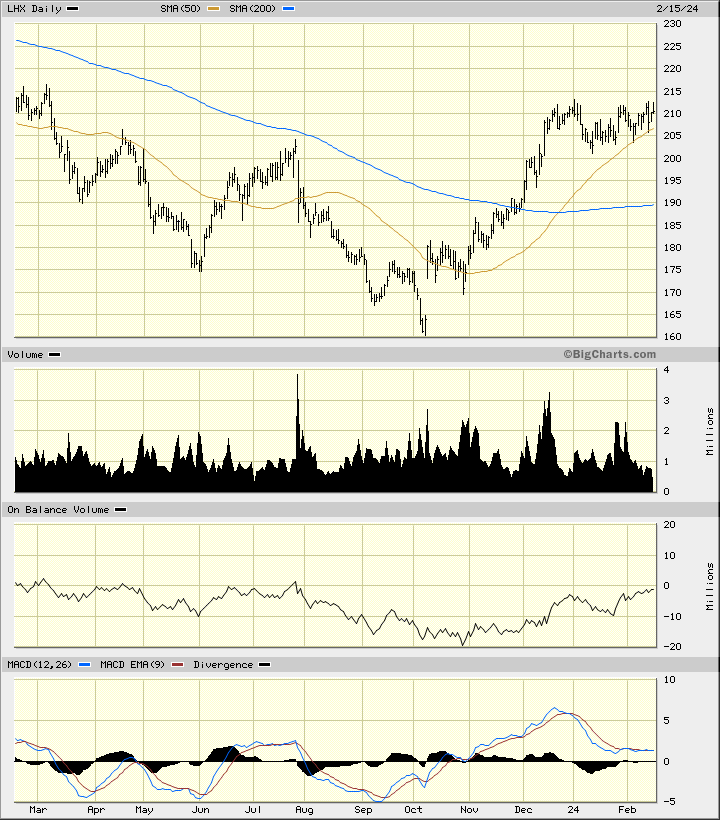
In this daily bar chart of LHX, below, I can see that prices have been testing the rising 50-day moving average line the past two weeks or so. The slower-to-react 200-day moving average line is turning higher.
The On-Balance-Volume (OBV) line has been moving upwards since late October. The Moving Average Convergence Divergence (MACD) oscillator is above the zero line.
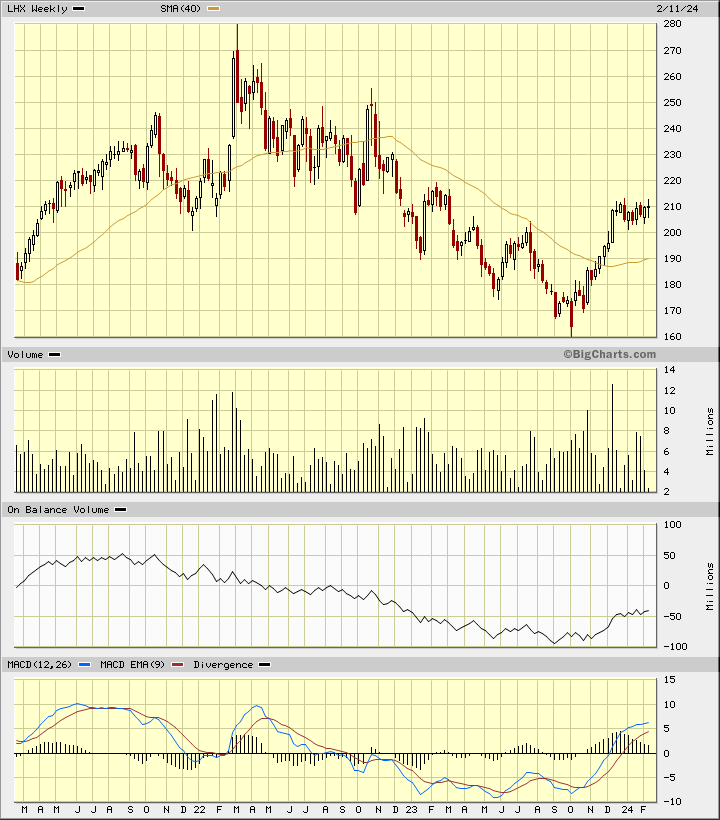
In this weekly Japanese candlestick chart of LHX, below, I see a positive setup. Prices are trading above the rising 40-week moving average line. The weekly OBV line is positive and so is the MACD oscillator.
The most recent candle pattern is a doji but it is in a sideways trend so not meaningful. A strong white (bullish) candle this week will get the uptrend moving again.
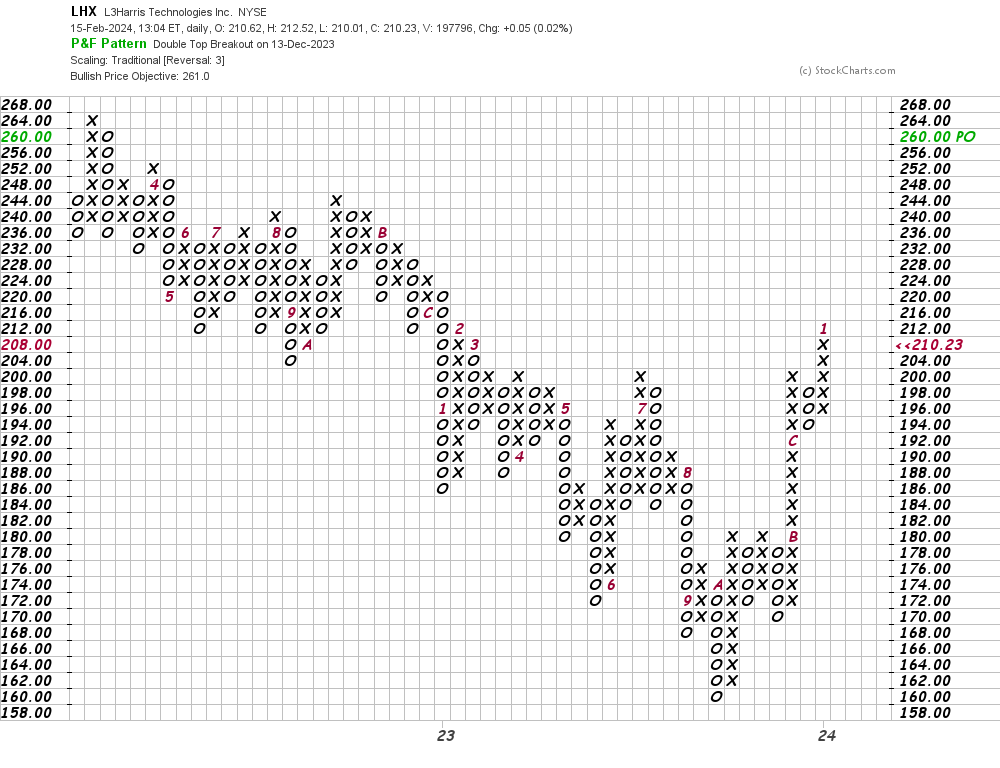
In this daily Point and Figure chart of LHX, below, I can see an upside price target in the $261 area.
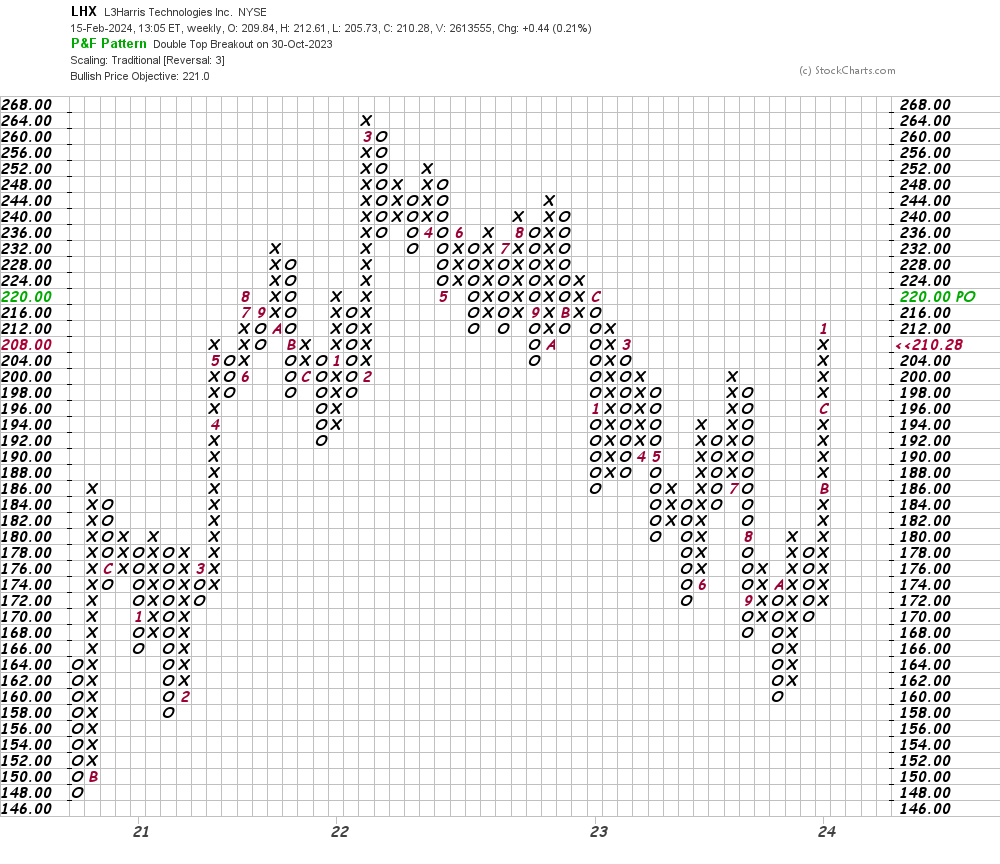
In this weekly Point and Figure chart of LHX, below, I can only see an upside price target in the $221 area. This could change with the price action.
Bottom line strategy: Aggressive traders could go long LHX on strength above $216. Risk to $204. The $250 is my price target.
Employees of TheStreet are prohibited from trading individual securities.