New GM Trade Idea After Historic Earnings
The automaker enjoyed a strong report and I’ve got a lucrative trade idea.
You've reached your free article limit
You've read 0 of 1 free Pro articles.
On Tuesday morning, General Motors (GM) released the firm’s second quarter financial results. For the period ended June 30, GM posted an adjusted EPS of $3.57 (GAAP EPS: $1.41) on revenue of $48.026 billion. These top- and adjusted bottom-line numbers both easily beat Wall Street’s expectations despite the sales print reflecting annual growth of just 1.9%.
On CNBC this morning, CFO Paul Jacobson spoke:
“These results are very consistent with what we’ve been doing for the last several years. Our first half earnings per share is 25% higher than the first half at any time in our history.”
He added that the firm’s “momentum is palpable.”
Backing that thought up, GM did raise guidance in this release. This optimism is fueled by continued “better than expected” demand for pickup trucks and SUVs. CEO Mary Barra wrote to shareholders that the firm expects these “trends to continue to strengthen our performance in 2027 and beyond.” Barra also mentioned, “multiple engines of margin expansion and growth while maintaining capital discipline.”
Operations
As revenue generation expanded 1.9% to $48.026 billion, total costs and expenses grew 3.5% to $46.567 billion. This left a GAAP operating income of $1.459 billion (down from $2.127 billion). After accounting for interest, other income and expenses and taxes, GAAP net income landed at $1.568 billion (-34%). That works out to a fully diluted $1.41 per share, down from $1.91 for the year-ago comparison. After a net $2.16 per share in adjustments that EPS print hit the tape at $3.57, up from $2.53.
Guidance
For the full fiscal year, GM improved upon the firm’s prior guidance. Adjusted EBIT is now seen at $14 billion to $16 billion, up from $13.5 billion to $15.5 billion. Automotive free cash flow is now projected at $9.5 billion to $11.5 billion, up from $9 billion to $11 billion. Lastly, adjusted EPS is guided towards $12.00 to $14.00. This is up from $11.50 to $13.50 and brings the midpoint of the range well above the $12.80 that Wall Street was looking for.
Fundamentals
Automotive operating cash flow for the period crossed the tape at $5.071 billion. Out of that number came capex spending of $1.924 billion. Added back in came an EV strategic realignment credit of $1.871 billion. After some other small adjustments, automatic free cash flow printed at a very healthy $5.033 billion, up from the year-ago comparison of $2.827 billion.
Turning to the balance sheet, GM ended the period with a cash position of $24.719 billion. inventories of $15.95 billion and current assets of $110.008 billion. Current liabilities run at $96.834 billion, including $37.012 billion in short-term debt. This puts the firm’s current and quick ratios at 1.14 and 0.97, which despite hefty print for short-term debt is really quite healthy for a large industrial company.
Total assets run at $282.742 billion. The firm does not rely upon goodwill or other intangibles to beef up this number. Total liabilities less equity comes to $219.101 billion. This does include long-term debt of $90.685 billion, which is more than enough, especially given the large number for short-term debt that will have to be rolled over. This is not an absolutely awful balance sheet for this kind of firm. That does not mean I like it.
The Chart
As a pickup truck guy, I do like the Chevys, though I am not so much a fan of the GMCs which are basically the same trucks for more dough (I drive a Ram 1500). I am also a fan of the Ford (F) pickups, so this space does interest me. Cars? No. SUVs? Depends. Let’s do the chart.
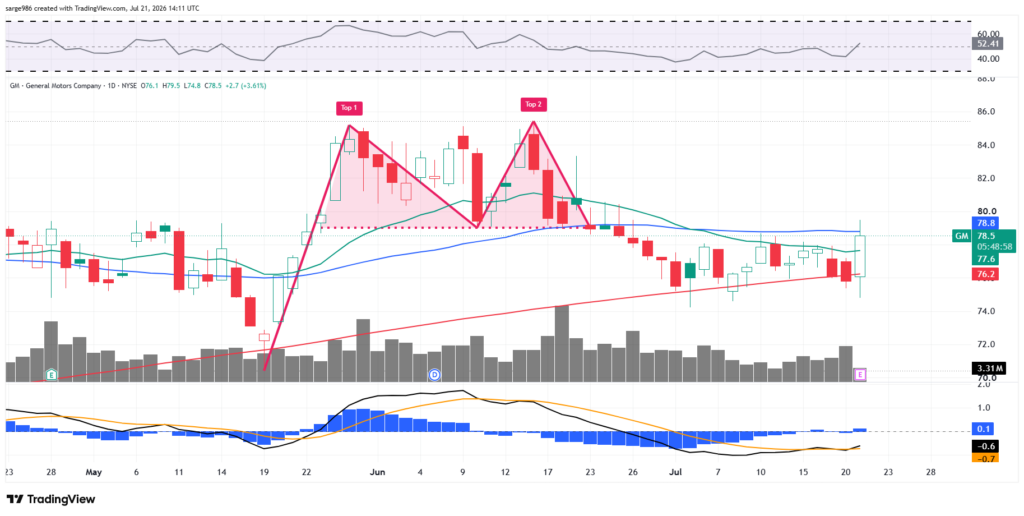
Readers will see that GM put in a double-top (kind of a triple-top) pattern of bearish reversal that worked like a charm this past spring. Since then, the stock has found consistent support at its 200-day SMA as professional managers have held firm while the swing crowd tried to break the stock. The upside pivot as both the RSI and daily MACD suddenly show strength, would be the 50-day SMA. The swing guys likely cracked when the 21-day EMA did. The pros will increase exposure should the stock take and hold that thin blue line.
Trade Idea
Bull call spread (minimal lots):
-Purchase one August 21 $79 call for about $3.40
-Sell (write) one August 21 $85 call for roughly $1.30
Net debit: $2.10
Note: The idea is to risk a net (max loss) $2.10 up front to try to win back $6.00 in a month’s time for a profit of $3.90 (+86%, max profit).
At the time of publication, Guilfoyle had no positions in any securities mentioned.
