Netflix Shares Get Ready to Pop While Bond Prices Drop
Today was a pathetic excuse for a rally. But here’s what I’m watching.
You've reached your free article limit
You've read 0 of 1 free Pro articles.

The Market
Well, that was a pathetic excuse for a rally. I don’t think there was much more selling today, but the buyers were very selective. I mean, the NYSE volume was the lowest since the waning days of April.
Nasdaq’s volume was better, but more than ten percent of it was in three penny stocks, so I’m not sure that’s exactly a vote of confidence either. But the lack of buying or selling means we did not see the indicators change much.
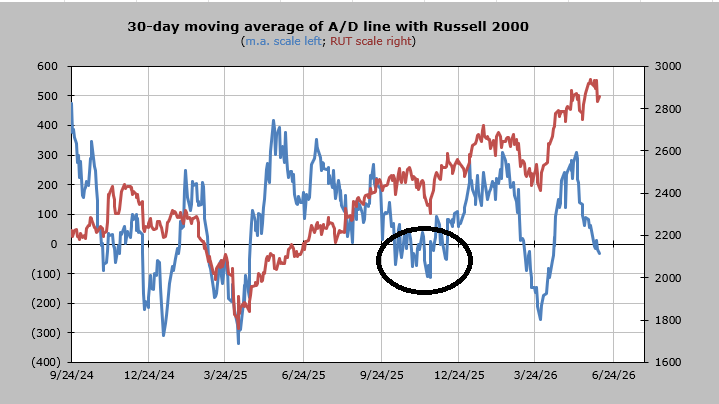
The one indicator I have my eye on is the 30-day moving average of the advance/decline line. It is finally under the zero line. The math behind it says it ought to be more choppy than anything else over the next month or two. When I look at it (shown below), and I see the math behind it I am of the mind that it could spend the next few months similar to the way it was last fall: hovering back and forth over the zero line.
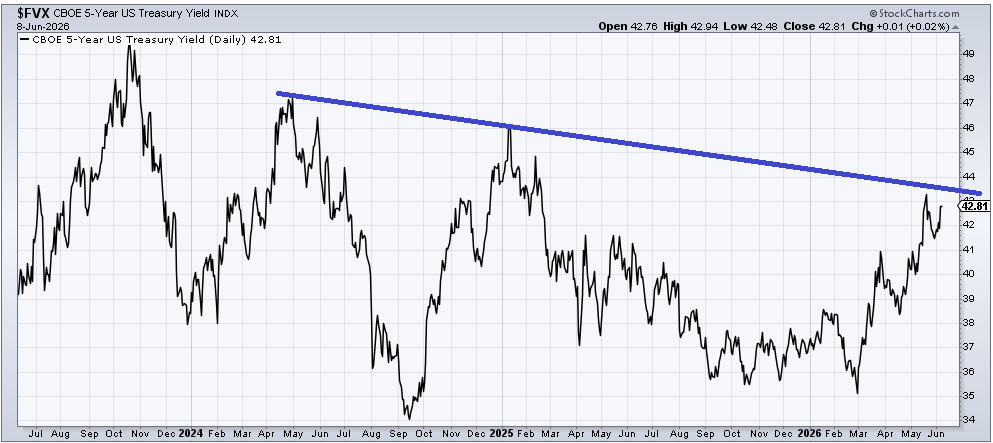
But we must also discuss interest rates. It has been my contention (for three years now!) that rates are more apt to stay in a wide range, sometimes they will sneak out on the downside, and sometimes they will do it on the upside, but they are unlikely to go anywhere special.
I am still in that camp. However, the yield on the Five-Year is getting rather close to a breakout over that line. I do think if it crosses it (currently around 4.35%), we could see a quick run to 4.50-4.60%.
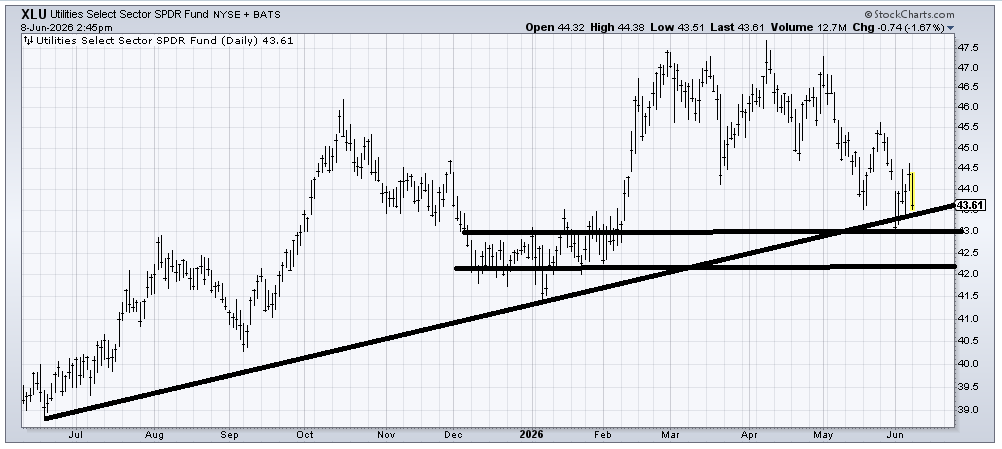
One reason I have begun to focus on this is because the Utes, which had a decent week last week, can’t seem to get any traction for more than a handful of days, despite getting oversold and being at/near support.
I’d love to see the market down again this week, so at least we can push the market back to a short-term oversold reading next week.
New Ideas
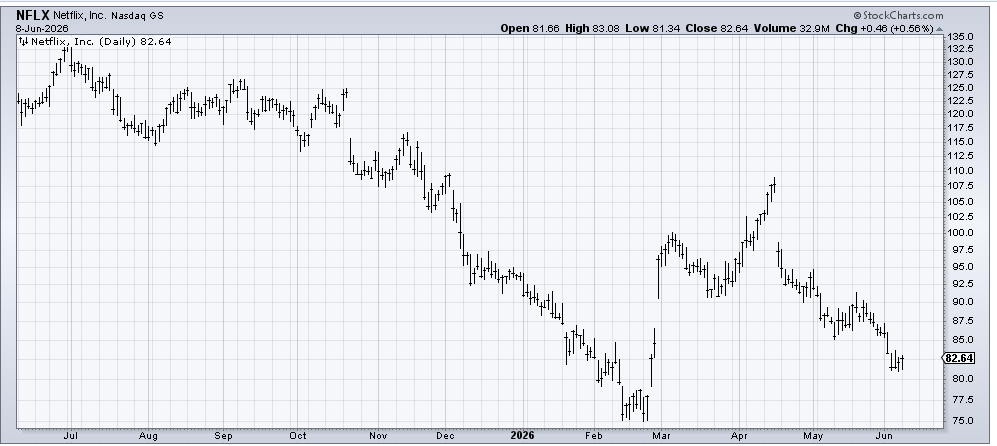
Since I was asked about Netflix (NFLX) again today, I want to reiterate what I said last week. I would love to see a trip down into that 78-ish area (to fill that gap from February), but somewhere in the area between here and there, I think the stock is set up for a bounce.
Today’s Indicator
The 30-day moving average of the advance/decline line is discussed above.
Q&A/Reader’s Feedback
Helene welcomes your questions about Top Stocks and her charting strategy and techniques. Please send an email directly to Helene with your questions. However, please remember that TheStreet.com Top Stocks is not intended to provide personalized investment advice. Email Helene here.
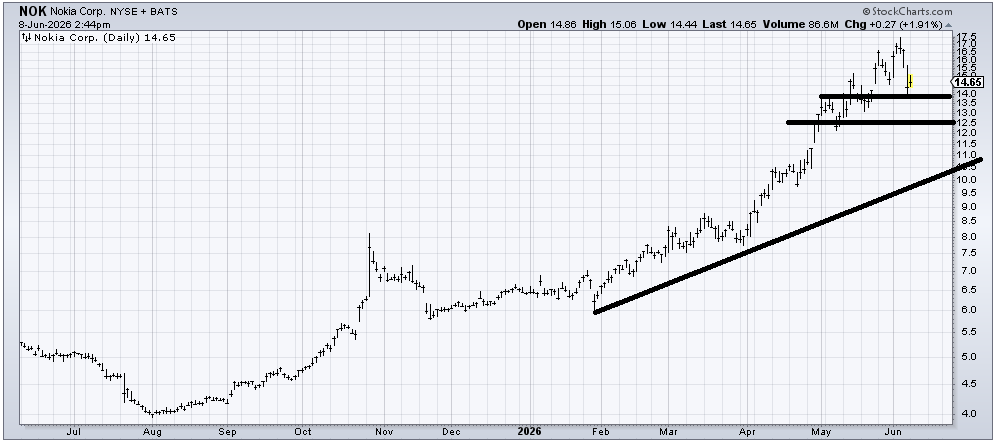
I suspect Nokia (NOK) will come down into that 12-13 area before this correction is done. If it breaks under 12, I would consider that bearish for a trip down to that lower line, which would be about a 70% decline from the highs. It’s just not my kind of chart.
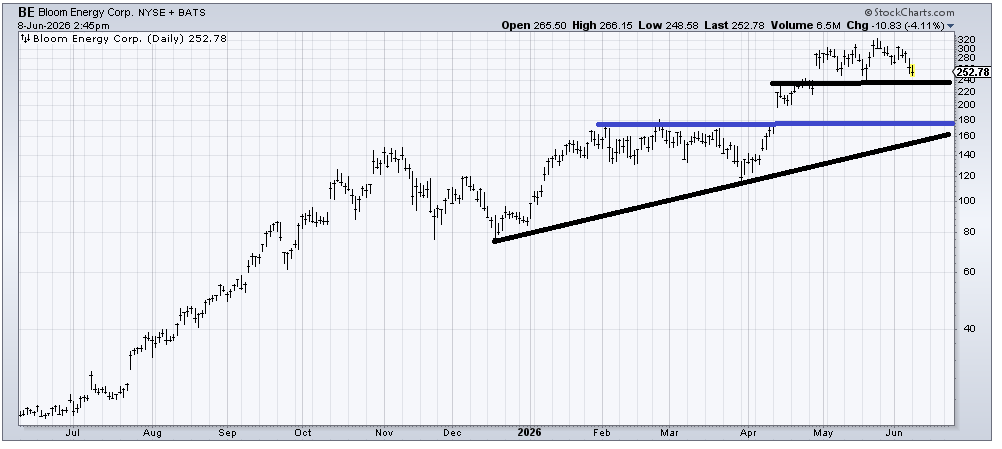
Right now, Bloom Energy (BE) looks like a smaller version of the pattern that developed in the first quarter of this year. So if 240 breaks, I’d look for a test of that 180-ish area. And if there is a test of 180-ish about a month or so from now, it will intersect with the uptrend line, which would likely end up being a good place to buy it.
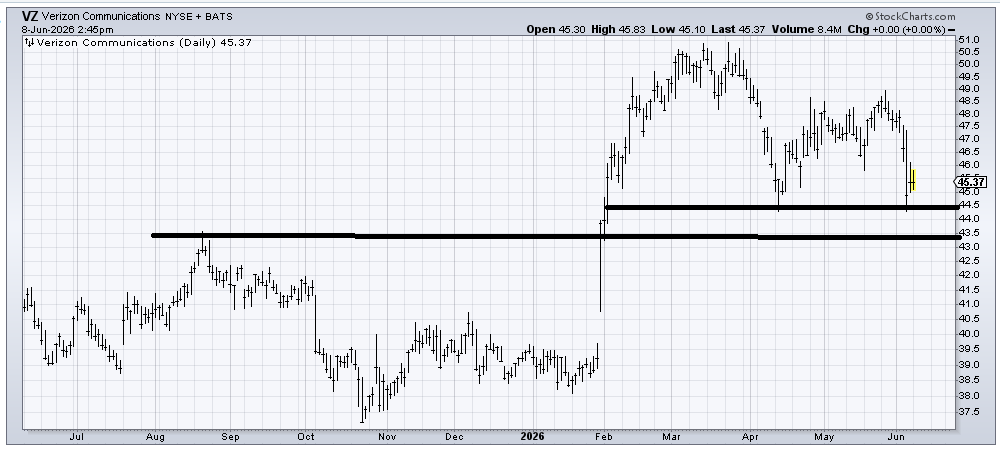
Verizon (VZ) is a bit oversold down here, but I wouldn’t be shocked if it comes into that 43-44 area before bouncing. I am not a fan of the chart with its lower high. However, if it can go sideways and develop some sort of basing pattern, I could warm up to it again.
I keep thinking XLU (XLU) will hold this 43-ish area and give us a decent rally, but so far, all it does is rally to a lower high. If you wanted to wait until the pattern proves itself, I would not blame you at all, since the chart has lower lows and lower highs.