Chart of the Day: Checking In on a Struggling Palantir
The stock continues to perform poorly but is trying to find a bottom.
You've reached your free article limit
You've read 0 of 1 free Pro articles.
Being patient is not always the best trait for an investor, but when a stock gets punished for being part of a group it may be the best choice.
Palantir (PLTR) has been struggling to hold up since peaking in 2025, with a long series of lower highs and lower lows. After reaching the $200 mark it’s been a slow and painful bleed for shareholders, the stock having lost 40% of its value in about nine months.
Since then PLTR has barely seen the light of day, only bullish for a handful of days (teal or blue candles) and then reverting back to bearish. It is not clear why this stock continues to get punished day after day, but the chart tells us there is no reason to buy.
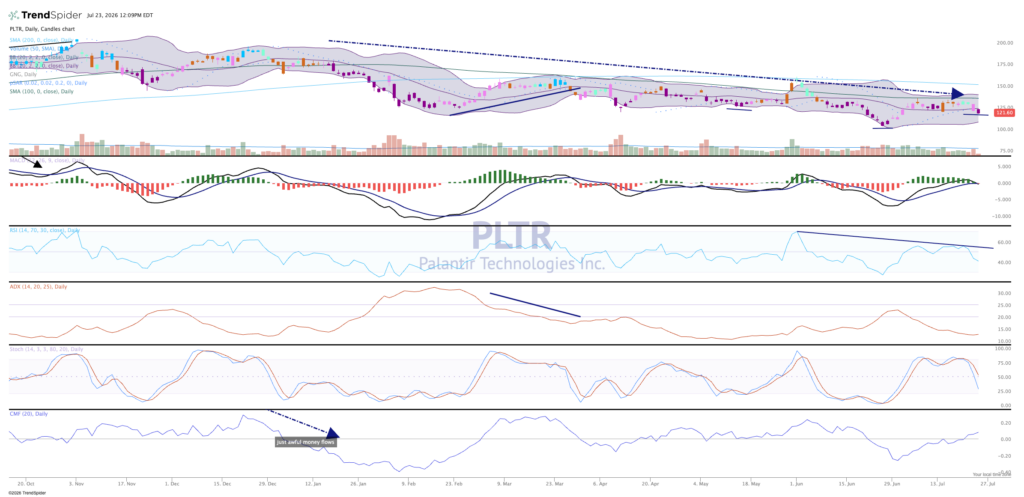
The 200-day moving average is starting to bend lower (top blue line), and now the MACD has rolled over to a sell signal. Stochastics are weak and signaling the momentum is down, but money flow is curiously positive. Certainly something good here, right?
In trying to decipher the chart there is an inverse head/shoulders working, but a move above the neckline at $140 would be needed to engage this pattern. It is a stretch, but is clearly forming.
We like Palantir in TheStreet Pro Portfolio and rate it a One, or “buy at anytime.”
More Pro Portfolio:
- Trimming One Holding, Adding to Another as We Boost Our Rating
- We’re Tracking 23 Signals Across 10 Portfolio Investing Strategies
- Weekly Roundup: Chip Rout Tests the Market, but Here’s How We Aim to Capitalize
At the time of publication, TheStreet Pro Portfolio was long PLTR.
