Markets Deal With a Long and Winding Road
Let's start a new journey charting the markets, with a little help from The Beatles. Along the way we'll visit my favorite names in the top three sectors and the one sector to avoid.
You've reached your free article limit
You've read 0 of 1 free Pro articles.
I’d like to thank everyone for your great feedback on last week’s “Road Trip” articles, which can be found here and here. I hope you enjoyed reading them as much as I enjoyed writing them.
Before making investment decisions, it’s always a good idea to step back and look at the big picture. Let’s start a new journey with a fresh set of charts, and a setlist of tunes featuring some band from Liverpool.
S&P 500: 'Baby You're a Rich Man' by The Beatles
The S&P 500 and the Dow Jones Industrial Average remain the two strongest indexes. Both reached fresh all-time highs last week. In fact, their weekly charts are virtually identical, but I’ll give a slight edge to the S&P 500.
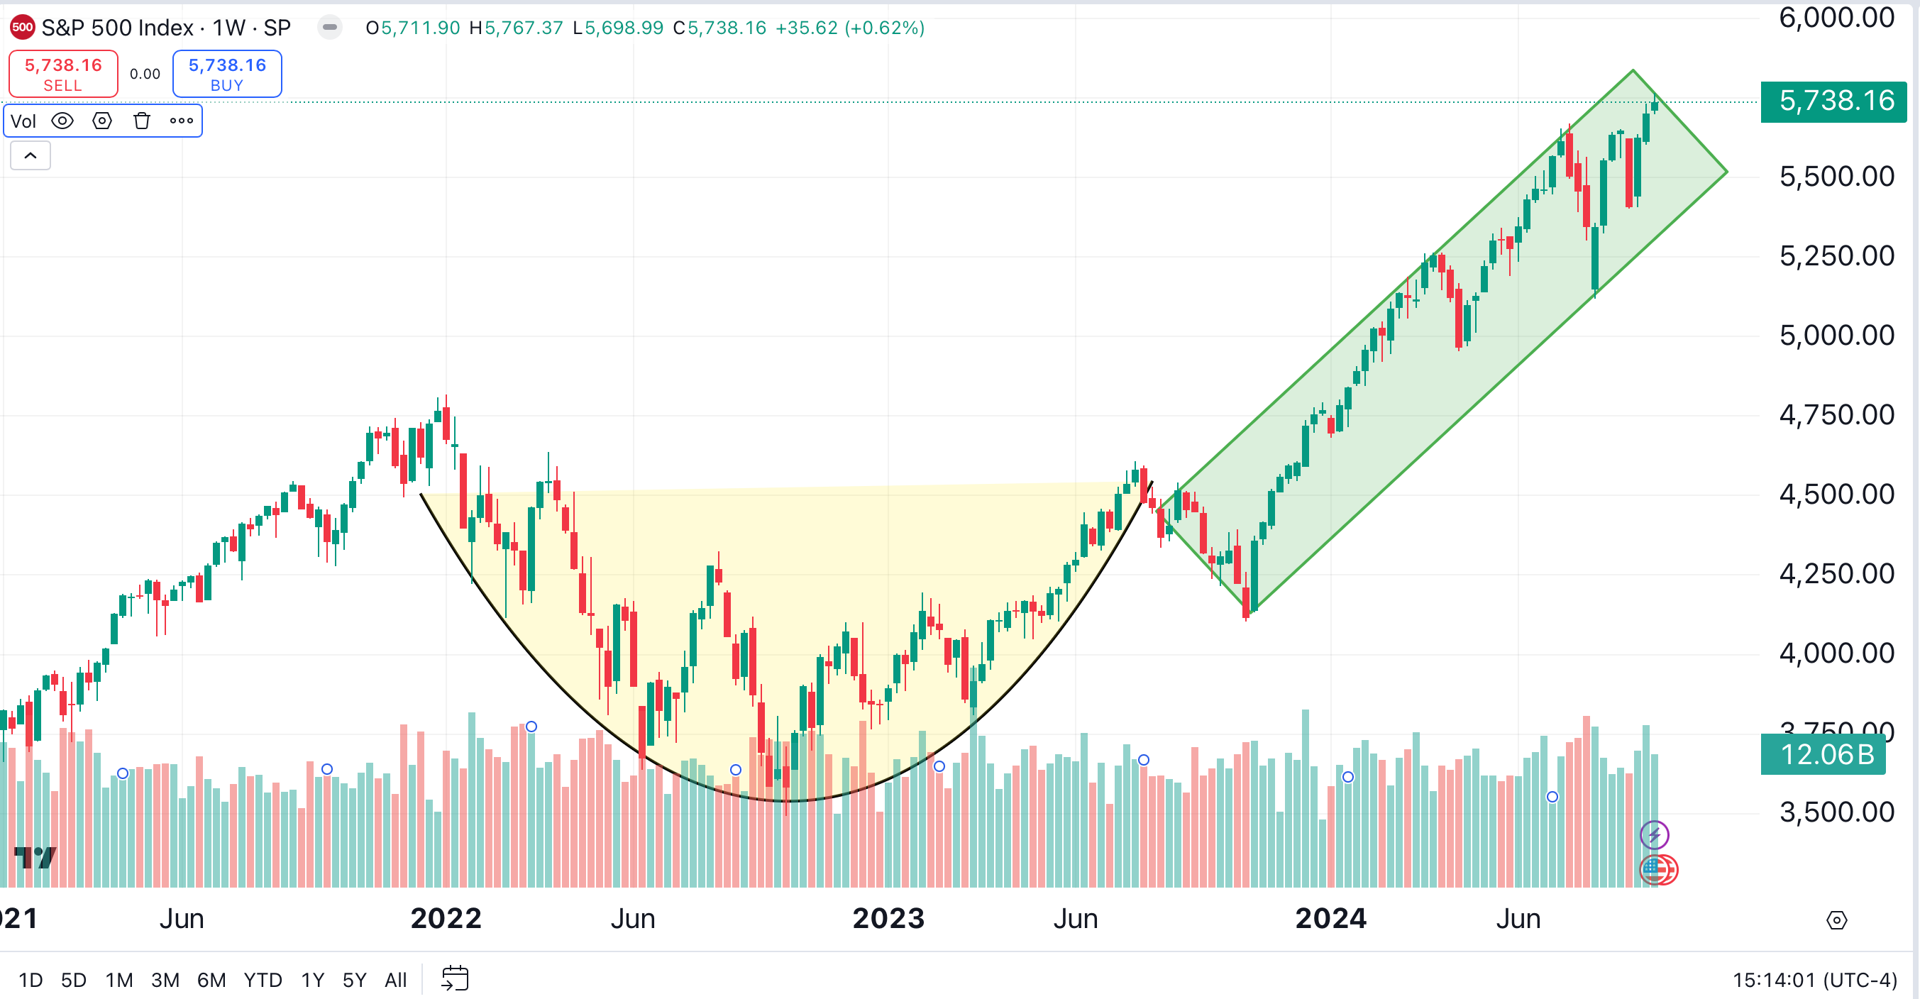
The S&P 500 continues to provide stellar returns. The index has gained 21% year-to-date, 33% over the past twelve months, and 93% over the past five years.
Dow Jones Industrial Average: 'Don't Let Me Down' by The Beatles
The Dow Jones Industrial Average is keeping pace, reaching a new all-time high last week In fact, in the just-ended third quarter, the Dow was the top-performing major U.S. index.
Dow Jones: +8.2%
S&P 500: +5.5%
NASDAQ: +2.6%
Despite trading at fresh all-time highs, the Dow’s weekly relative strength index (RSI) isn’t yet overbought (arrow). Can the staid old index maintain its torrid pace?
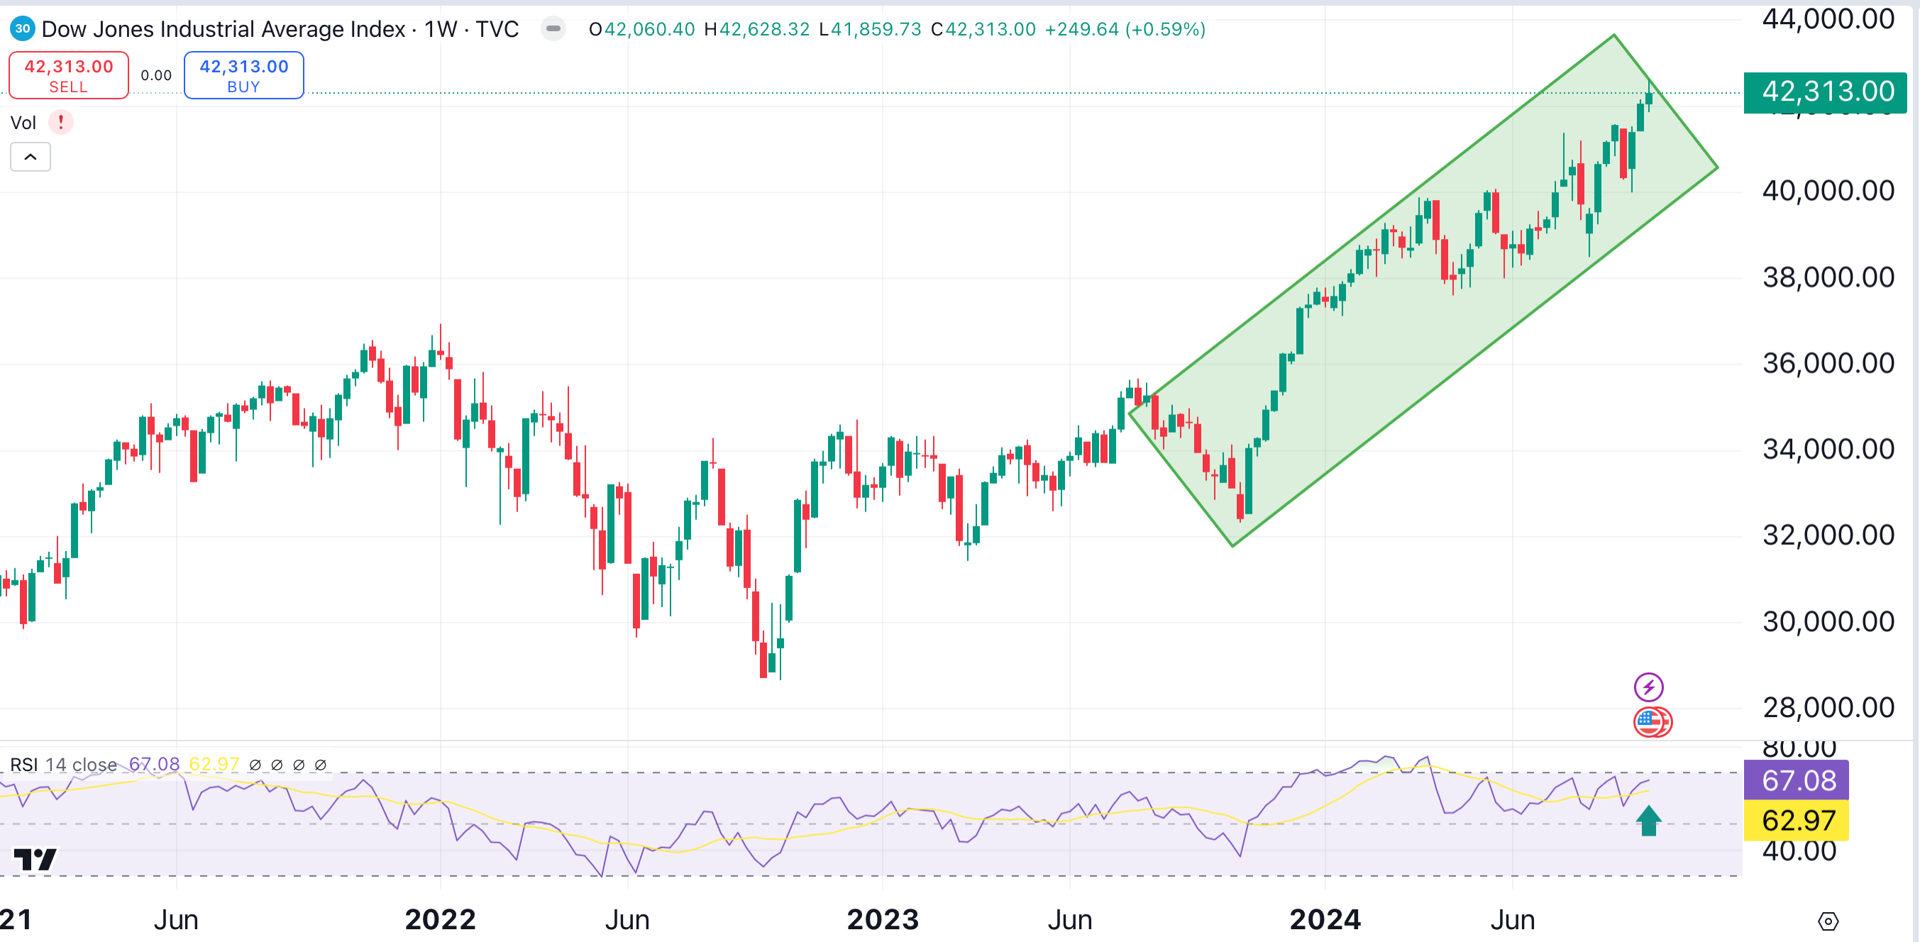
With a return of 12% year-to-date, 26% over the past twelve months, and 57% over the past five years, the Dow remains a steady winner.
Nasdaq 100: 'Get Back' by The Beatles
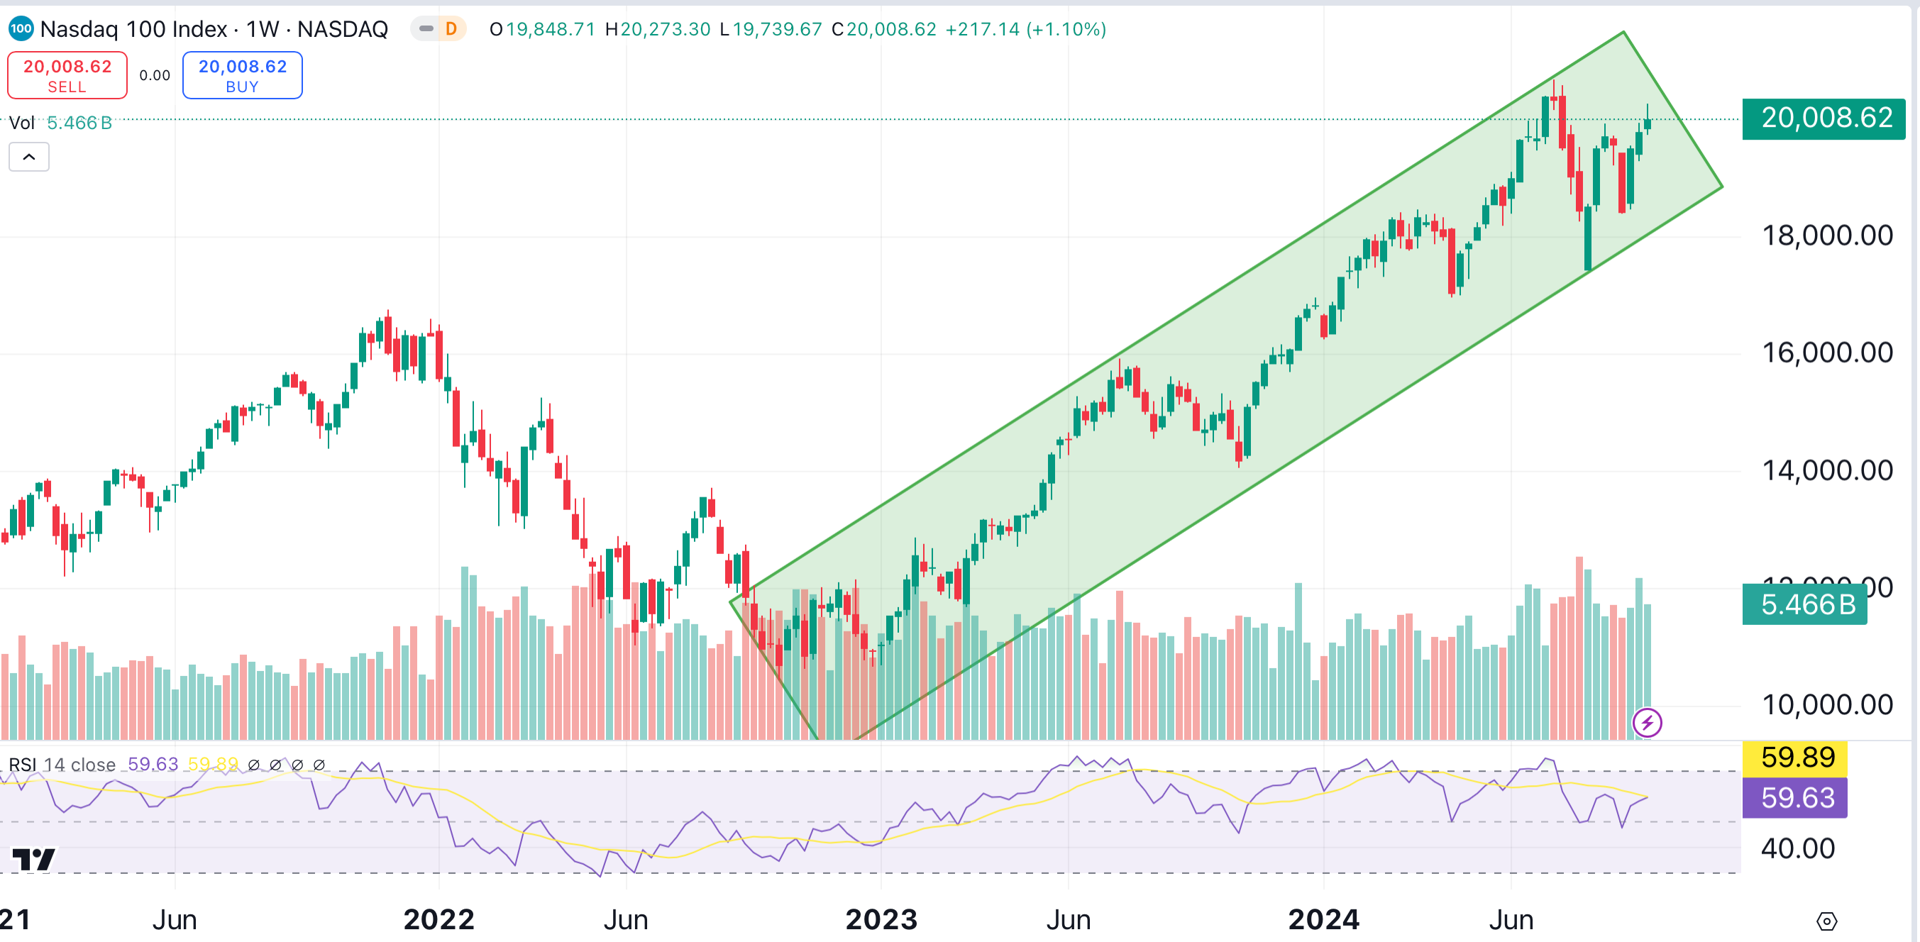
Nasdaq bulls made their presence felt last week, after a stellar earnings report from Micron Technology MU. The overall picture for the tech-heavy index remains strong.
That said, the Nasdaq 100 can’t seem to "get back" to its July highs. The index is still demonstrating relative weakness compared to the S&P 500 and the Dow Jones Industrial Average.
Russell 2000: 'Help!' by The Beatles
The Russell 2000 was the only major index to finish in the red last week. Compared to the other major indexes, the Russell 2000 has gone nowhere, man.
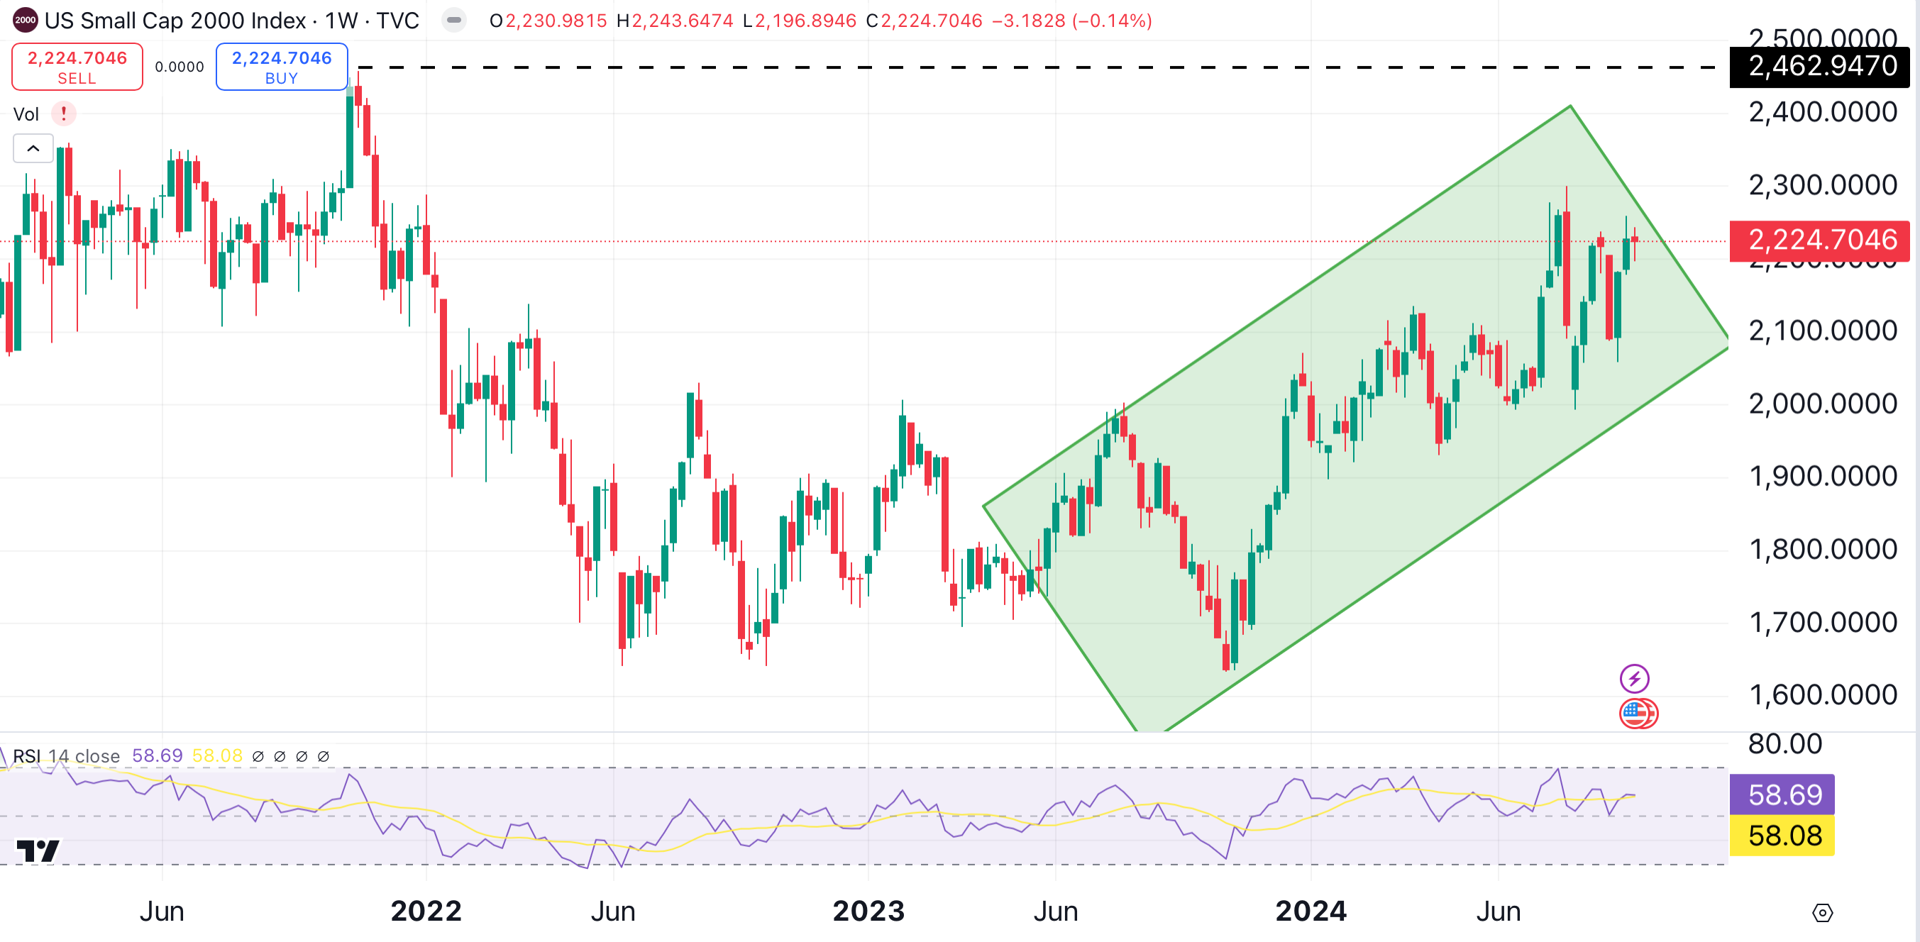
Chart of the Week
CSI 300: 'Revolution' by The Beatles
China’s so-called Bazooka stimulus plan has lit up the CSI 300, an index that charts the performance of the 300 biggest stocks on the Shanghai and Shenzhen stock exchanges. As a result, the CSI 300 has gained about 30% in just over a week.
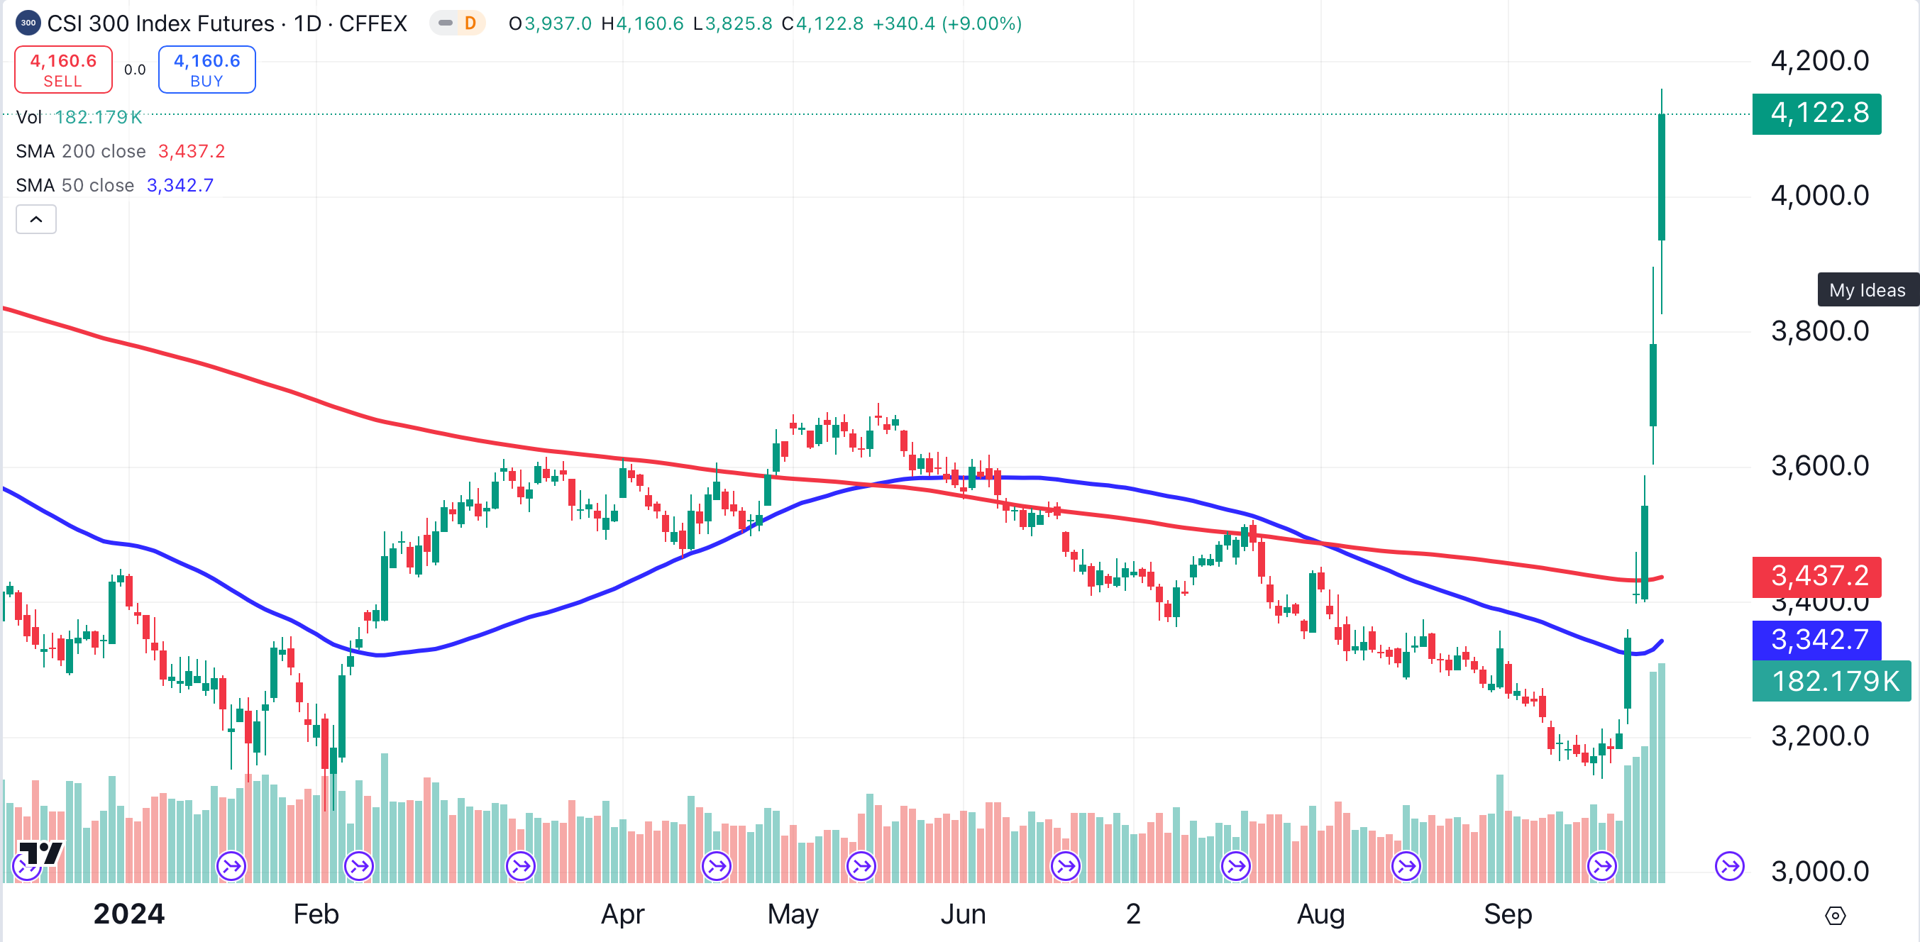
Fun fact: Including this incredible move, China’s CSI 300 Index has gained a total of just 5% in the past five years.
China’s bazooka stimulus is incredibly bullish for global markets, but we have to ask: Is this rally merely a sugar rush that will soon fade? China would have no need for such a vast stimulus package if all was well with the Red Dragon, as explained here.
Top Three Sectors
Communications Sector: 'Long, Long, Long by The Beatles
Since the start of 2023, the Communication Services Select SPDR XLC has gained an impressive 87%. On Tuesday, the bellwether ETF closed at a fresh all-time high.
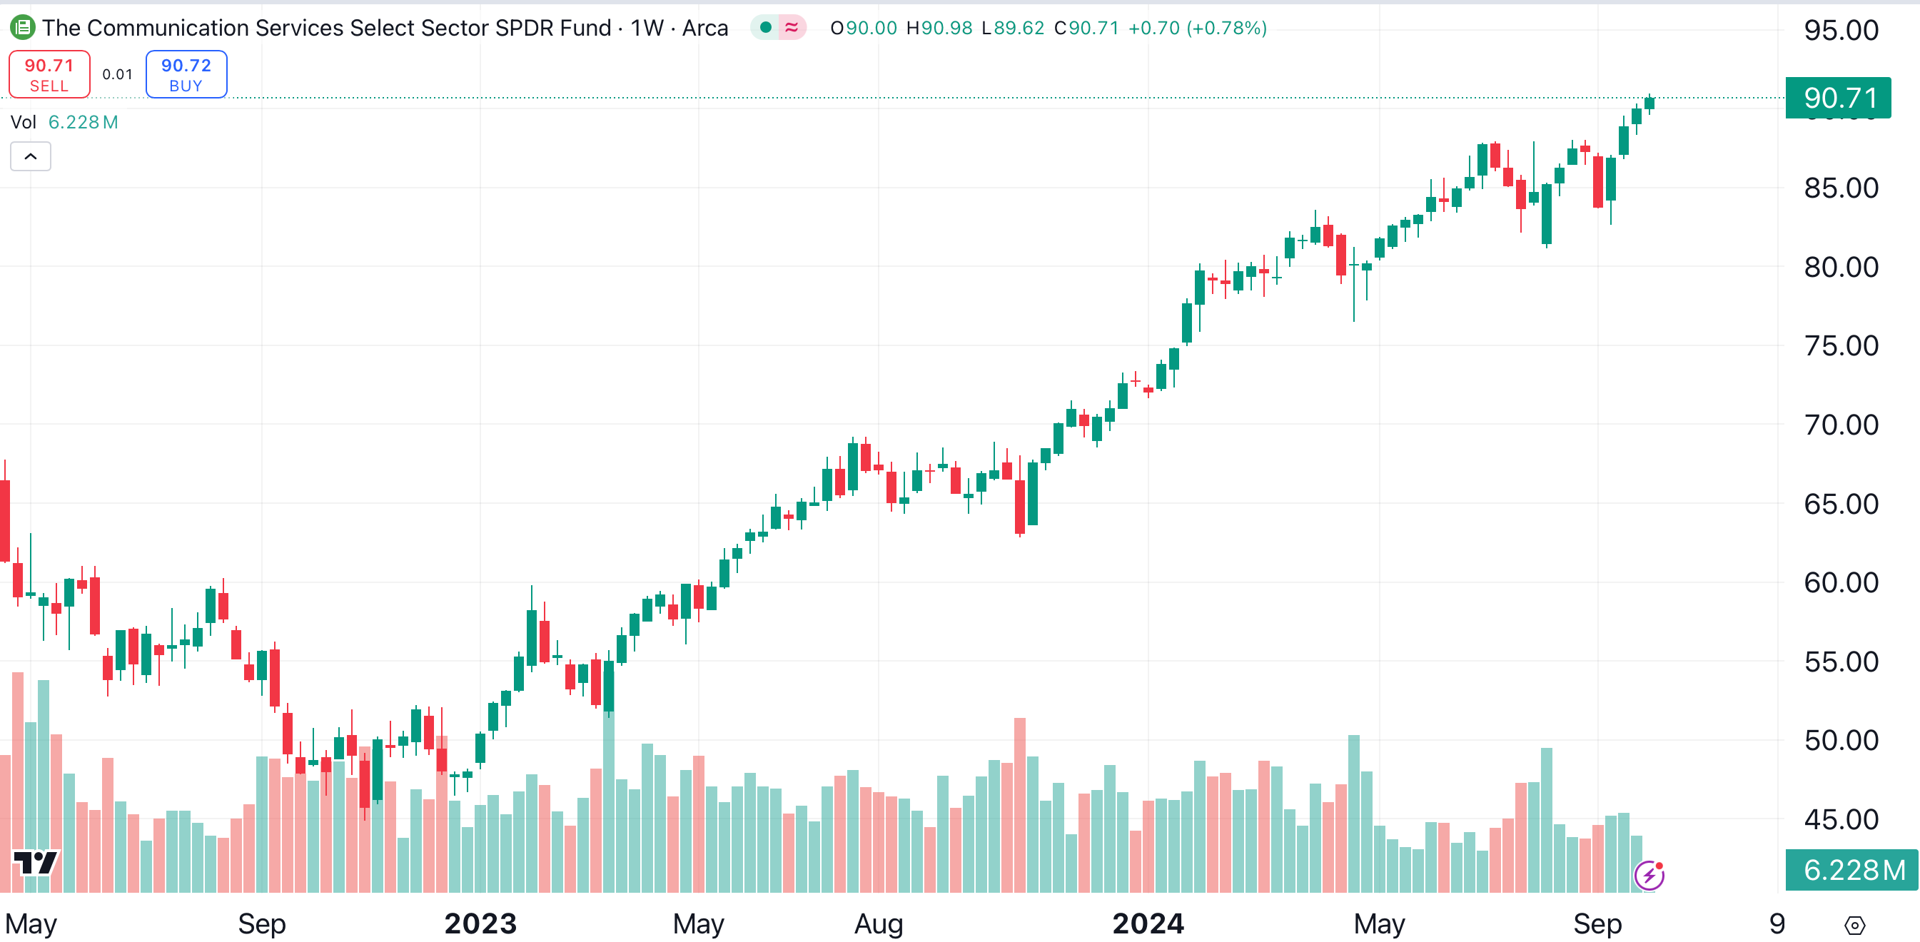
Top holdings for this ETF include Meta Platforms META, which traded at an all-time high on Tuesday, as well as Alphabet GOOGL, and Netflix NFLX.
Utilities: 'The Inner Light' by The Beatles
Utilities remain a top-performing sector. The SPDR Select Utilities ETF XLU, a bellwether for the sector, reached another all-time high this week.
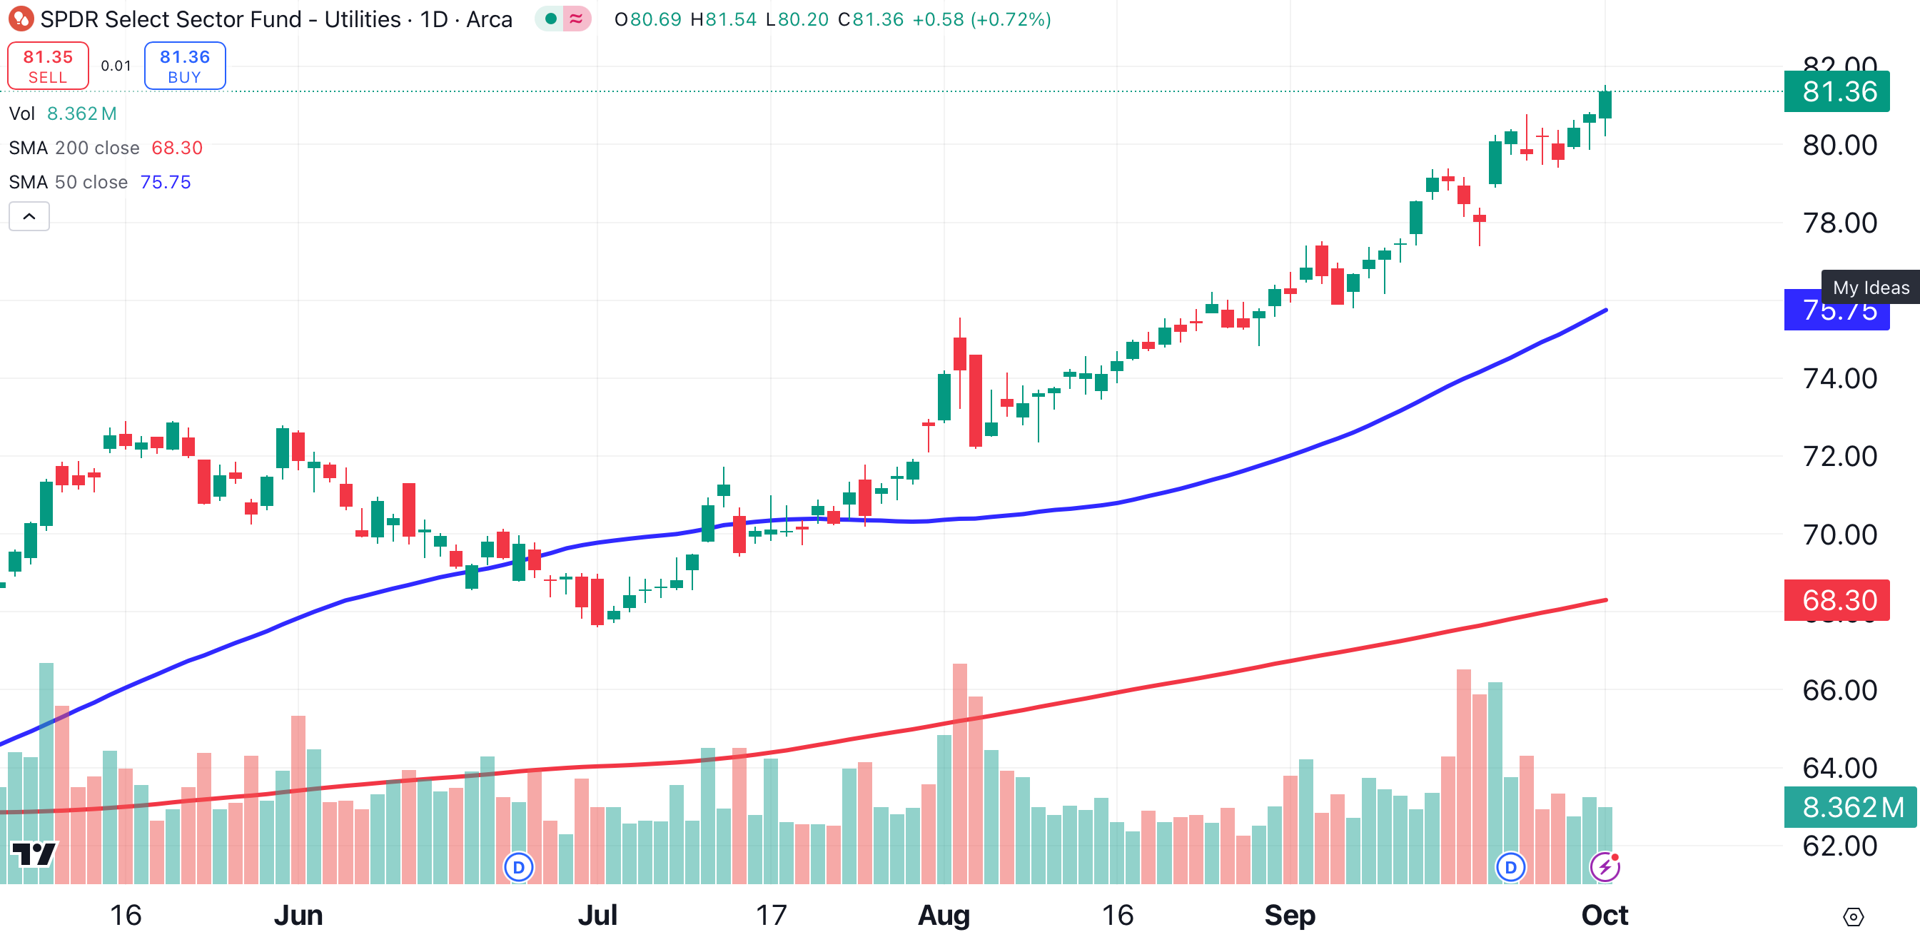
Last week’s news that a Three Mile Island reactor would be restarted turned heads, and now the Department of Energy has approved a plan to restart the Palisades Nuclear Plant in Michigan.
Materials Sector: 'Fixing a Hole' by The Beatles
The materials sector, represented here by the Materials Select SPDR XLB, has successfully broken out from a huge ascending triangle (green dotted lines).
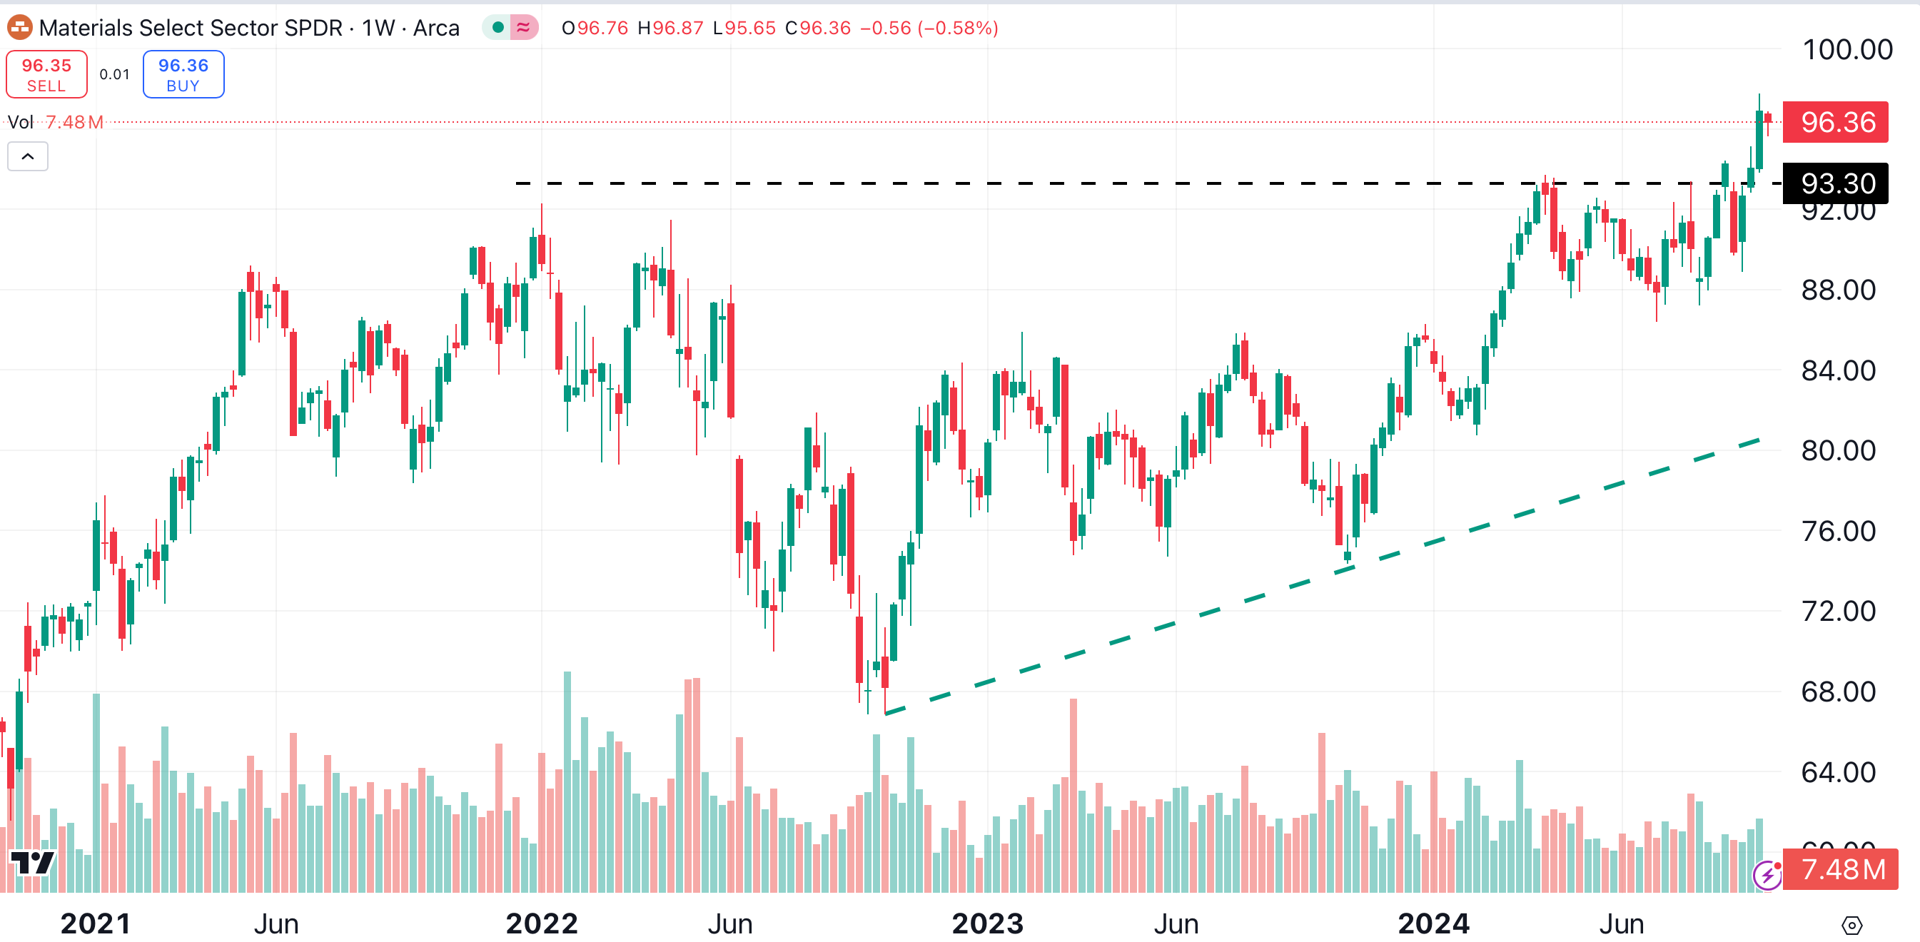
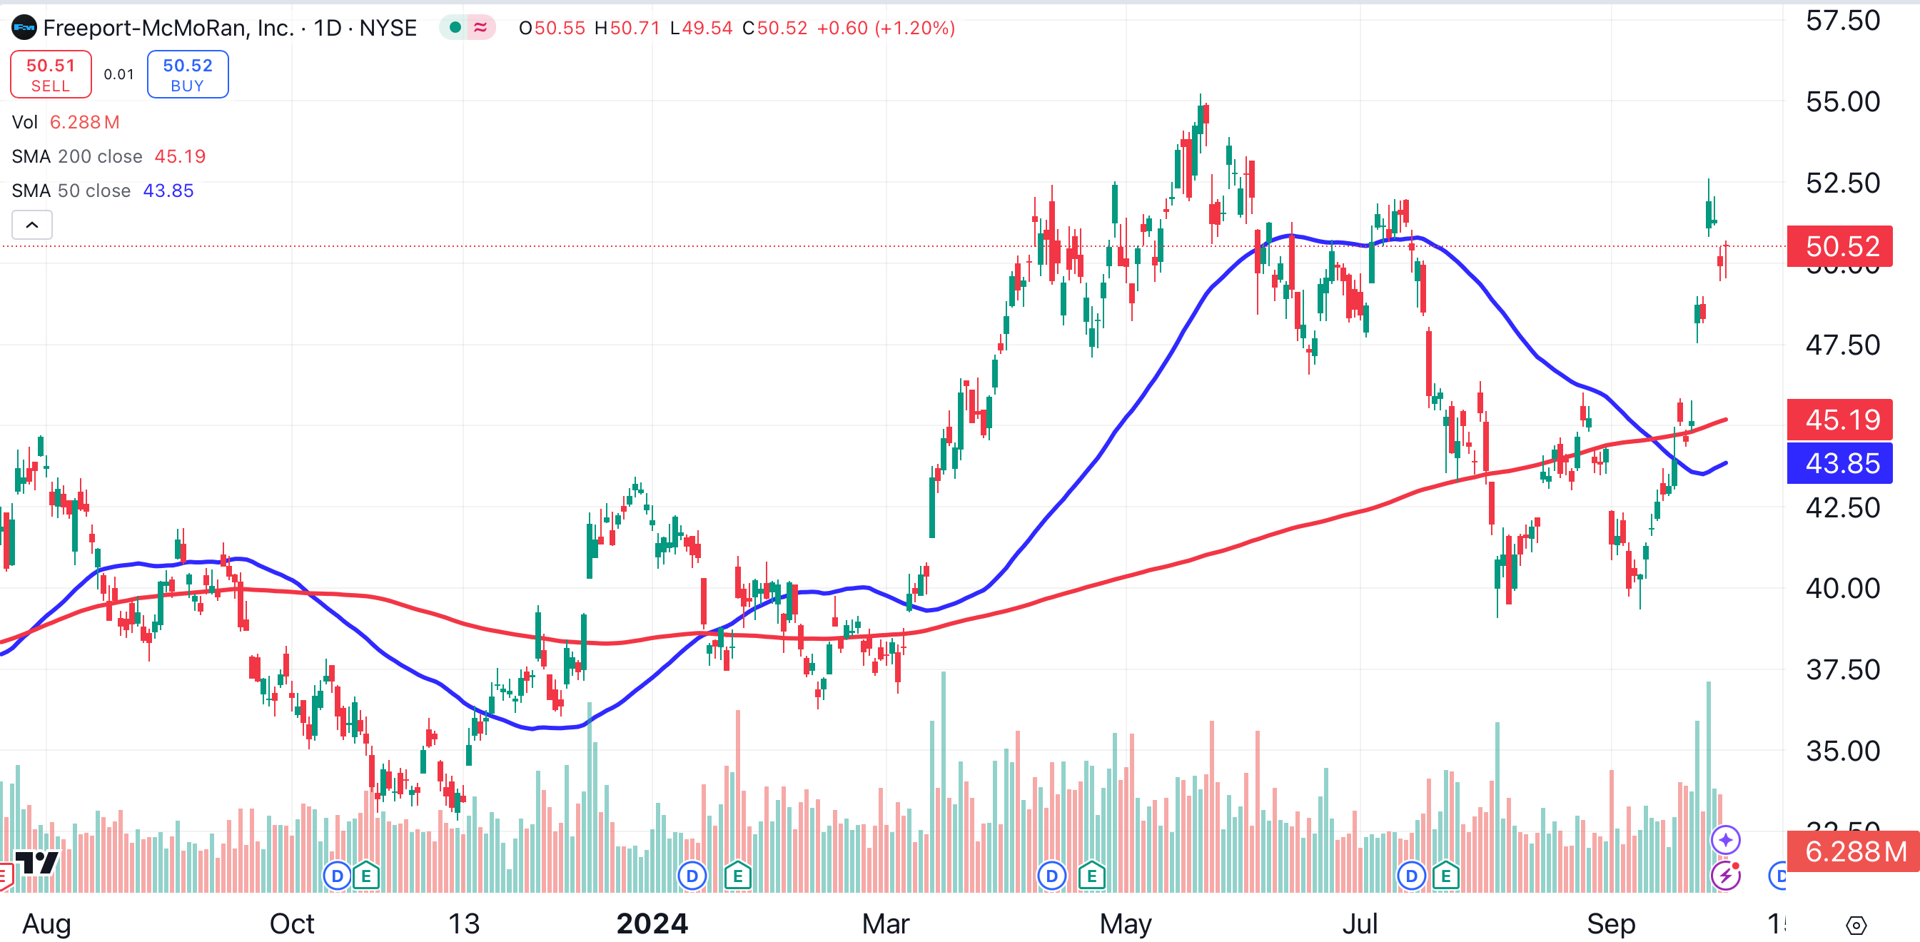
My favorite name in this sector is mining giant Freeport-McMoRan FCX. Freeport has gained 22% over the past month.
Those are my three favorite sectors for this week. Meanwhile, here’s one to avoid for now.
Philadelphia Semiconductor Index: 'Helter Skelter' by The Beatles
Last week, we alerted readers to a potential head-and-shoulders pattern forming on the Philadelphia Semiconductor Index (SOX). The pattern has significant size, as it started forming in January, but a head and shoulders can’t be considered complete until it breaks the neckline.
For the SOX, that neckline lies at 4400 — far below Tuesday's close of 5024.
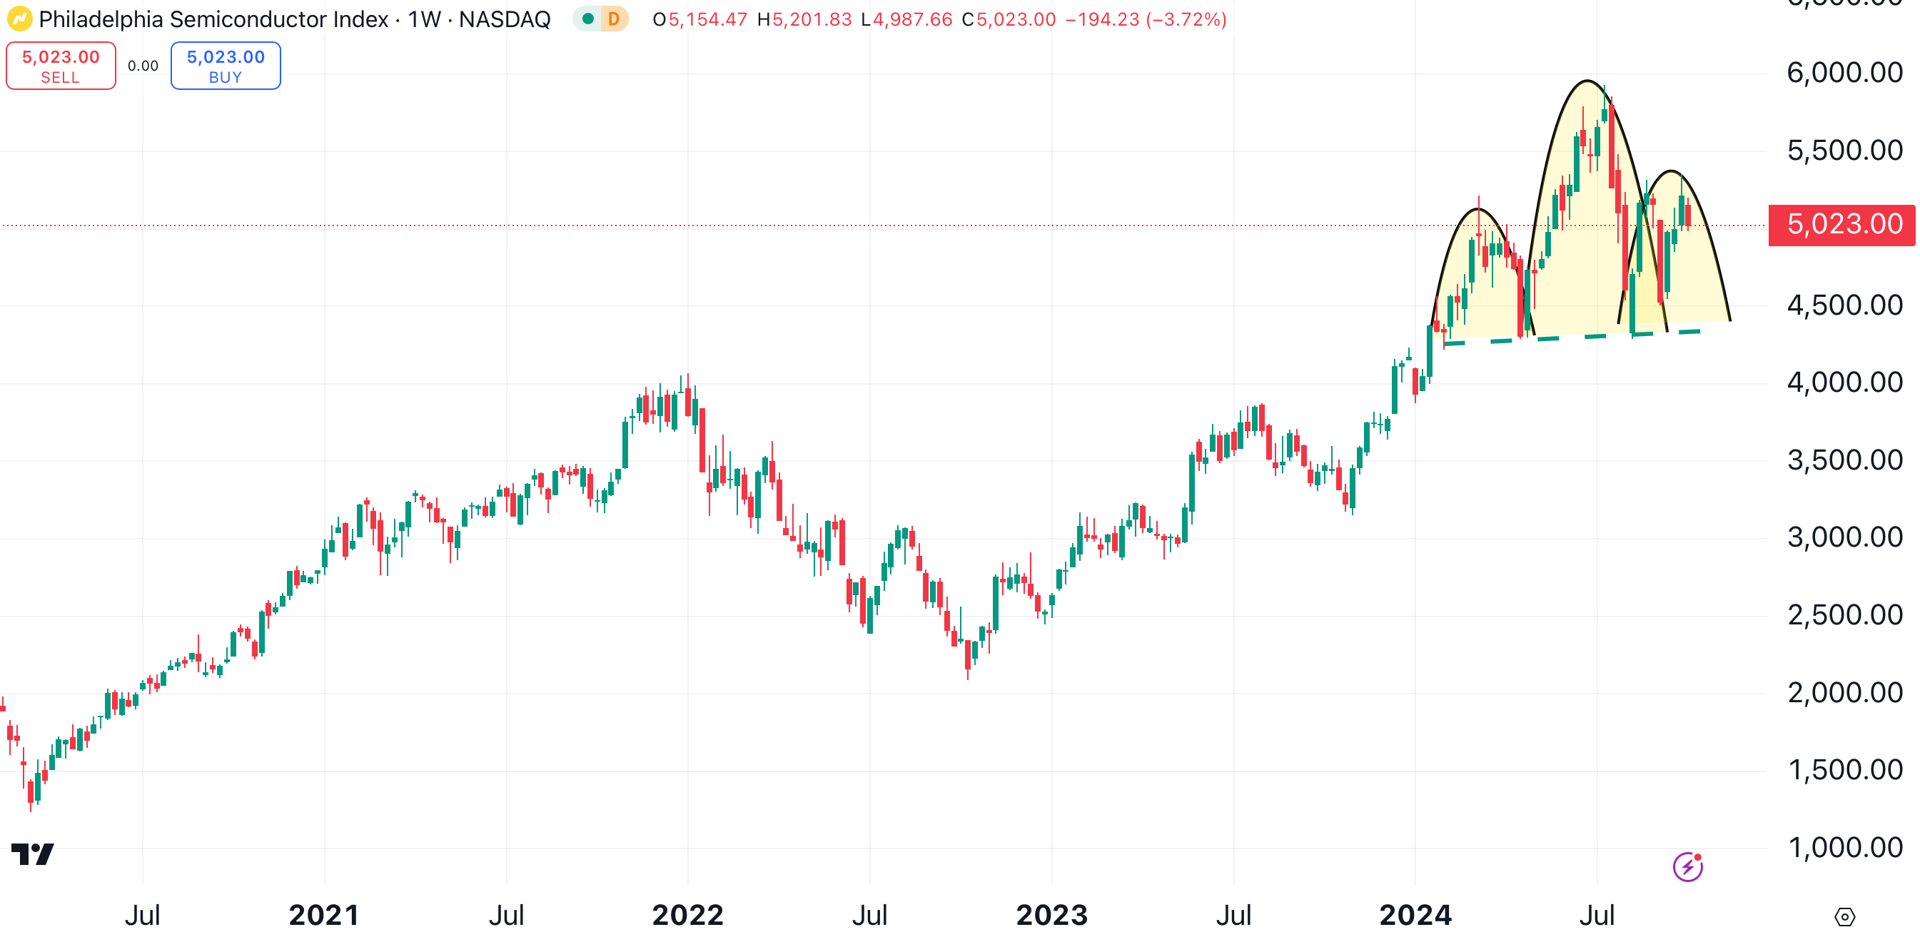
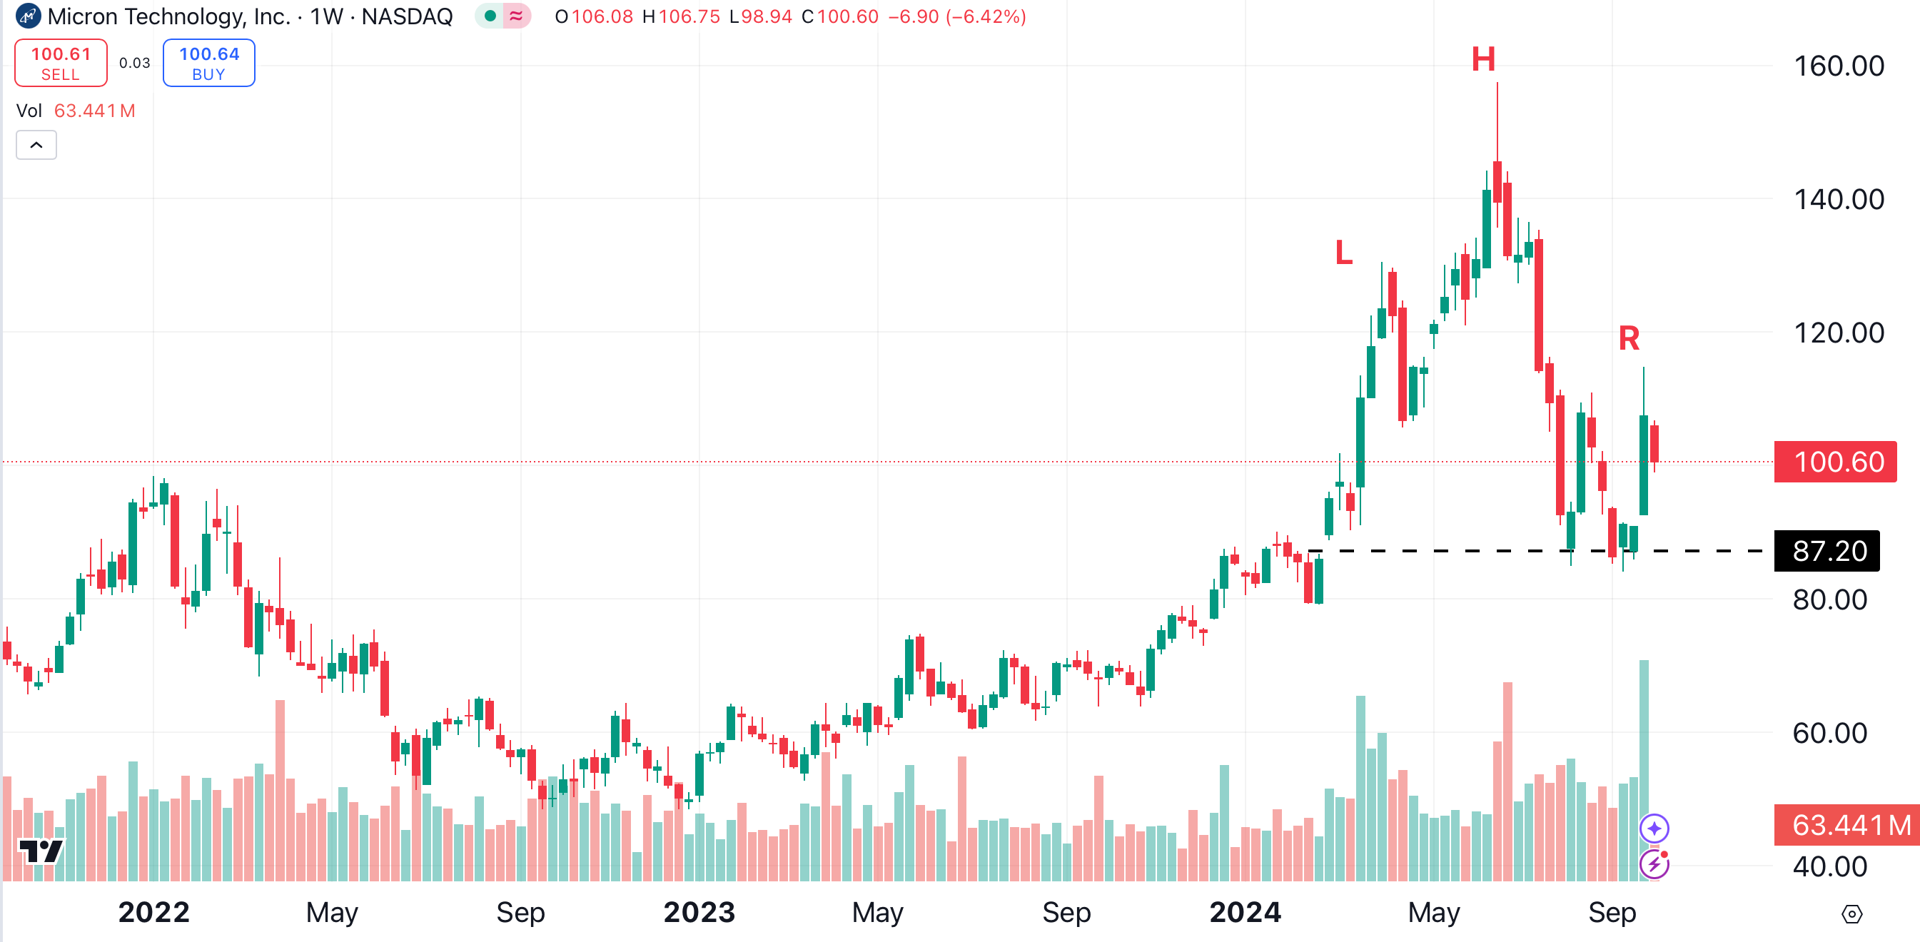
The semis had a big week, thanks in part to a strong earnings report from Micron MU. This would seem to make it less likely that the SOX index will return to 4400. But before you write this bearish pattern off, take a look at Micron’s weekly chart.
Despite its recent rally, Micron’s chart is still bearish. A head-and-shoulders pattern (L-H-R) appears to be forming here as well.
Worse, the stock has given back most of its post-earnings pop. Micron has fallen from $114 to $100 over the past four sessions.
Nvidia NVDA, hero of the Magnificent Seven, is consolidating its sizable gains. Nvidia peaked in June, and has formed a symmetrical triangle (green dotted lines).
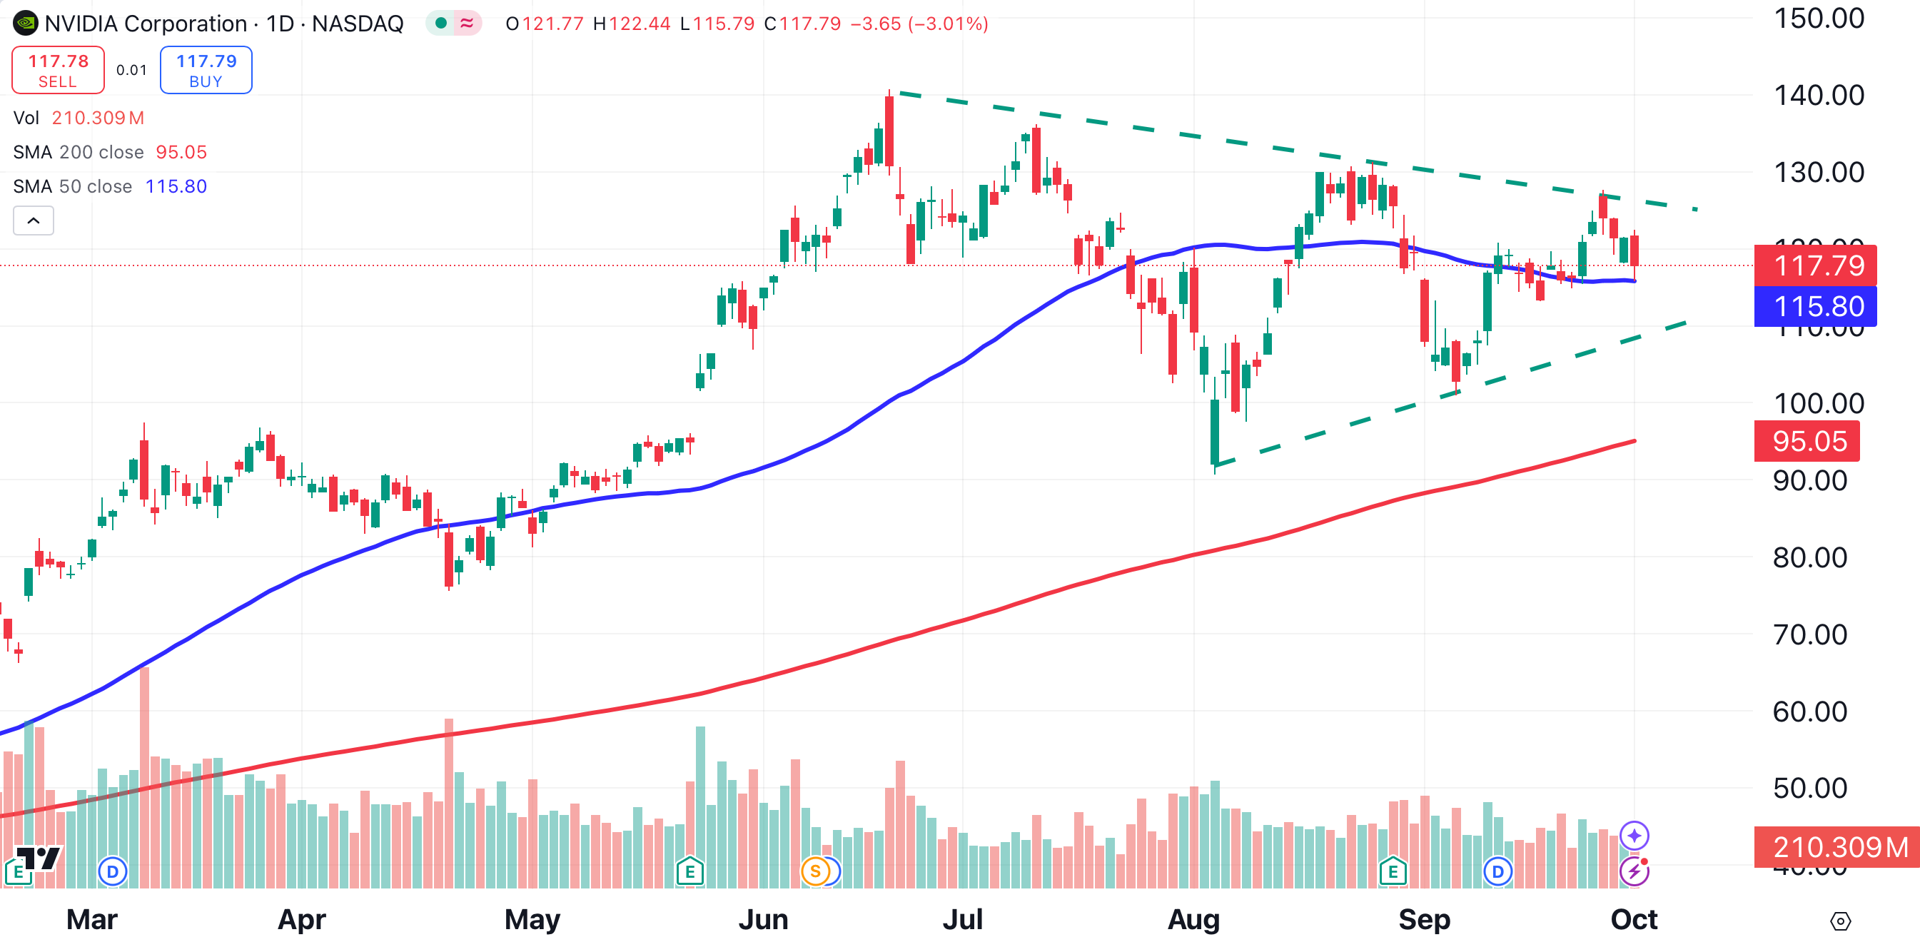
This consolidation is to be expected, considering Santa Clara-based Nvidia’s outsized gains:
2024 year to date: 144%
Twelve-month gain: 166%
Five-year gain: 2,486%
The charts suggest that the semiconductor sector may not be out of the woods yet. Potentially bearish patterns for the index and one of its leaders, Micron, along with a consolidation pattern for market favorite Nvidia, means investors should avoid this sector for the time being.
At the time of publication, Ponsi was long FCX.