A Road Trip Through the Markets
Fire up the engine and blast the tunes, it's time to hit the highway for a look at the major indexes, the strongest sectors and the most intriguing chart of the week.
You've reached your free article limit
You've read 0 of 1 free Pro articles.
Investors wonder how supply, demand, fear, and greed will affect our portfolios. Unfortunately, we can become so focused on minutiae that we ignore the roadmap right in front of us.
Today, we’ll focus on that map. We’ll start with the biggest interstate roads, and work our way down to the local highways. We even have a playlist, so let's hit the road!
The S&P 500 — "Interstate Love Song" by Stone Temple Pilots
The busiest and most important roads in the U.S. are its collection of interstate highways. The main artery of the market — its version of I-5 on the West Coast, or I-95 for those of us in the East — is the S&P 500.
The good news for investors is that the S&P 500 has gained 20.88% year-to-date. This edges out the Nasdaq 100 (20.56%), and soundly beats the Dow Jones Industrial Average (11.91%), and the Russell 2000 Index (10.58%) in the year-to-date category.
Looking at the S&P 500 weekly chart, we can see that a rounded bottom formed in 2022/2023 (shaded yellow), which dissolved into a bull channel (shaded green) in 2023/2024. On Monday, the large-cap index closed at an all-time high for the 40th time this year.
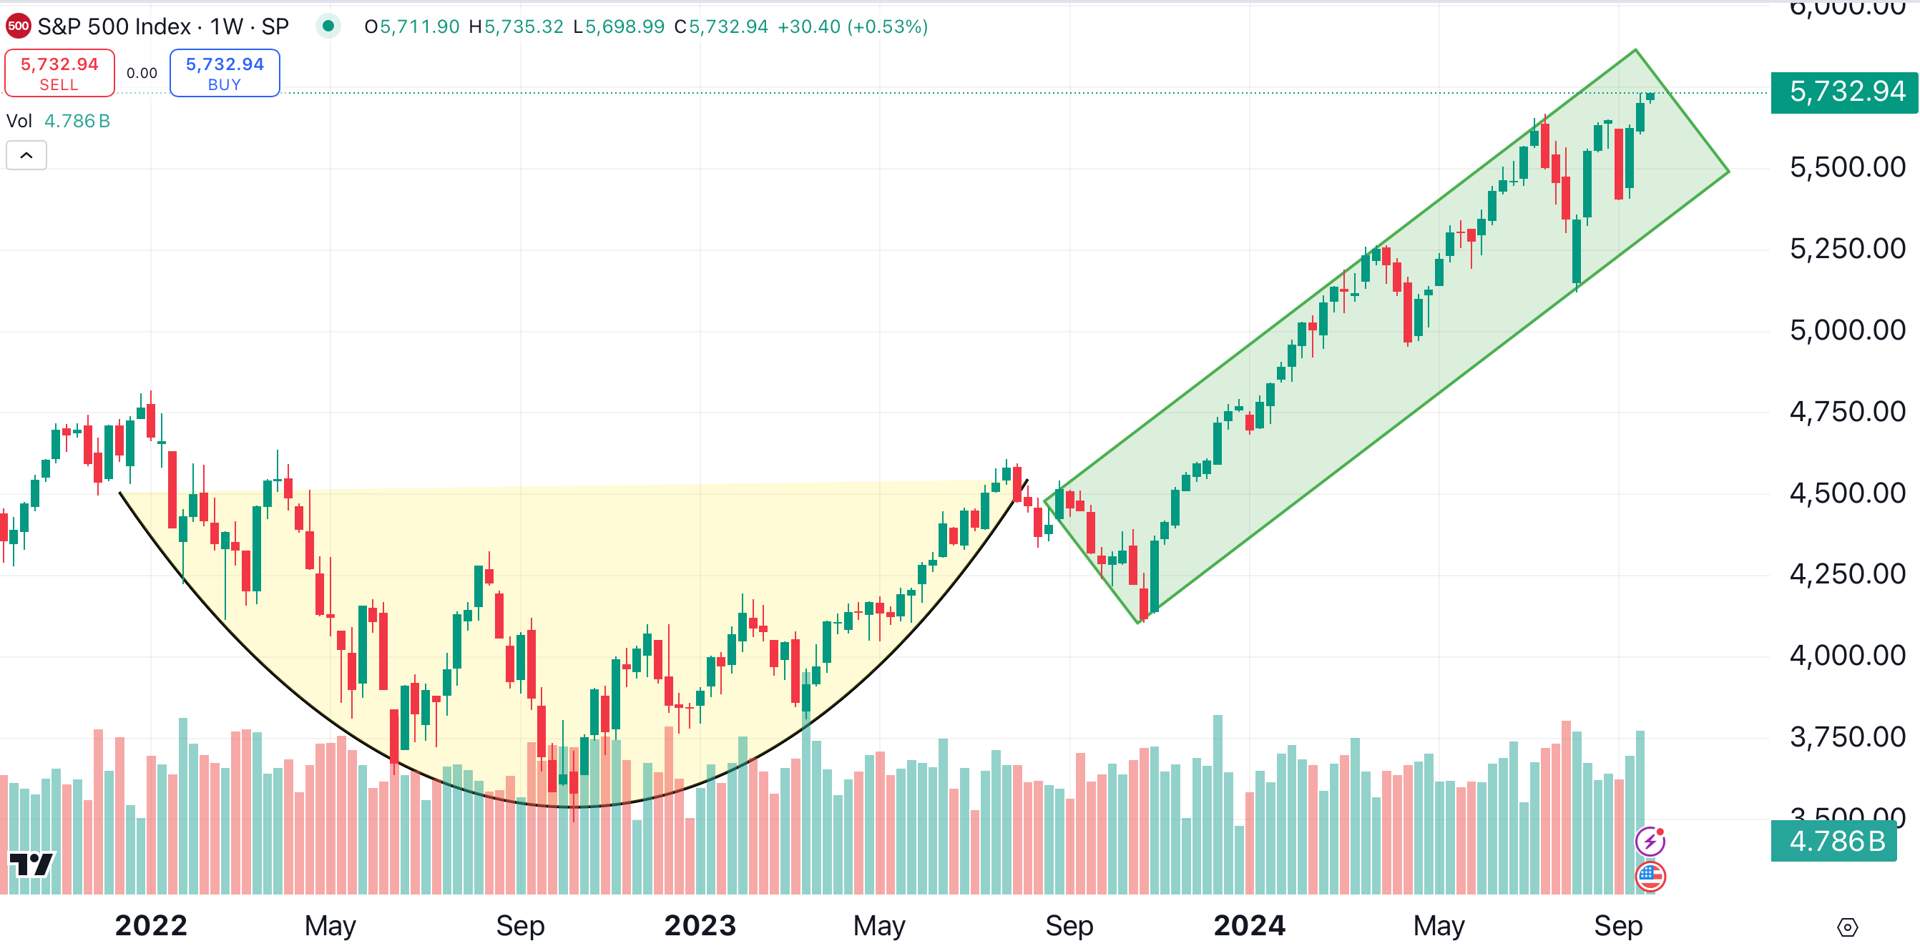
With a gain of over 20%, and with a full quarter still ahead, investors love this interstate highway. This demonstrates the futility of trying to pick the top; sometimes, the best course of action is to just roll on down the highway.
The Dow Jones Industrial Average — "Mustang Sally" by Wilson Pickett
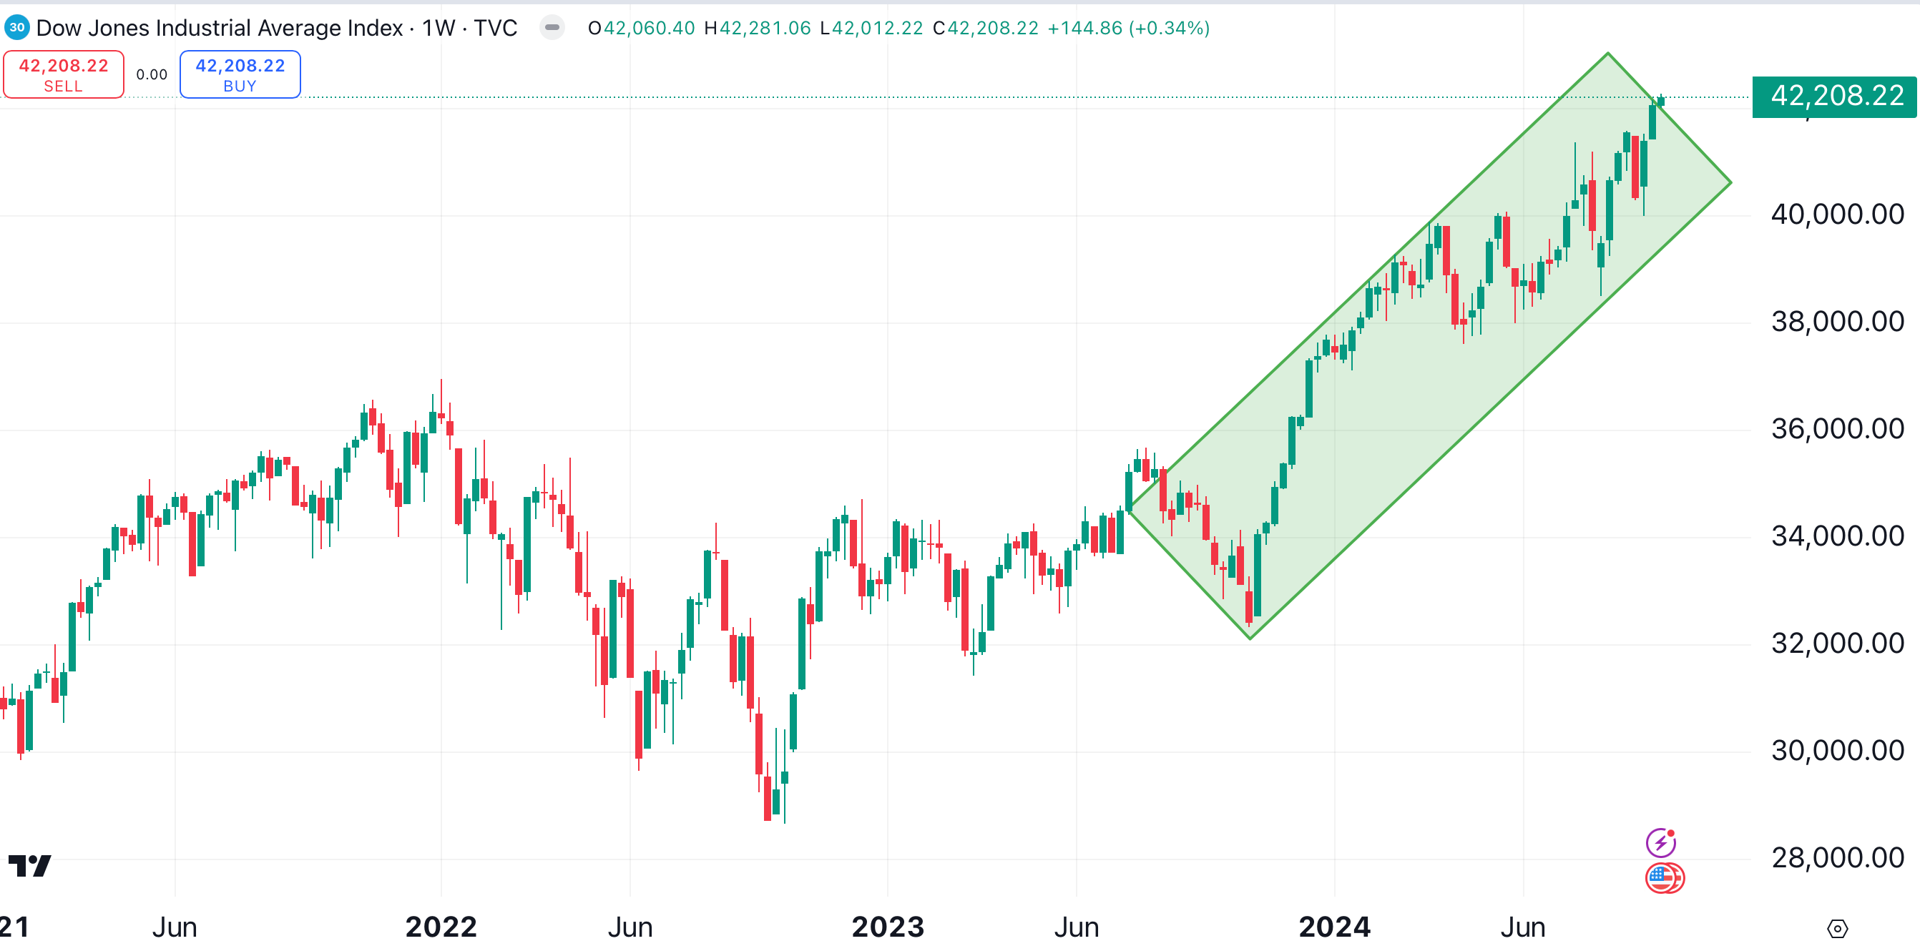
While tech was the big story during the first half of this year, the Dow Jones Industrial Average recently sped past the tech-laden Nasdaq in our hierarchy of indexes.
The original U.S. stock index is keeping pace nicely with the S&P 500, closing at a fresh all-time high of 42,208 on Monday, and leaving the Nasdaq in its dust.
The Nasdaq 100 — "Hot Rod Lincoln" by Commander Cody
Next, we’ll look at the Nasdaq 100. Think of this index as the rowdy younger sibling to the Dow and S&P 500.
Like the Autobahn, when the Nasdaq’s good, it’s great. Like the 405 in L.A., when it’s bad, it’s awful. Either way, the Nasdaq’s wild swings can leave you feeling like a character in a Road Warrior film.
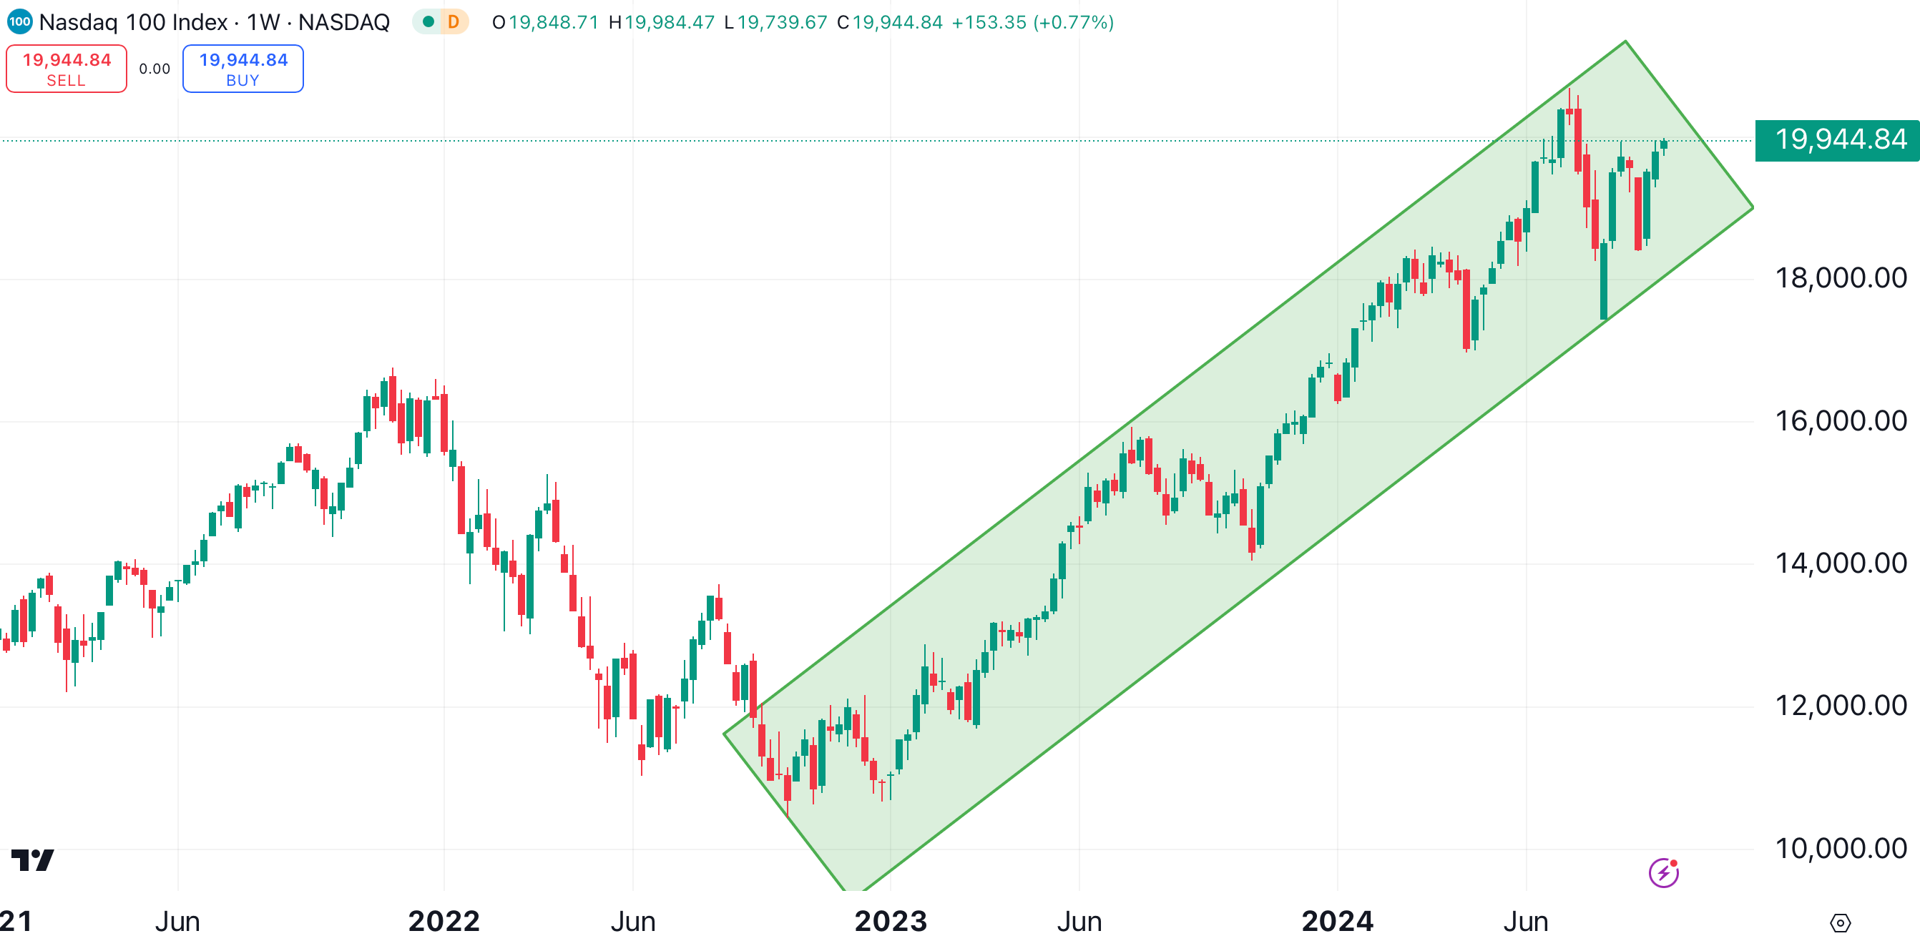
Unlike the S&P 500 and the Dow Jones Industrial Average, the Nasdaq is trading well below its all-time high, which was reached back in July. Although the Nasdaq is putting up strong year-to-date numbers, in recent weeks it has underperformed those two indexes.
Despite the wild intraday action it experienced this past summer, the Nasdaq is still on a bullish track (shaded green). The Nasdaq’s bull channel is wide, due to its high volatility. Despite recent bouts of weakness, the directional outlook remains positive.
The Russell 2000 — "Forty Miles of Bad Road" by Duane Eddy
The Russell 2000 index is like a muscle car with a flat tire. While the other indexes race to all-time highs, this index might as well be up on blocks in the front yard.
While the small-cap index is technically in a bull channel (shaded green), notice that its trend is relatively weak. The Russell 2000 is nearly three years removed from its last all-time high, reached in November of 2021 (black dotted line).
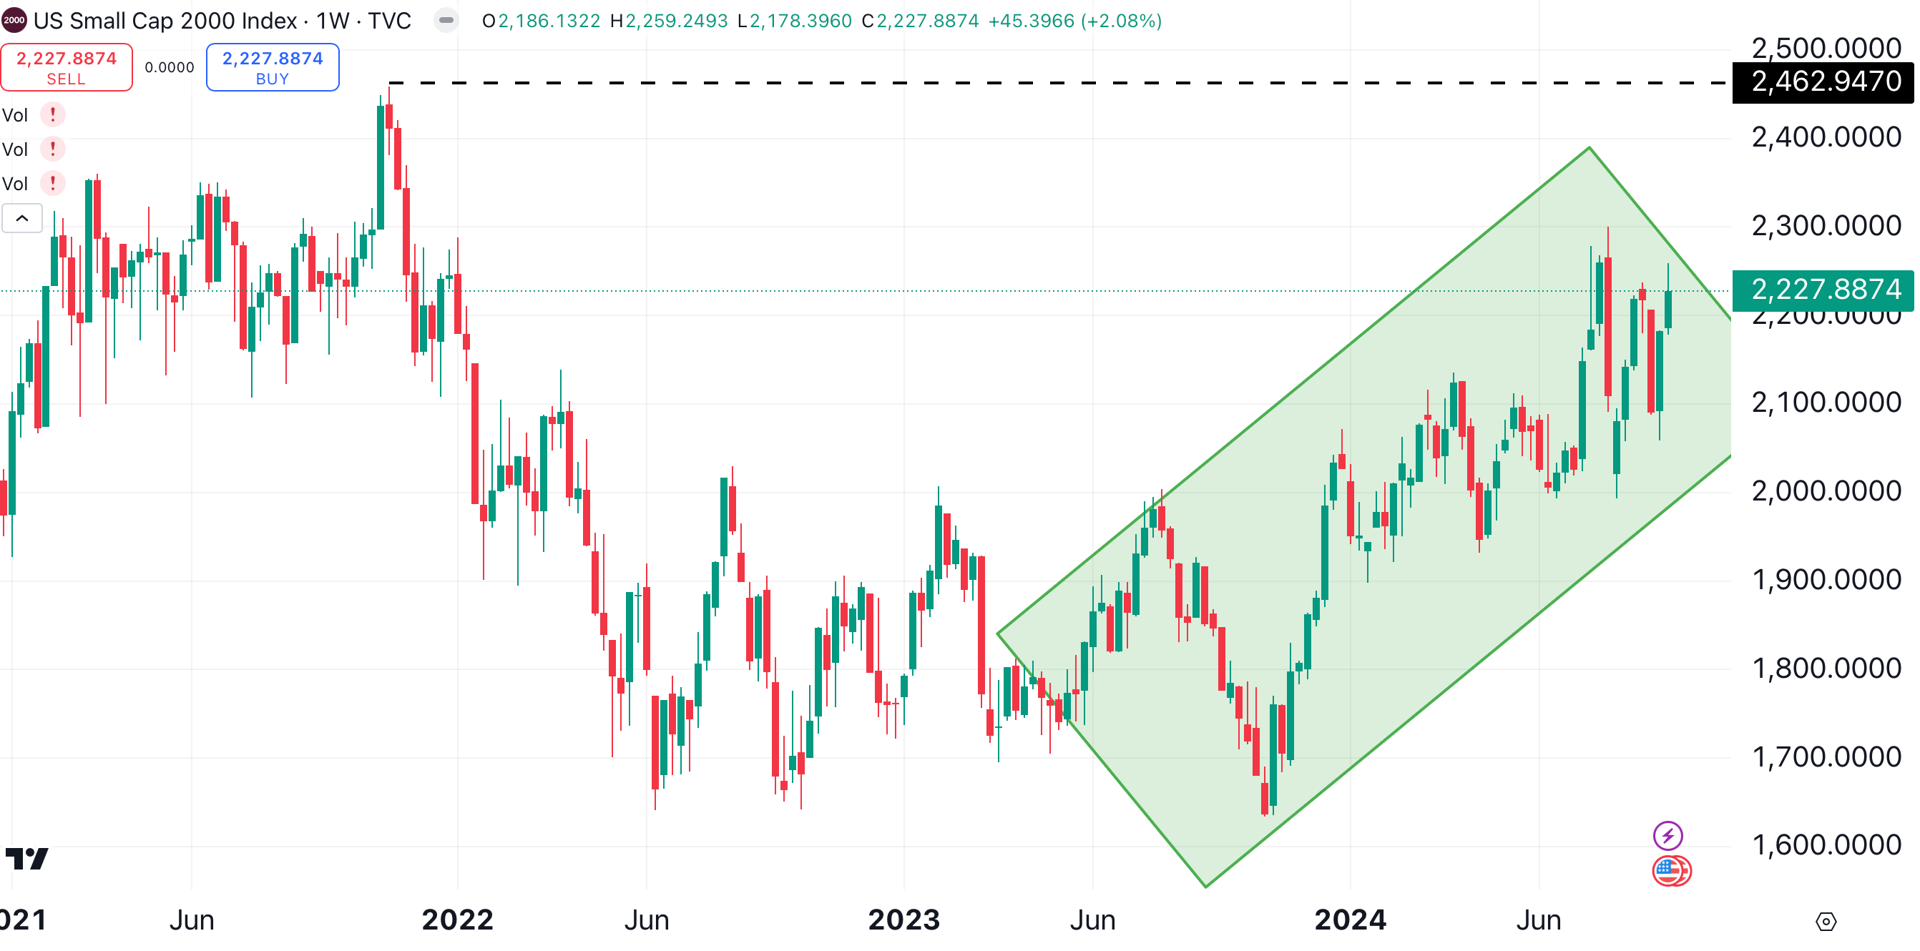
The Russell 2000 has been a chronic underperformer, and should be treated as such until it gets back on track.
The Philadelphia Semiconductor Index — "Highway to Hell" by AC/DC
This might be the Most Intriguing Chart of the Week.
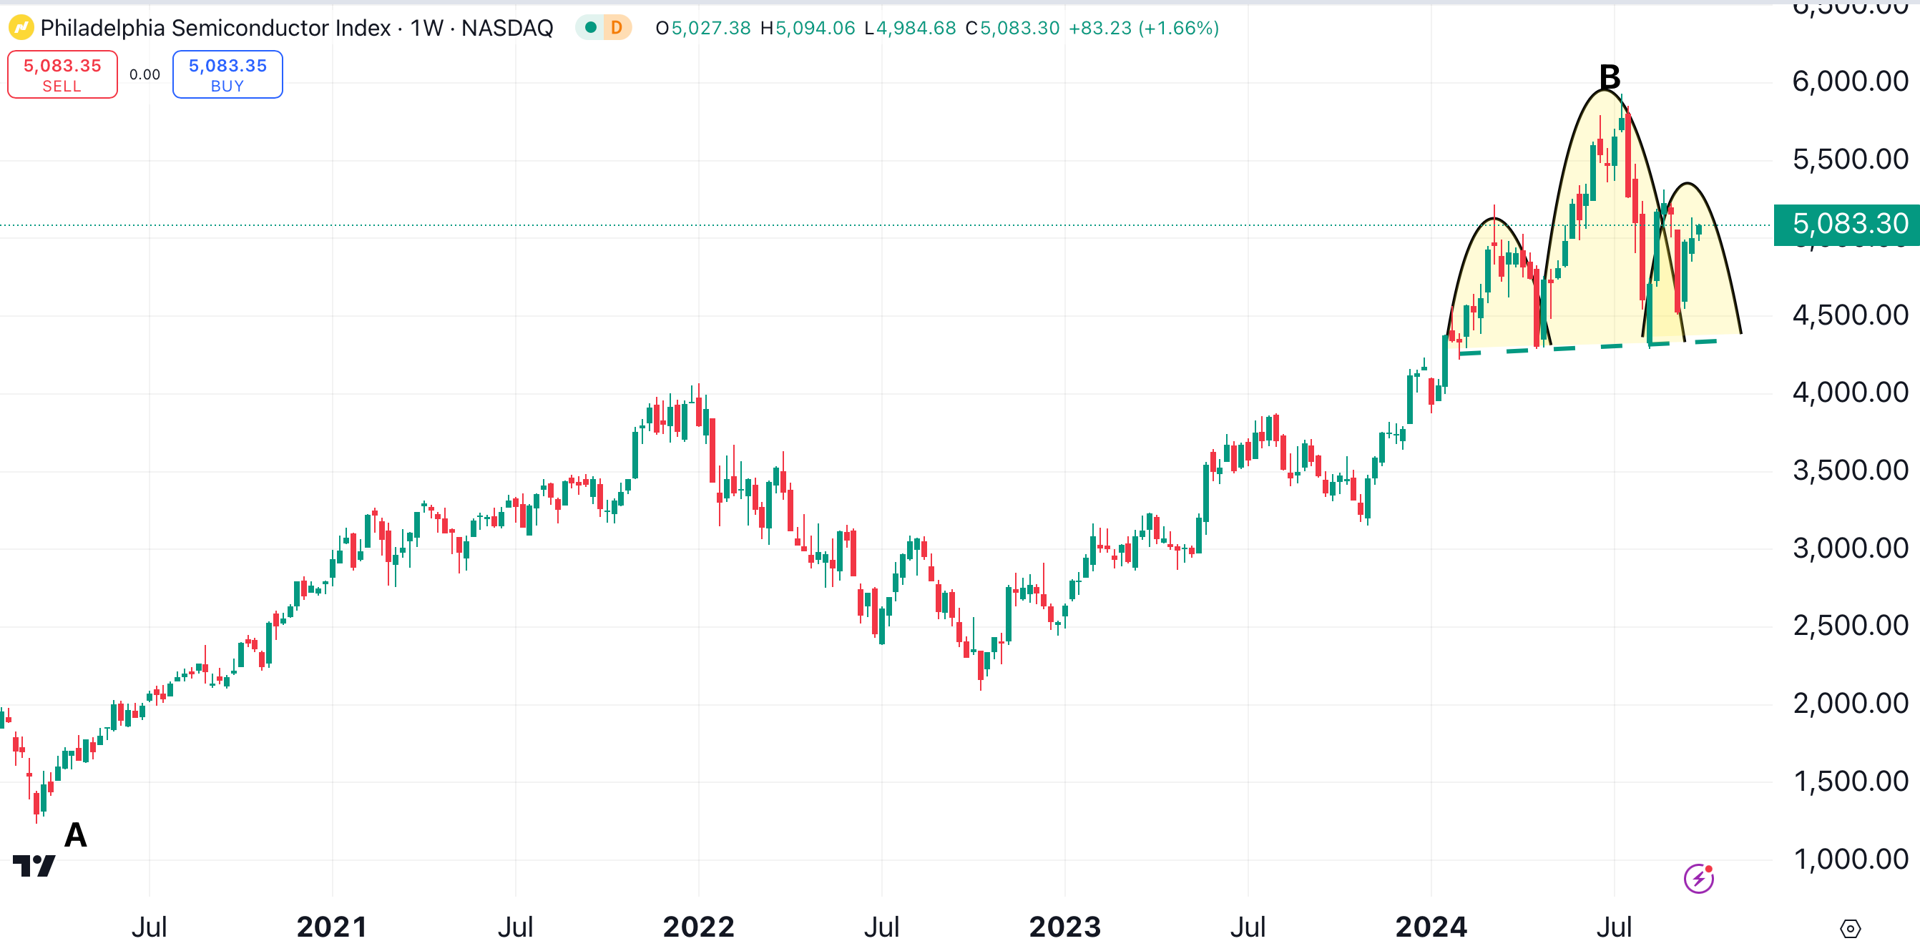
From the pandemic low of 1233 (point A), to the all-time high of 5931 (point B), the Philadelphia Semiconductor Index (SOX) gained over 480% in just over four years. Driven by stocks such as Nvidia NVDA, which has gained an astonishing 2717% over the past five years, the SOX was a market leader until the second half of this year.
The SOX index's lack of performance since early July led to the creation of a bearish pattern. A large head and shoulders (shaded yellow), which began forming at the start of this year, is about three-quarter complete.
In order to complete the pattern, the SOX needs to break the neckline, located near 4400 (green dotted line). That’s a long way off, so it’s possible that this pattern may never be completed. This would come as a relief to bulls.
On the other hand, if that neckline breaks — look out below. The repercussions of a downturn in semis would be felt across the Nasdaq.
The Strongest Sectors
Some highways are jammed with broken heroes — stocks and sectors that have lost their mojo. These investments leave the driver stranded, cursing and waiting for a lift.
It’s an unfortunate fact that investors tend to sell winners, and hold on to stocks and sectors that are no longer performing. It may come as a surprise to some to learn that tech isn’t one of the stronger sectors right now.
Strong sectors offer investors a clear road and a smooth ride. Let’s look at the top sectors to own right now.
Utilities Sector — "Electric Avenue" by Eddy Grant
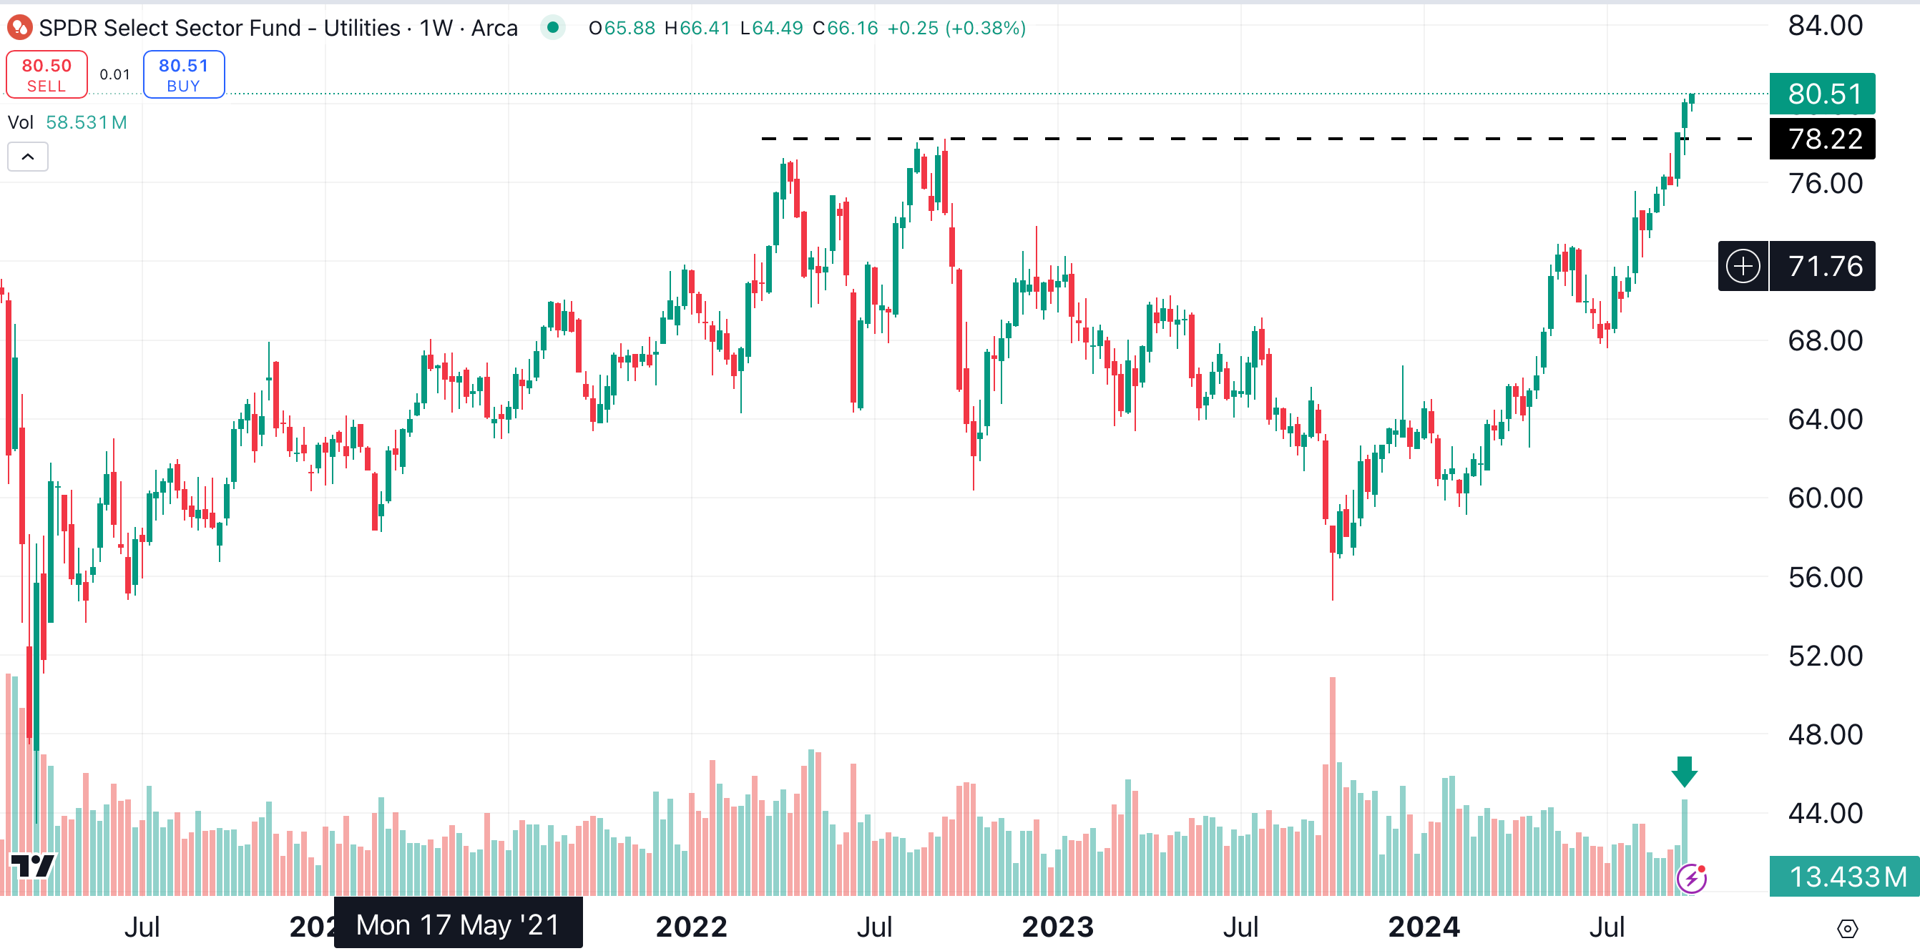
With global interest rates falling, the outsized dividends offered by some utilities stocks are helping to drive this sector. This sector is represented here by the SPDR Select Utilities Fund XLU, which recently smashed through a significant resistance level at $78.22 (black dotted line) on heavy volume (arrow).
Industrial Sector — "Working Man" by Rush
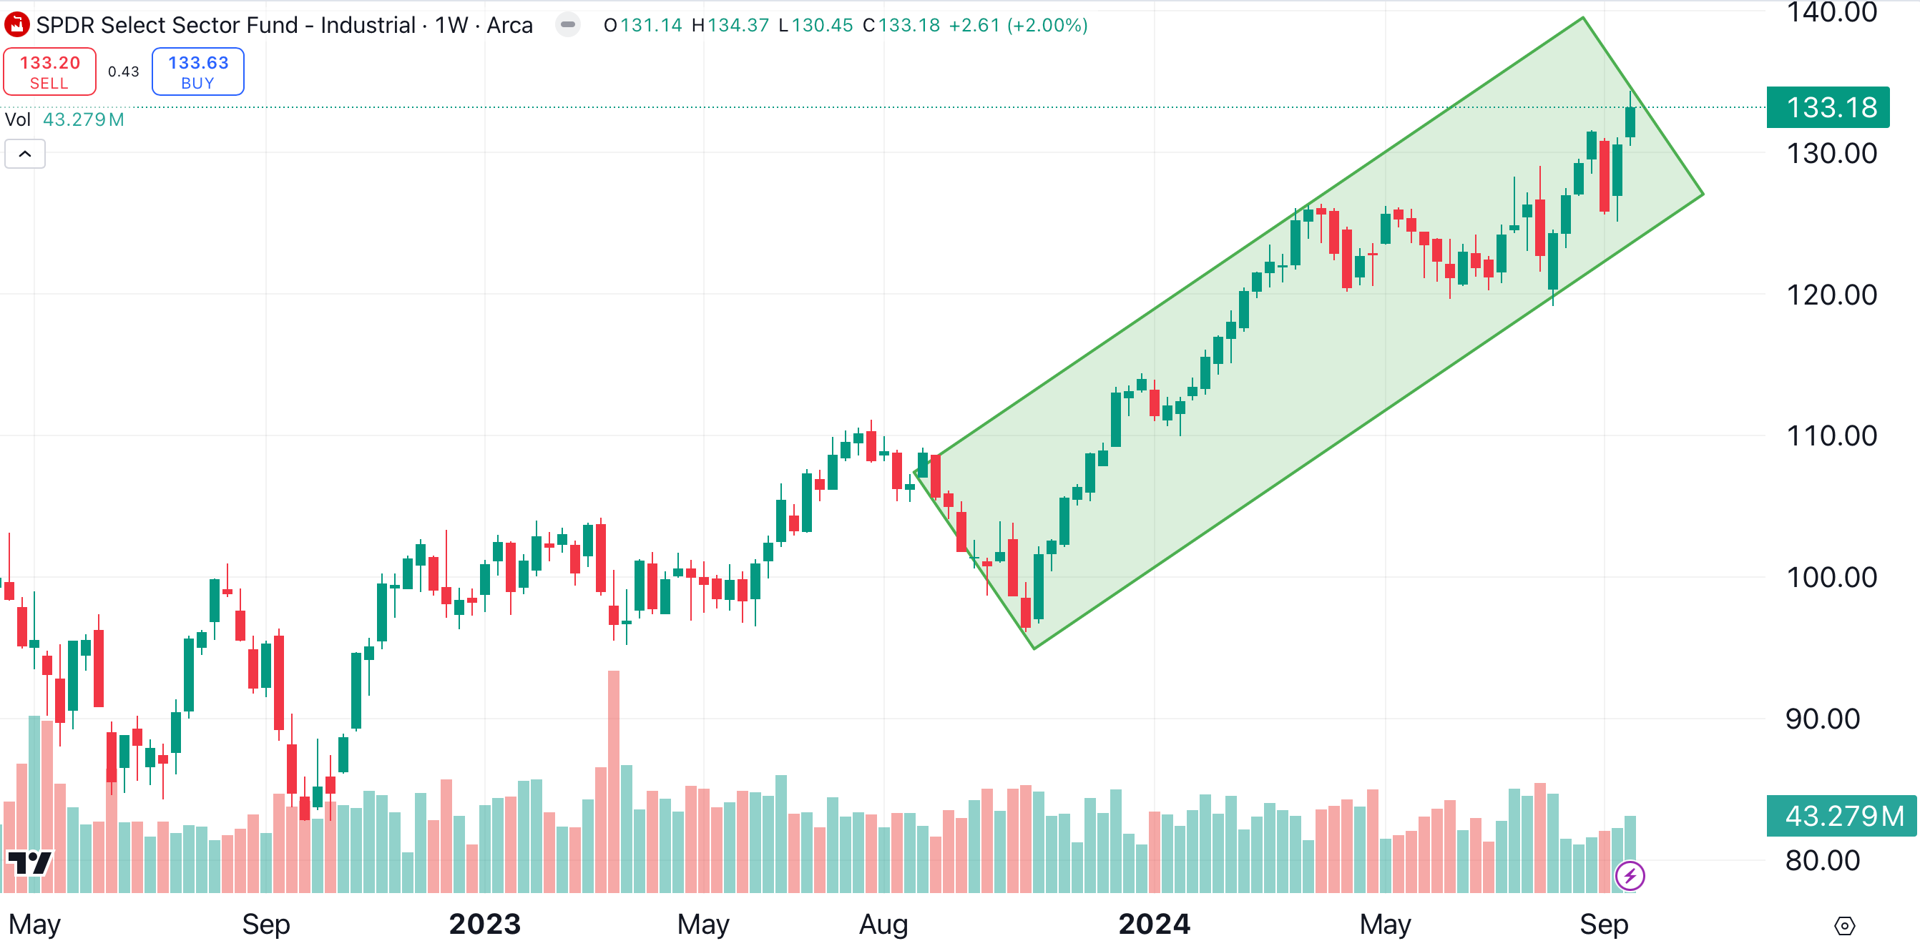
The industrial sector, represented by the SPDR Select Industrial Fund XLI, closed at a fresh all-time high on Monday. The bull channel (shaded green) is similar to that of the Dow Jones Industrial Average.
Industrials are gaining steam as some capital rotates out of tech. I'm scoring this one slightly below the utilities sector due to the strength of the former's breakout.
Building Materials Sector — "Our House" by Madness
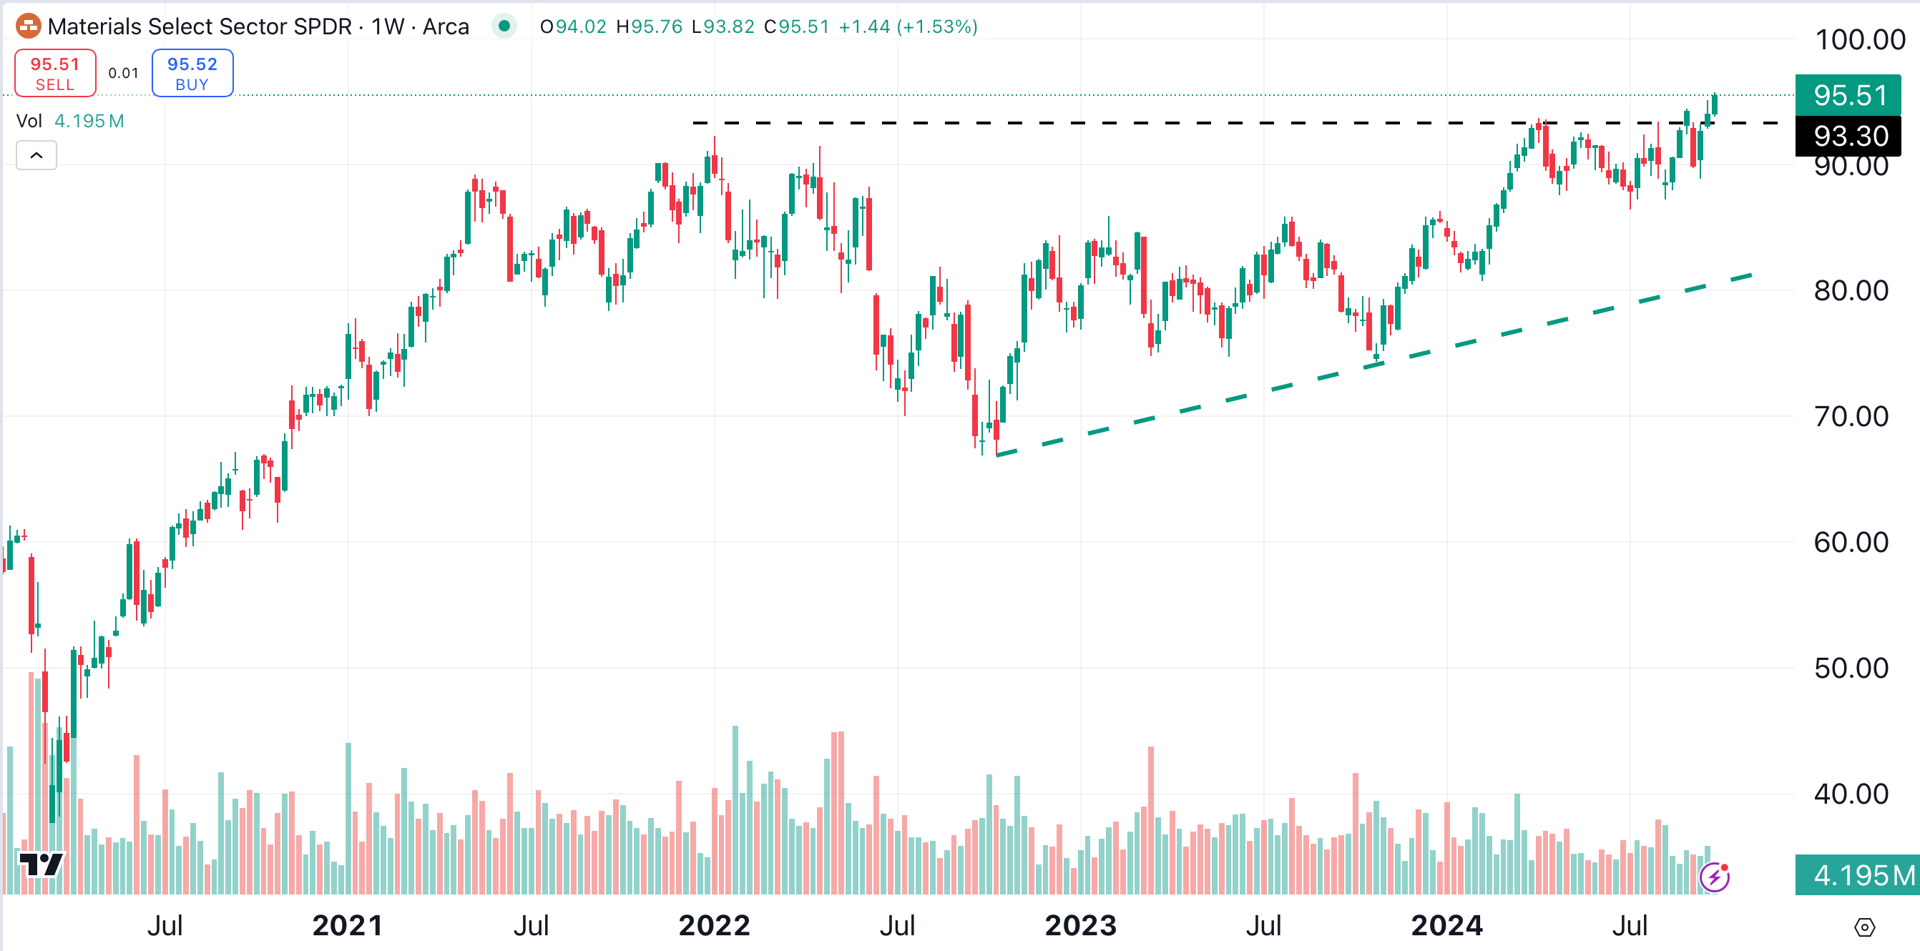
This sector, represented here by the Materials Select Sector SPDR XLB, is breaking out of an ascending triangle pattern (green dotted lines). At this point, the breakout hasn’t been confirmed by an increase in volume, but it could run from here.
Financial Sector — "Money (That's What I Want)" by The Beatles
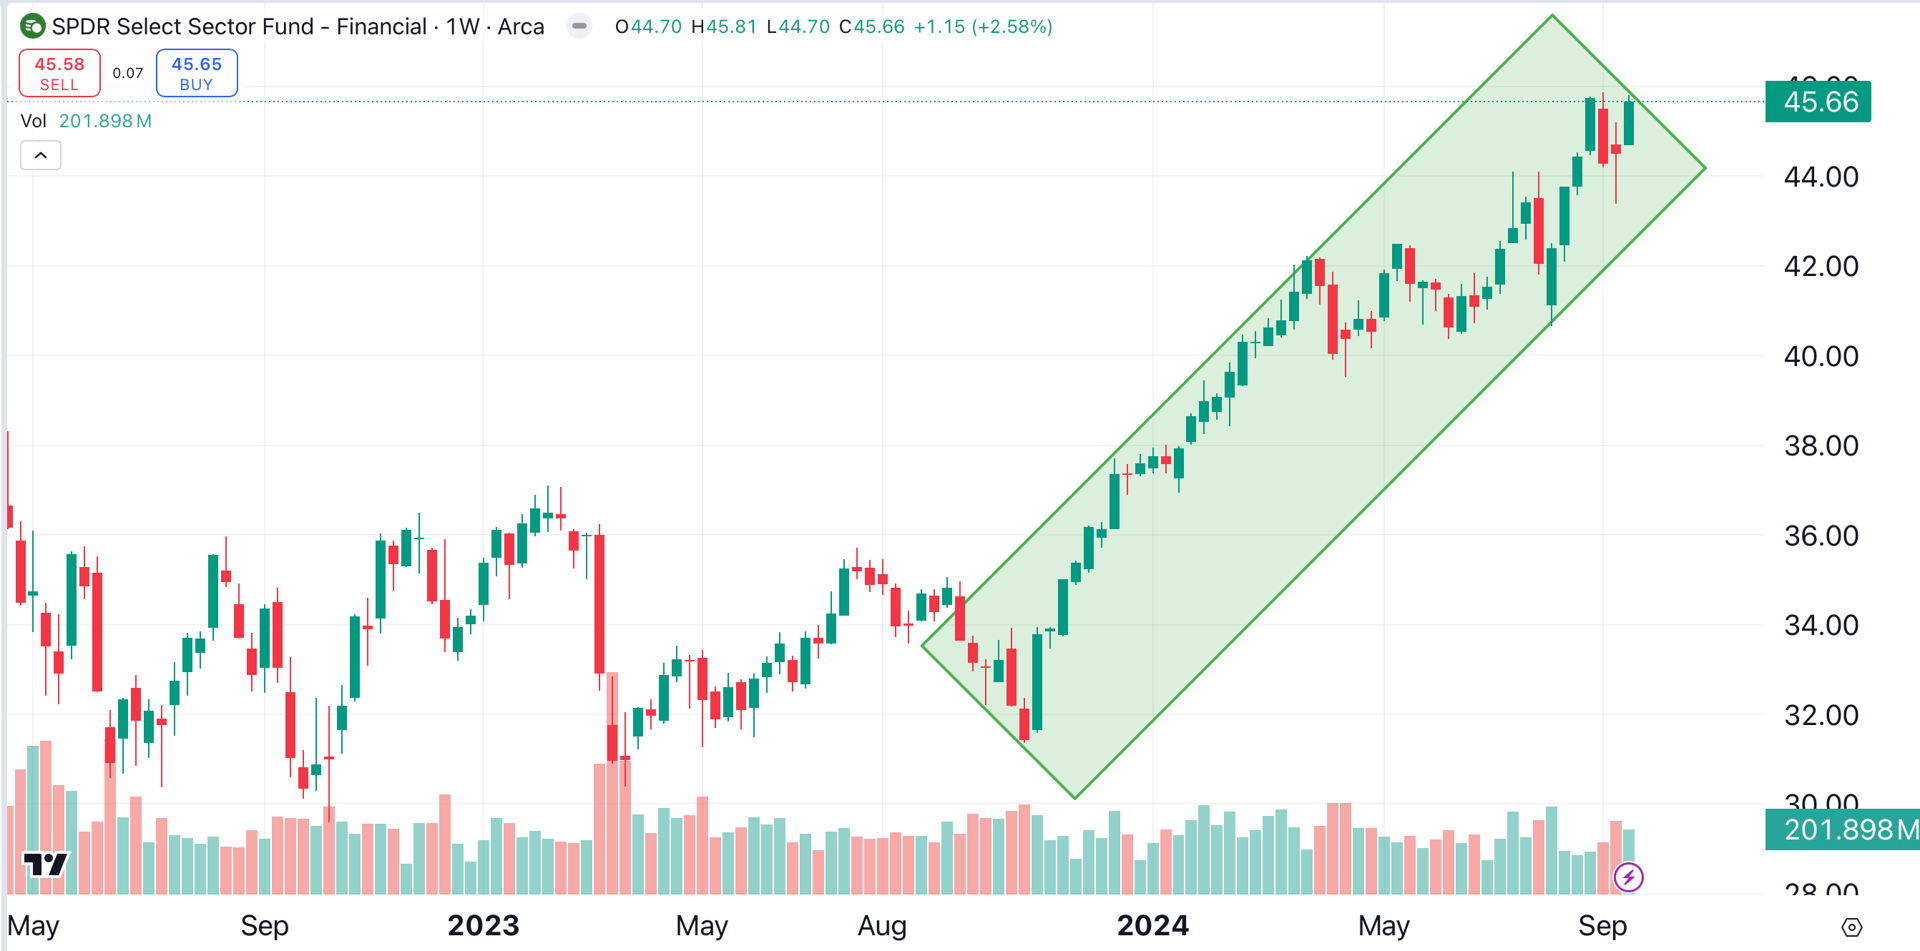
The financial sector, represented here by the SPDR Financial Select Fund XLF, is also trending higher. Financials are trading just below their all-time highs.
Consumer Staples — "Shop Around" by The Miracles
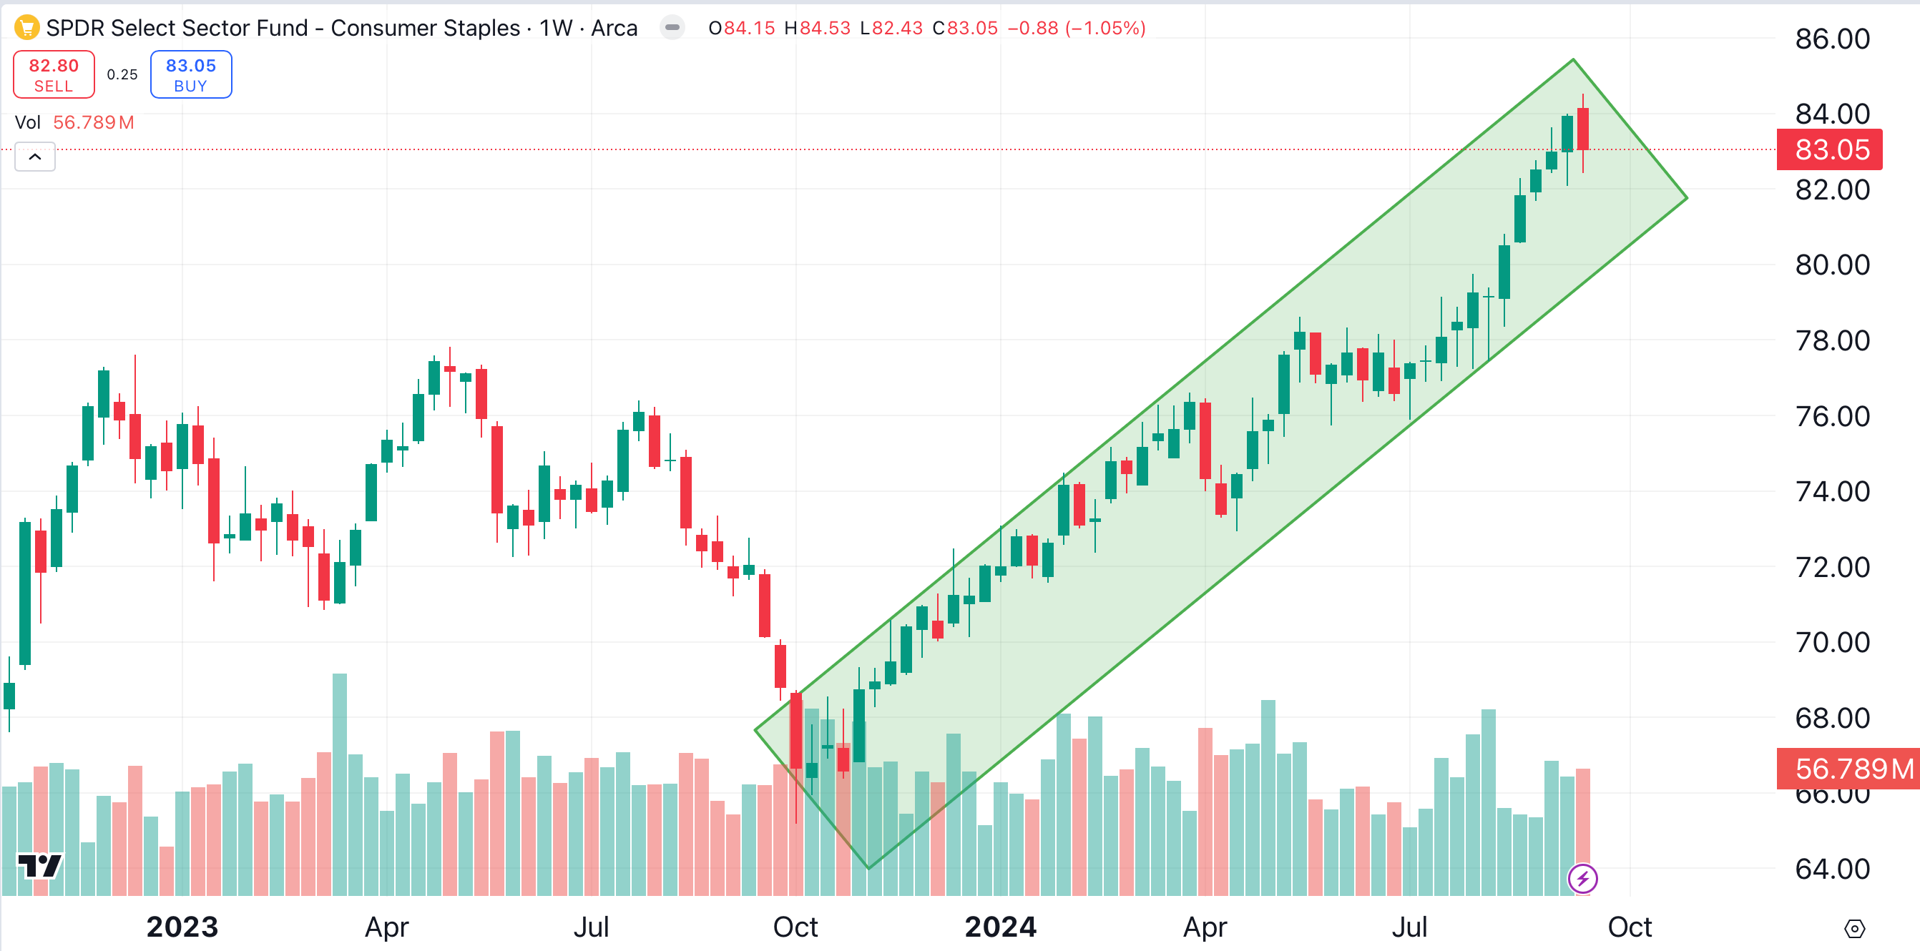
The Consumer Staples sector, represented here by the SPDR Select Consumer Staples ETF XLP is humming along. We alerted readers to this sector’s breakout back in July.
I hope you've enjoyed our journey so far. Next time, in Part 2, we'll drill down to find the top names in each of the strongest sectors.
At the time of publication, Ponsi had no positions in any securities mentioned.