Is HF Sinclair Going the Way of the 'DINO's for Traders?
As the stock drops, should you chisel away or bail? Here's my technical plan.
You've reached your free article limit
You've read 0 of 1 free Pro articles.
I recommended buying energy company HF Sinclair Corp DINO on Feb. 12, with a $53 stop loss. Unfortunately, the shares of DINO have pulled back in price since early April and DINO is trading below $53.
Let's check out the charts again for a new plan.
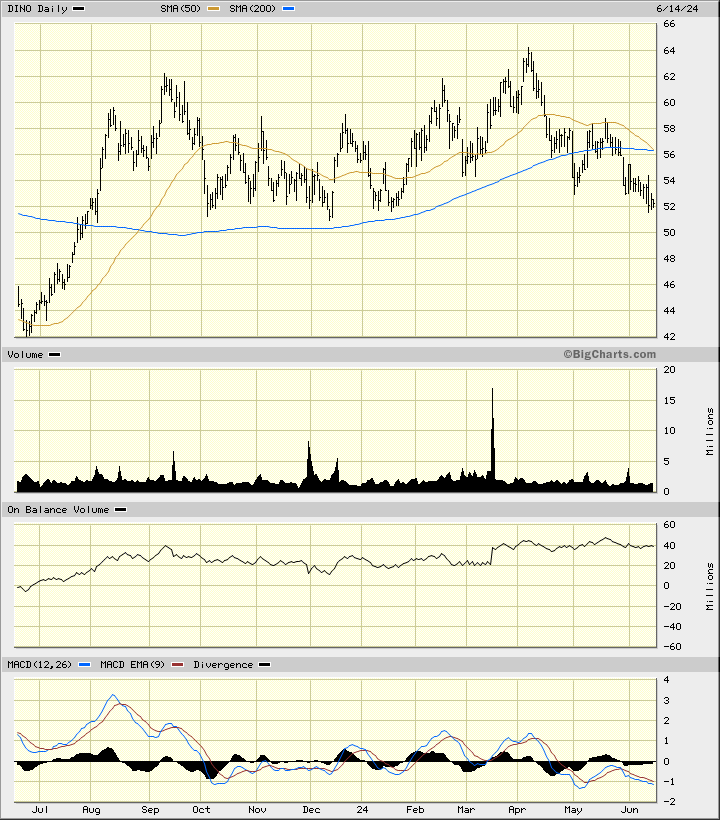
In this daily bar chart of DINO, below, I can see that prices have rolled over in the past two-plus months. Prices trade below the declining 50-day moving average line and below the declining 200-day moving average line. The trading volume is not giving me any helpful clues. The On-Balance-Volume (OBV) has been neutral for months now. The Moving Average Convergence Divergence (MACD) oscillator is in a bearish alignment below the zero-line.
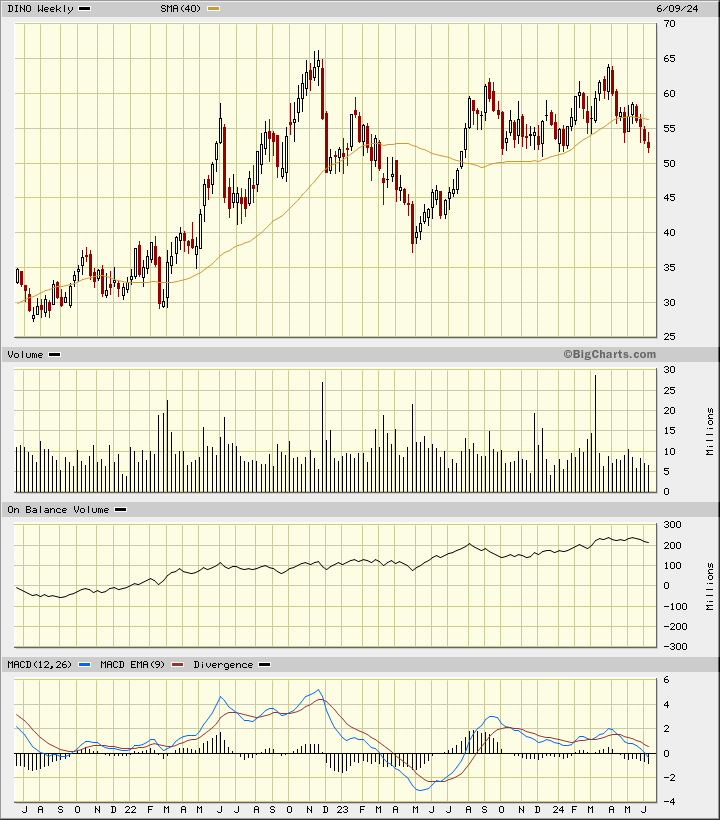
In this weekly Japanese candlestick chart of DINO, below, I see a chart poised for further weakness. Prices are trading below the declining 40-week moving average line. The weekly OBV line started to decline in May. The MACD oscillator shows weakness since September and is close to the zero-line.
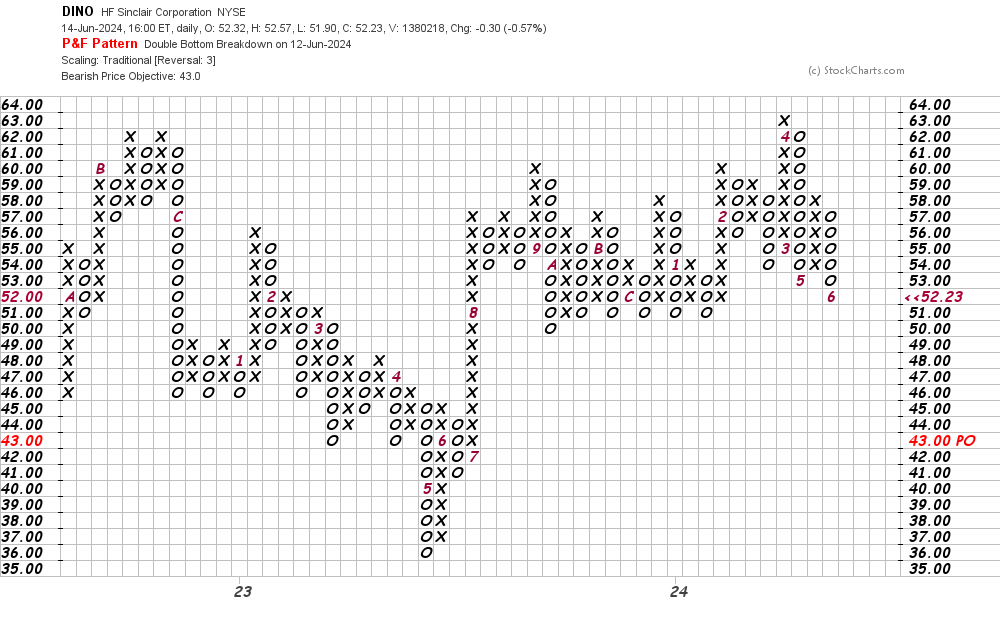
In this daily Point and Figure chart of DINO, below, I can see a downside price target in the $43 area.
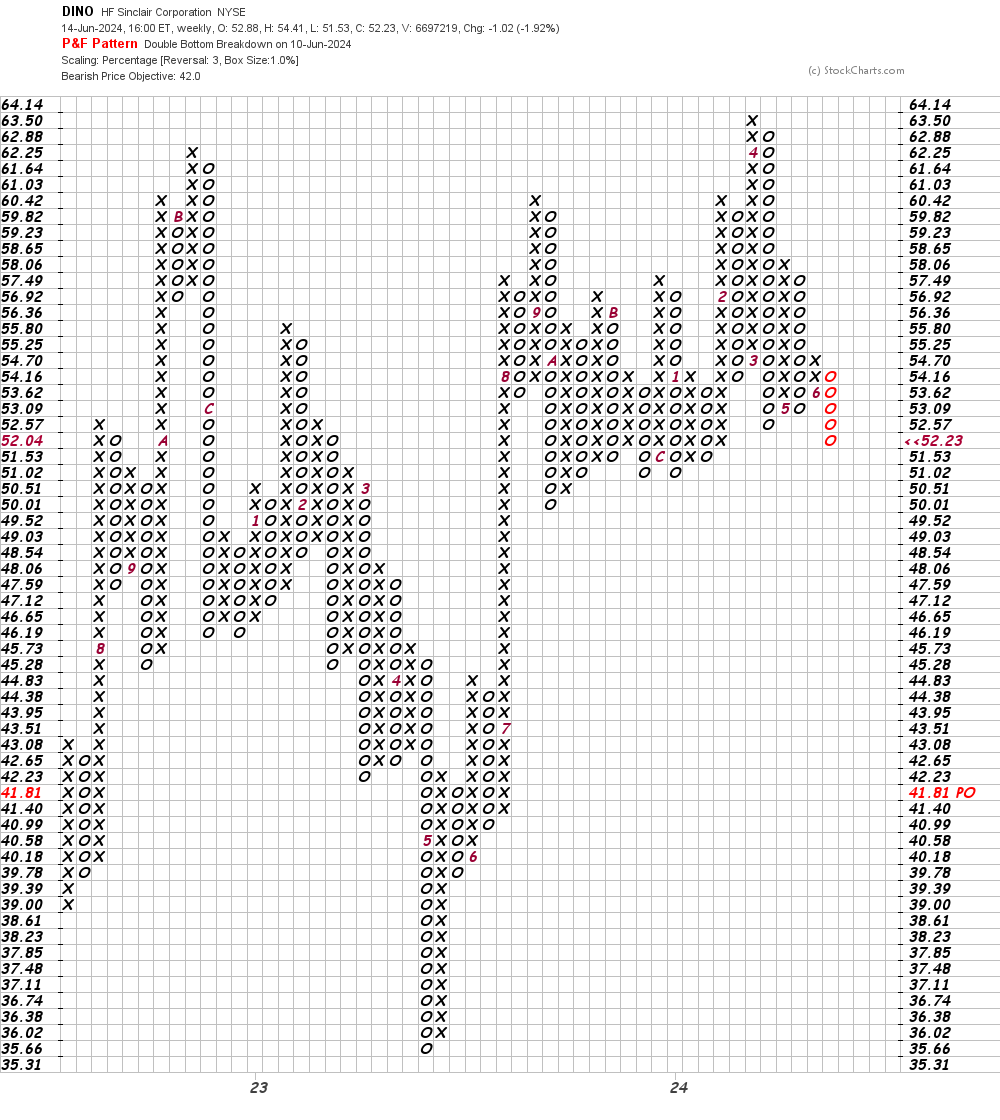
Next, in this weekly Point and Figure chart of DINO, below, I can see a price target in the $42 area.
Bottom line strategy: Discipline is key to successful trading. DINO declined below my risk point, so I am gone. (I am not permitted to trade individual securities, but if I did I would be out). Avoid the long side of DINO for now.
Employees of TheStreet are prohibited from trading individual securities.