HF Sinclair Is Poised for an Upside Breakout
Here's how to play the stock now.
You've reached your free article limit
You've read 0 of 1 free Pro articles.
HF Sinclair Corp. DINO is involved with petrochemicals from refining to midstream to marketing. They provide traditional and renewable fuels and lubricants for planes, trains and automobiles and more.
Let's check out the charts and indicators.
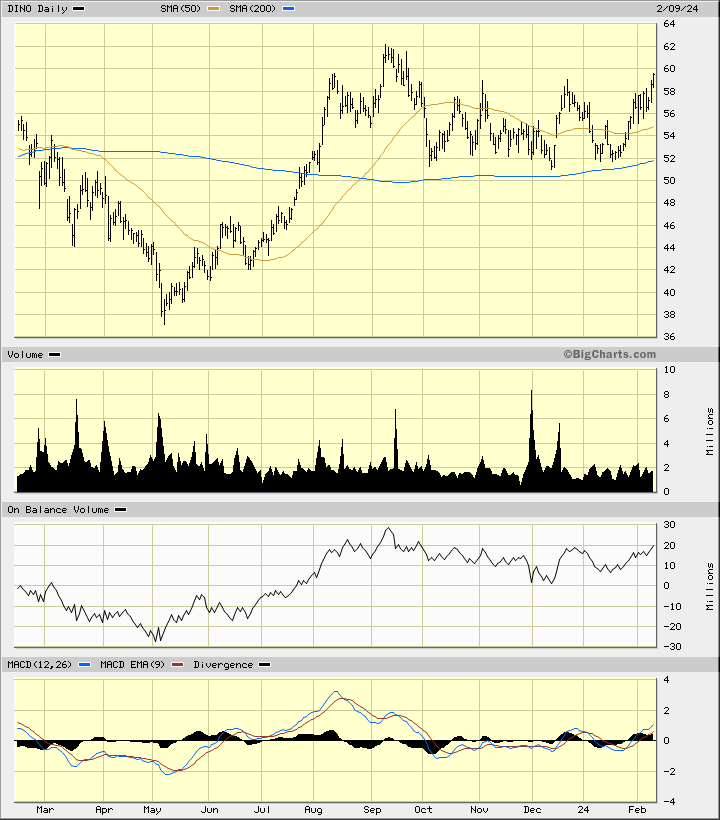
In the daily bar chart of DINO, below, I can see that the shares have traded sideways since October. DINO made a low in December and a slightly higher low in January.
The trading volume increased in December and at the same time the On-Balance-Volume (OBV) line turned higher. The Moving Average Convergence Divergence (MACD) oscillator recently moved above the zero line for a buy signal.
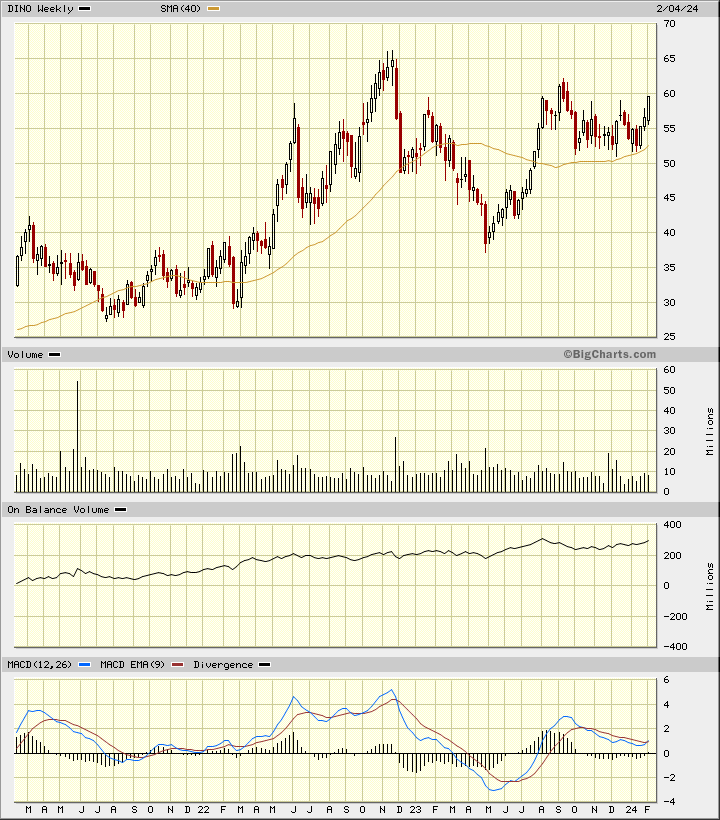
In the weekly Japanese candlestick chart of DINO, below, I see a promising-looking chart picture. The shares are trading above the rising 40-week moving average line.
The OBV line shows improvement from October telling me that buyers are being more aggressive than sellers. The MACD oscillator is poised for an upside crossover and new buy signal.
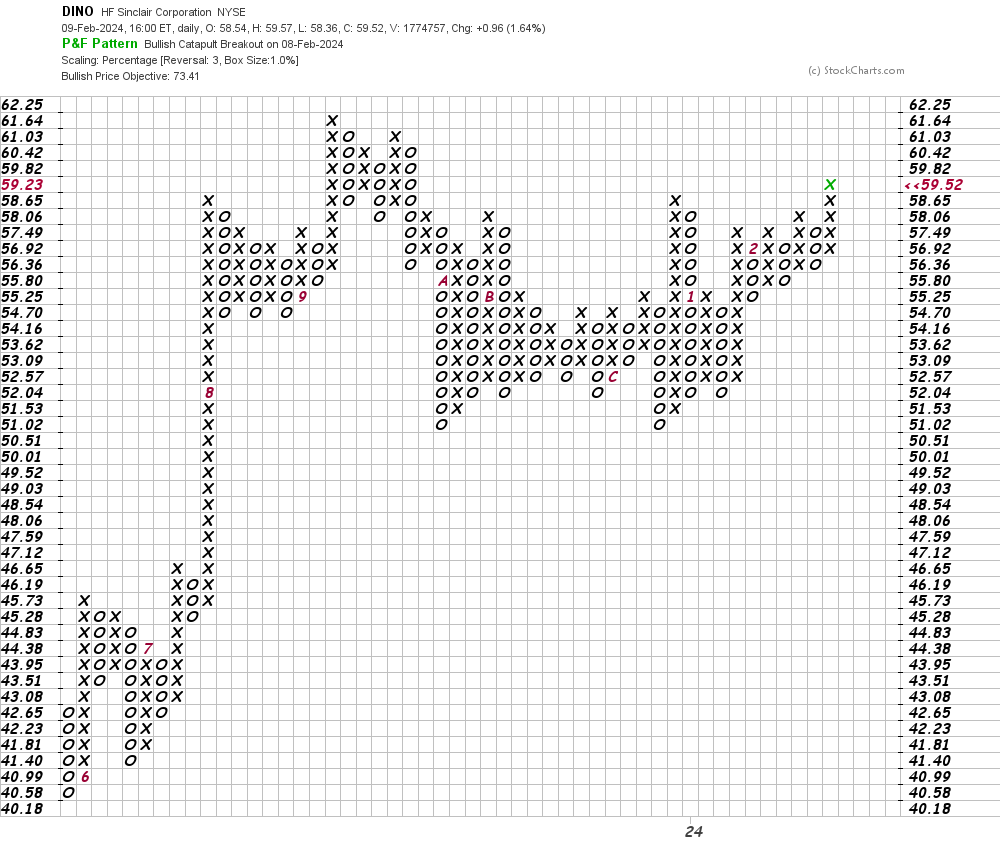
In this daily Point and Figure chart of DINO, below, I can see an upside price target in the $73 area.
In this weekly Point and Figure chart of DINO, below, I can see an upside price target in the $70 area.
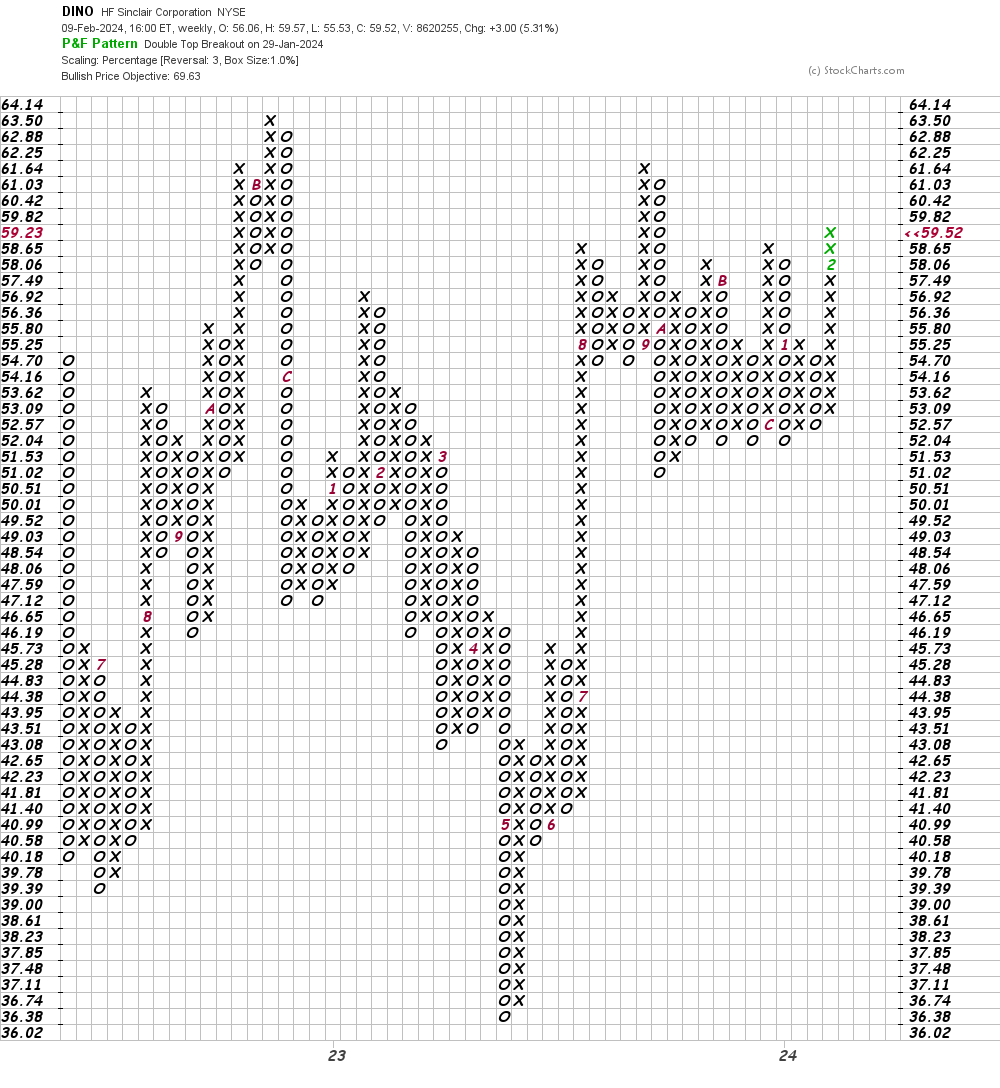
Bottom-line strategy: Traders could probe the long side of DINO at current levels risking to $53. The $70-$73 area is my price target for now.
Employees of TheStreet are prohibited from trading individual securities.