Our Tips for Trading CrowdStrike Following S&P 500 Announcement
Crowdstrike Holdings is rallying on the news that it will be included in the S&P 500 Index, here's how to trade the cybersecurity firm.
You've reached your free article limit
You've read 0 of 1 free Pro articles.
CrowdStrike Holdings CRWD is rallying Monday, after it was announced that it would be included in the S&P 500 Index later this month. Let's check out the charts and indicators of this cybersecurity firm.
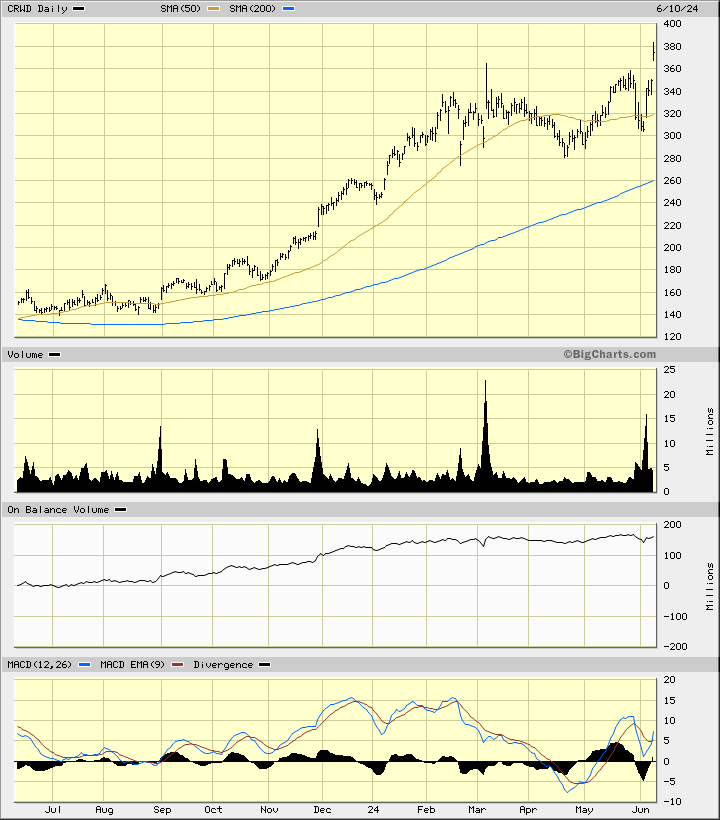
In this daily bar chart of CRWD below, I can see that prices have gapped higher to make a new high for the move up. CRWD trades above the rising 50-day moving average line and above the rising 200-day moving average line. The trading volume has been more active since late November. The daily On-Balance-Volume (OBV) line has been rising the past year and is supportive to further gains. The Moving Average Convergence Divergence (MACD) oscillator has just crossed to the upside for a fresh outright buy signal.
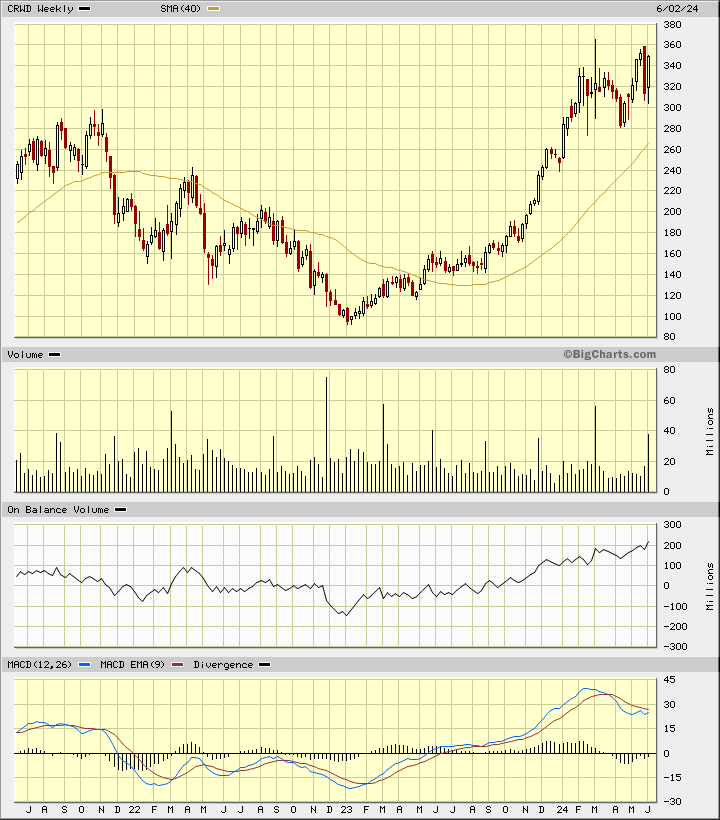
In this weekly Japanese candlestick chart of CRWD below, I see a mixed setup. Prices are in a longer-term uptrend as prices trade above the rising 40-week moving average line. The weekly trading volume shows a slight decline over the past two years. The OBV line has been rising since early 2023 and tells us that buyers of CRWD have been more aggressive than sellers for several months. The MACD oscillator is well above the zero line and poised for a turn higher for a fresh outright buy signal.
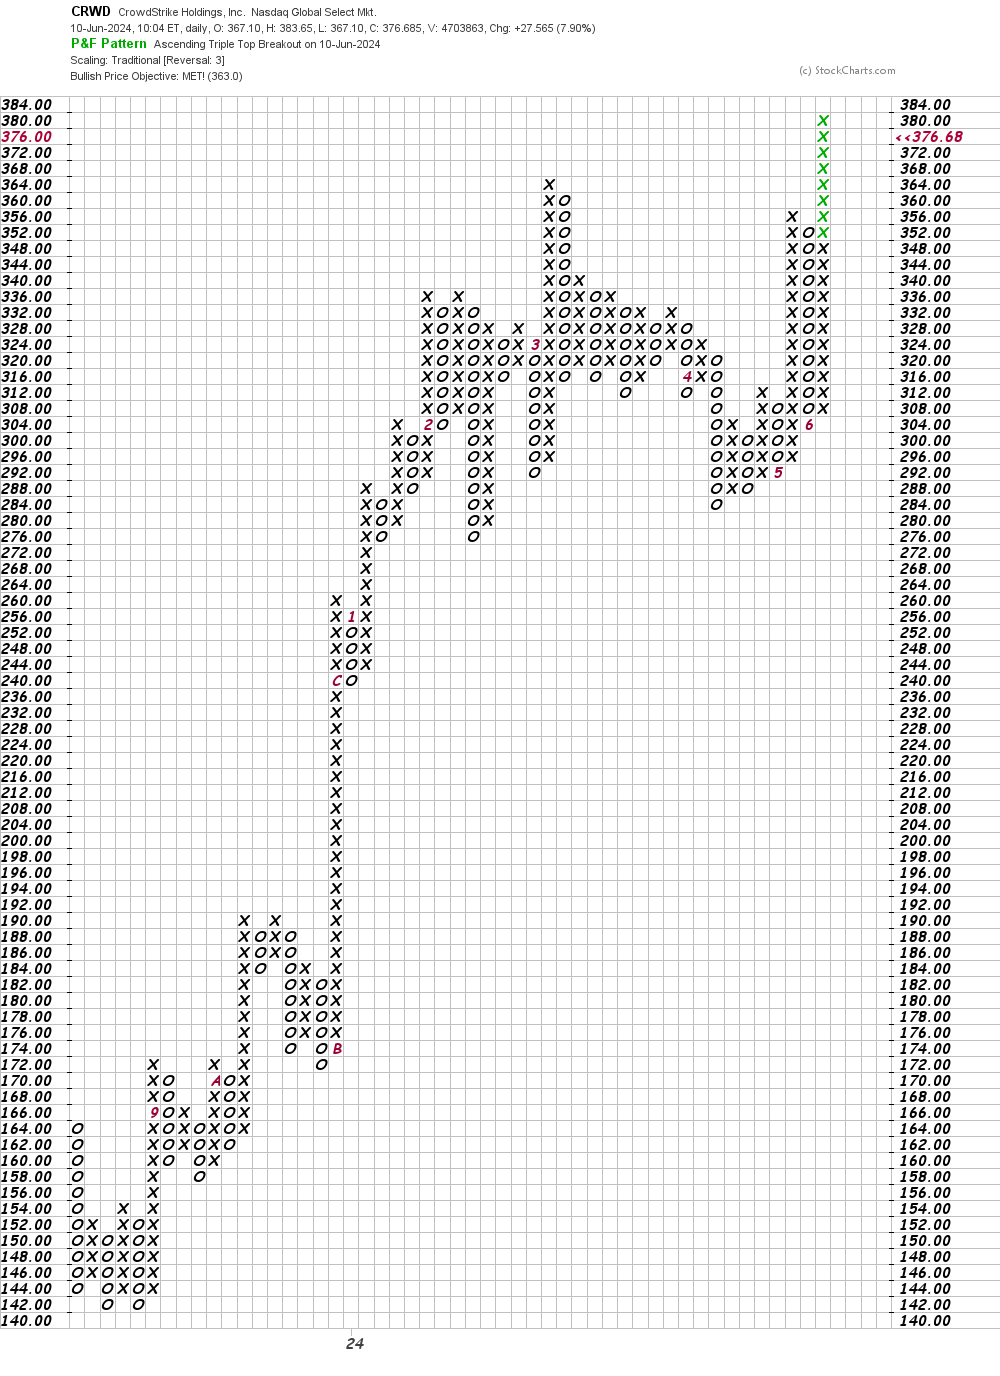
In this daily Point and Figure chart of CRWD below, I can see that prices have reached and exceeded an upside price target in the $363 area.
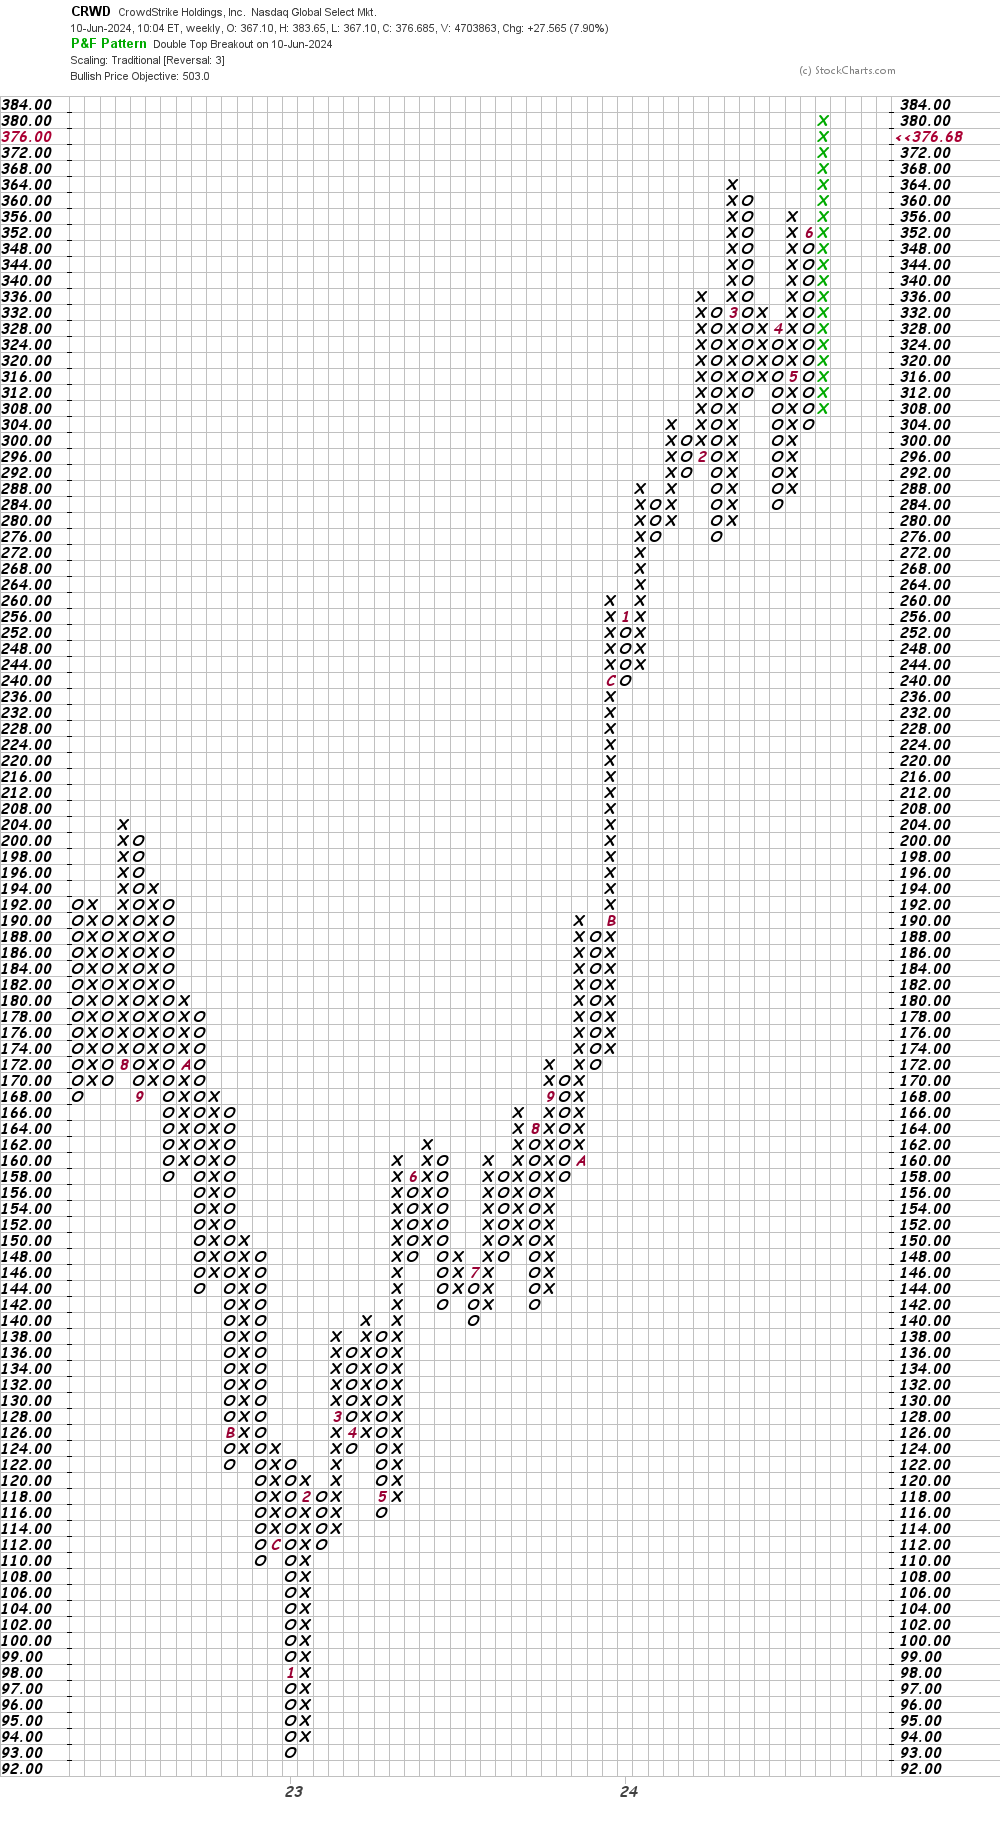
In this weekly Point and Figure chart of CRWD, below, I can see that the software is projecting a price target in the $503 area.
Bottom line strategy: The charts and indicators of CRWD look like they can support higher prices in the weeks ahead, with or without inclusion in the S&P 500.
Traders could go long on a dip towards $360 if available. Risk to $320.
Employees of TheStreet are prohibited from trading individual securities.