Harmony Gold Is Poised for Further Gains
Here's how traders can play the stock.
You've reached your free article limit
You've read 0 of 1 free Pro articles.
Harmony Gold HMY is benefiting from a rise in the price of gold to record levels in recent weeks.
Let's check out the charts and indicators.
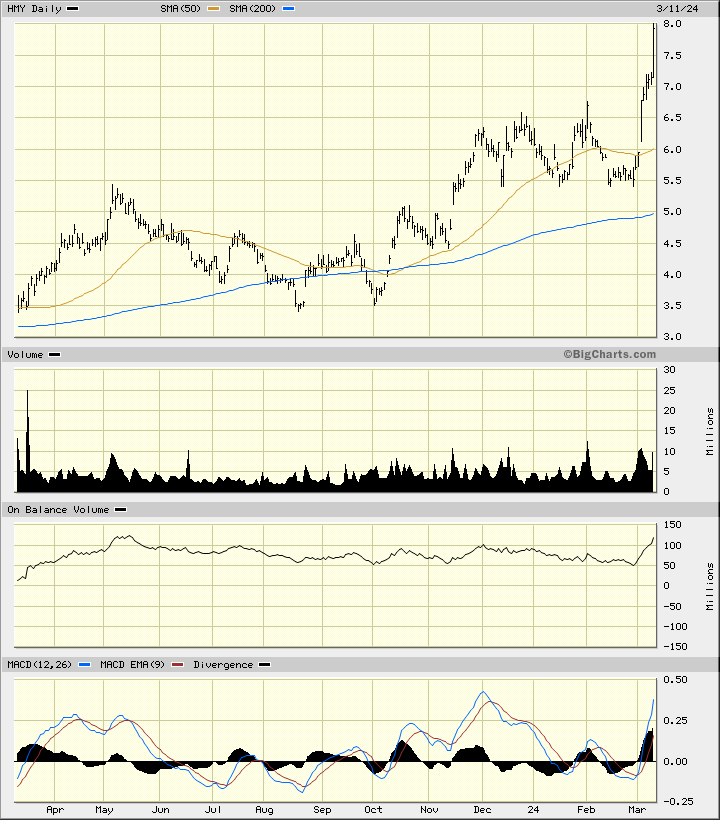
In this daily bar chart of HMY, below, I can see that the price of HMY corrected lower from May to October and then turned upwards. Prices traded sideways in December through February and then turned higher again. HMY trades above the rising 50-day moving average line and above the rising 200-day line.
The On-Balance-Volume (OBV) line shows us a slight decline from May to February before turning upwards. The Moving Average Convergence Divergence (MACD) oscillator is now in a positive move above the zero line.
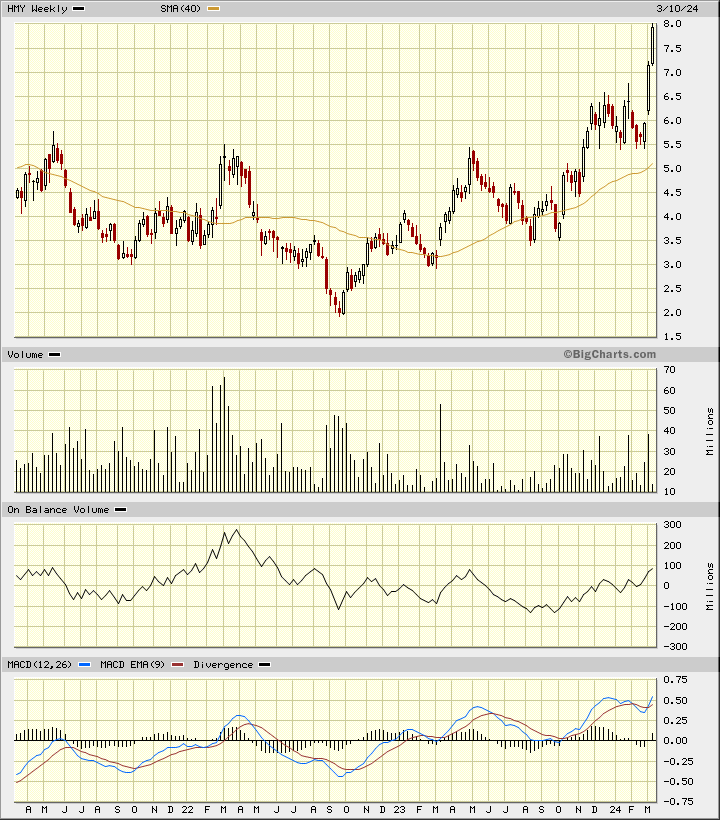
In this weekly Japanese candlestick chart of HMY, below, I can see that prices made a low at $2 per share and an upside breakout from a neckline around $5.50. Prices trade above the rising 40-week moving average line.
The weekly OBV line is moving upwards and the MACD oscillator is bullish.
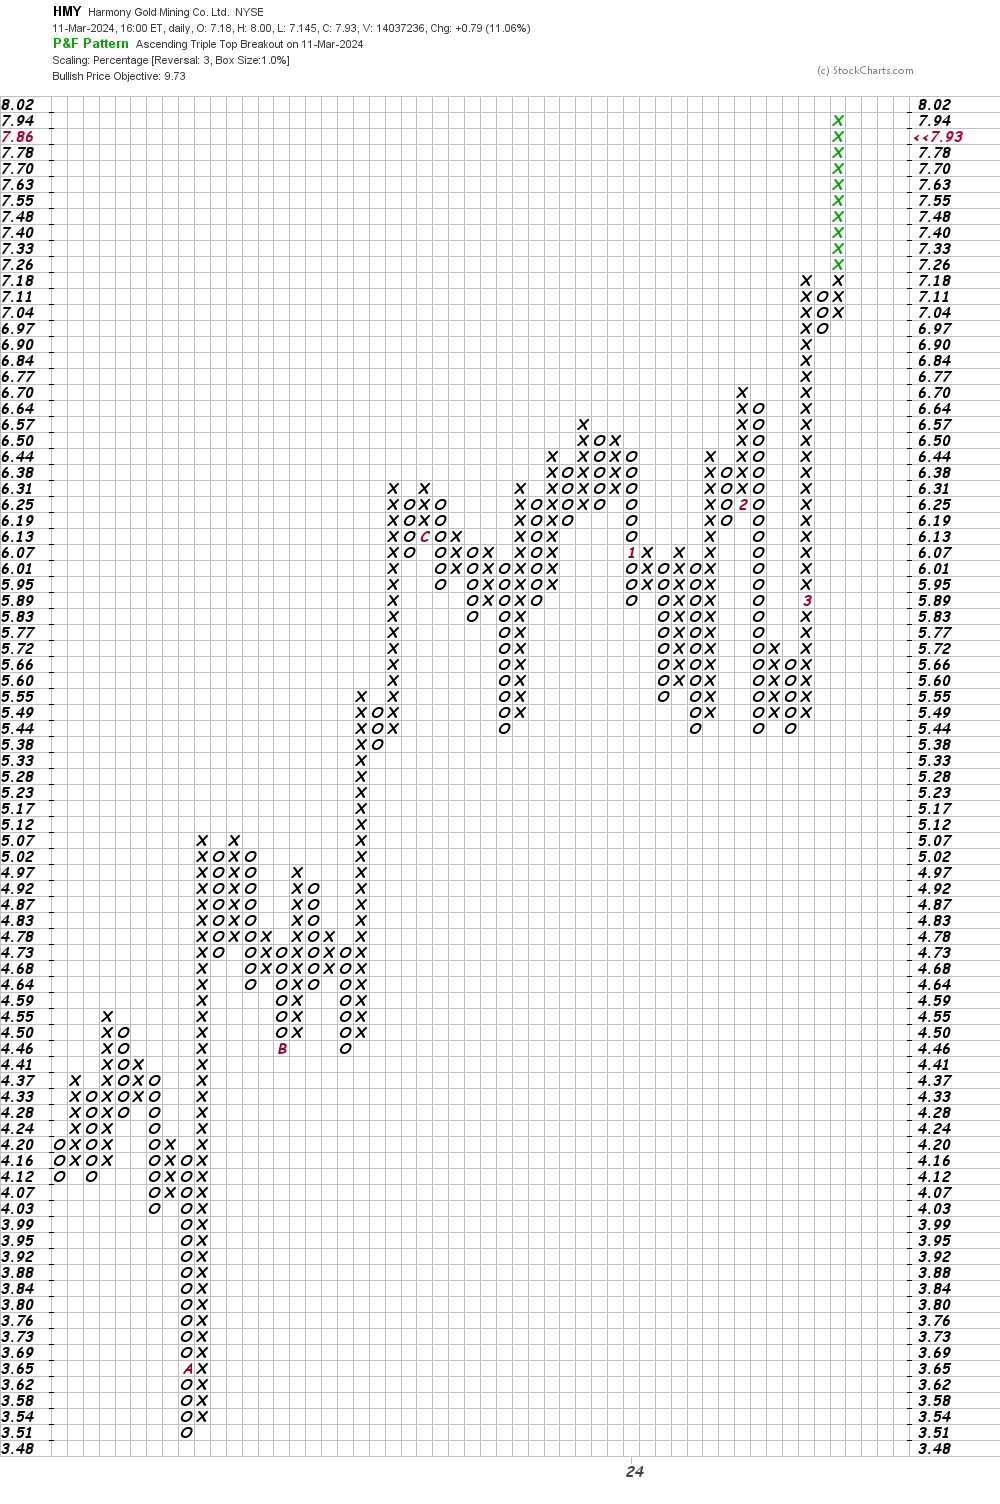
In this daily Point and Figure chart of HMY, below, I can see a potential upside price target in the $10 area.
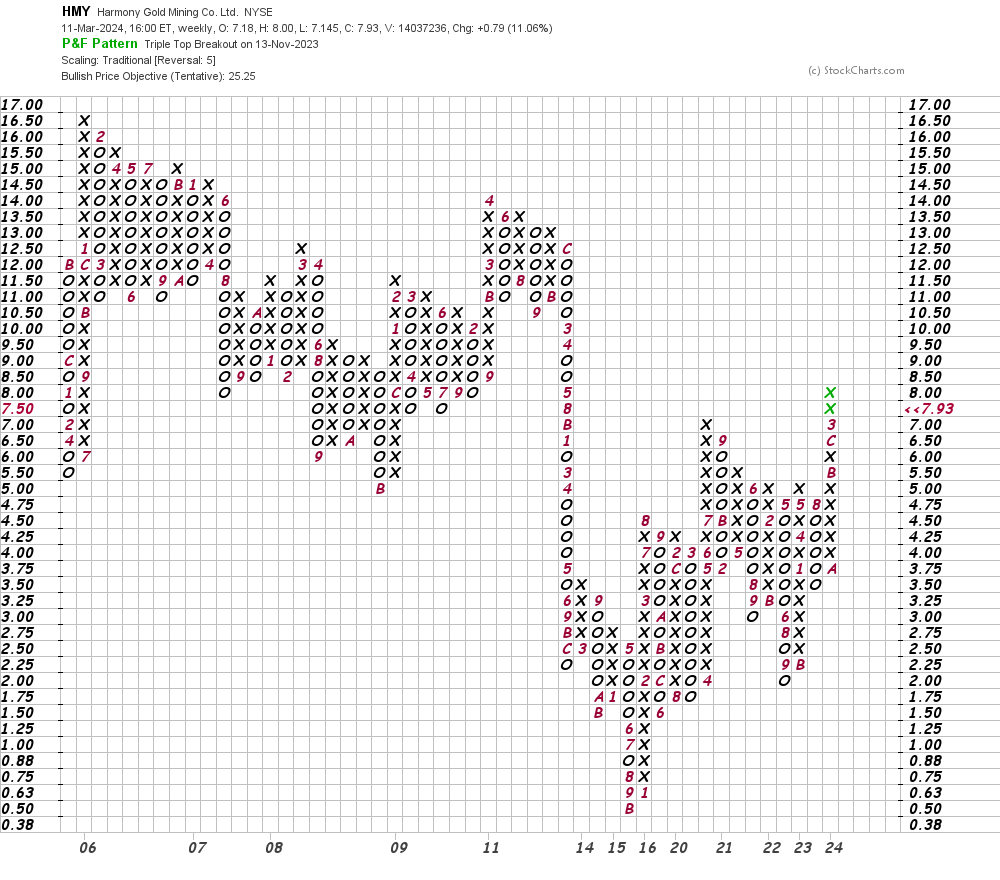
In this weekly Point and Figure chart of HMY, below, I used a five box reversal filter. Here the software suggests a longer-term target in the $25 area.
Bottom line strategy: Traders could go long HMY on a dip towards $7.50 risking to $6.00. $10 is my first price target.
Employees of TheStreet are prohibited from trading individual securities.