GameStop Surges as Meme Stocks Get New Life With 'Roaring Kitty' Post
Let's go with what we know and look at the meme stock's charts and indicators.
You've reached your free article limit
You've read 0 of 1 free Pro articles.
GameStop GME is trading higher Monday morning on the heels of reports that 'Roaring Kitty' revealed a $116M position by Keith Gill. Gill is a financial analyst and investor known for his posts on the subreddit r/wallstreetbets. He goes by DeepF— Value on Reddit, but media reports have not been verified. It shows five million shares bought at $21.27.
Let's go with what we know and look at the charts and indicators.
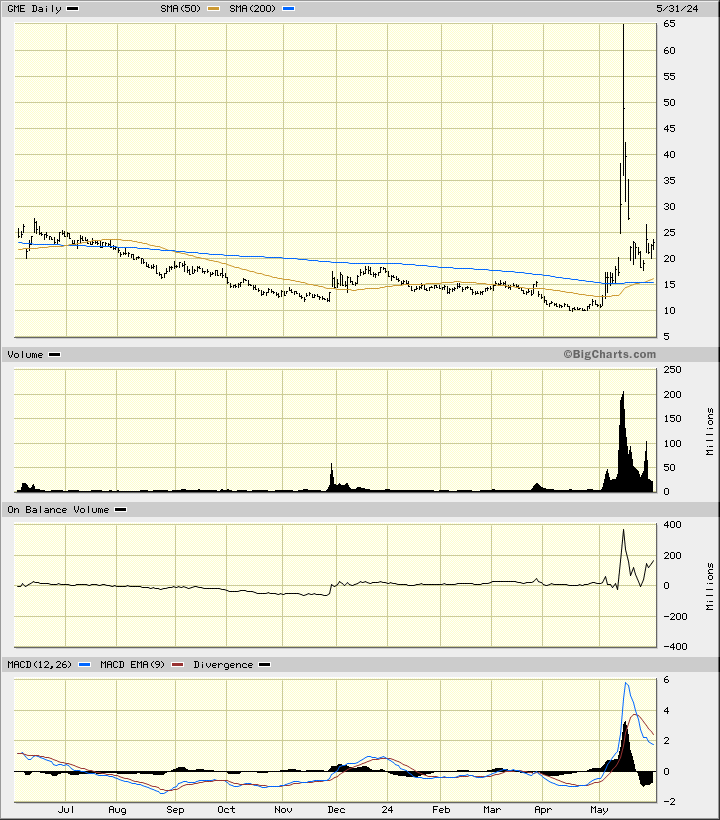
In the daily bar chart of GME, below, we have to imagine prices gapping higher and trading in the $40 area this Monday morning. The slope of the 50-day average line is positive and the 200-day moving average line is bottoming.
The On-Balance-Volume (OBV) line is pointed up and the Moving Average Convergence Divergence (MACD) oscillator is above the zero line.
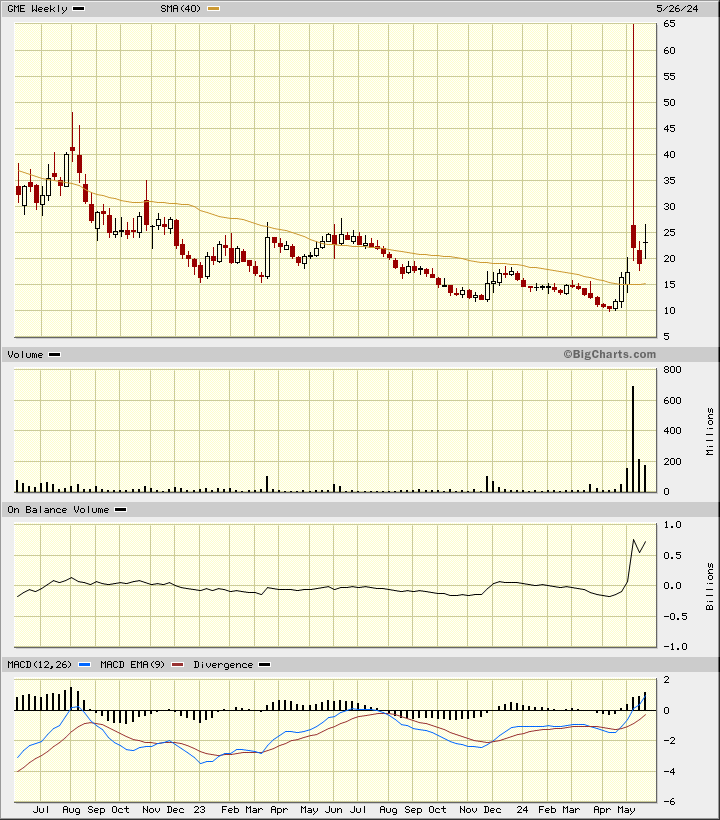
In the weekly Japanese candlestick chart of GME, below, I can see the last two years of price action. Prices have broken a downtrend (not drawn) and trade above the bottoming 40-week moving average line.
The most recent candle is a doji and indicates a balance between bulls and bears. A bullish candle this week will refresh the uptrend. The MACD oscillator is bullish.
In this daily Point and Figure chart of GME, below, I can see an upside price target in the $42 area. And here we are.
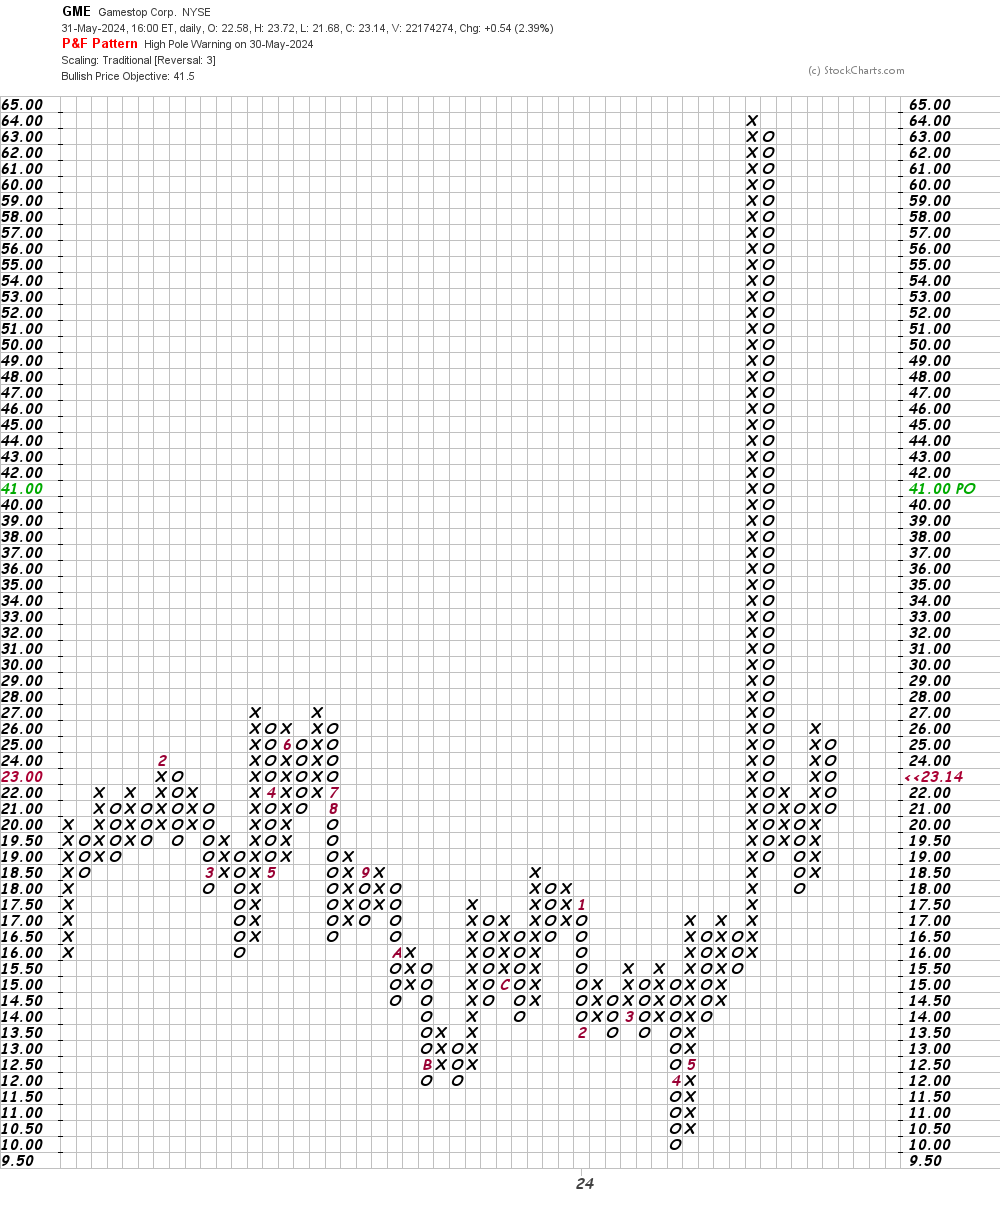
Bottom-line strategy: I am not a fan of meme stocks and how many traders have approached the space. Traders who are long GME from lower levels might consider taking profits in the $42 area.
More Gamestop:
- Forget Meme Players… What Is GameStop Really Worth?
- More Than a Meme? Don't Bury GameStop Just Yet
- Gaming GameStop? Read This First
Employees of TheStreet are prohibited from trading individual securities.