Eli Lilly Weakens Despite FDA Approval for Alzheimer's Drug: Change in Trend?
Here's why the stock dropped Wednesday and how it effects the outlook for the shares going forward.
You've reached your free article limit
You've read 0 of 1 free Pro articles.
Eli Lilly and Company LLY won FDA approval of donanemab for Alzheimer's on Tuesday. However, the shares are under selling pressure after President Joe Biden and Senator Bernie Sanders called on Eli Lilly and Novo Nordisk NVO to lower prices for their popular weight loss drugs in a jointly authored opinion piece published on Tuesday.
Let's check out the chart points and indicators for LLY.
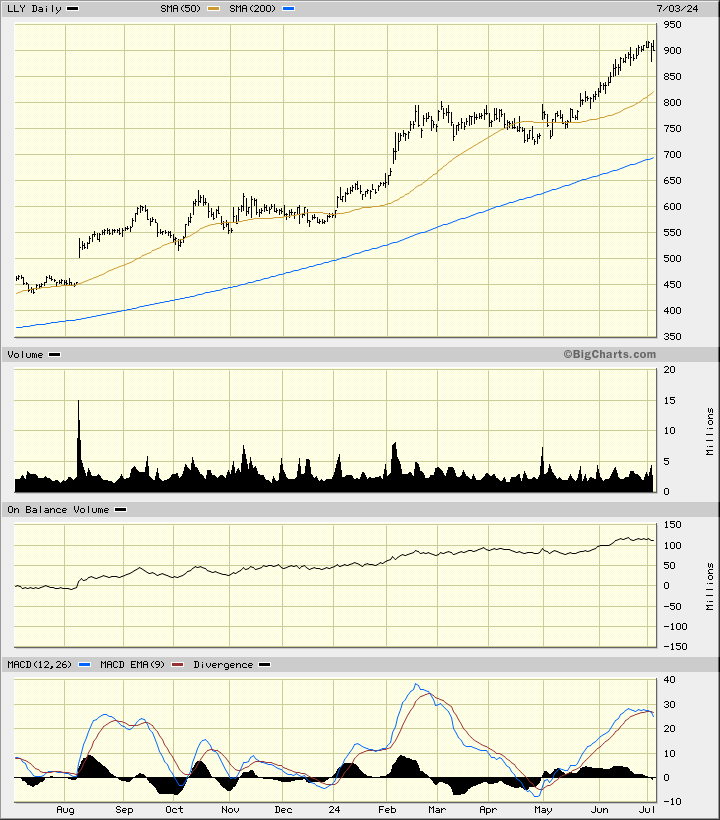
In the daily bar chart of LLY, below, I can see that the shares turned lower Wednesday after making a slightly higher new 52-week high. A new high followed by a weak close can be a one-day reversal pattern. Prices are still above the rising 50-day moving average line and above the rising 200-day line.
The trading volume is neutral but the daily On-Balance-Volume (OBV) line has started to "roll over" and the Moving Average Convergence Divergence (MACD) oscillator is crossing to the downside at a lower high.
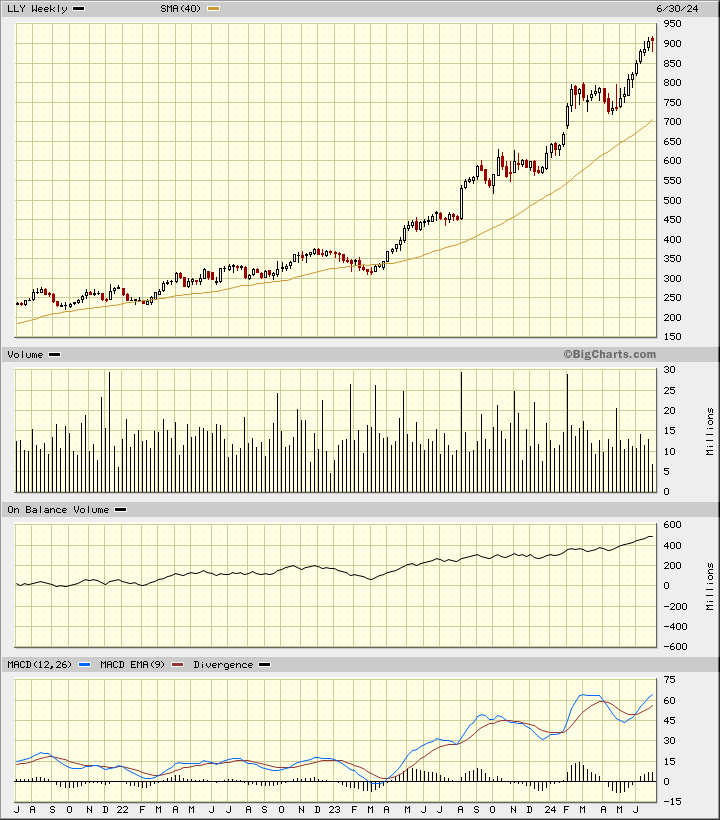
In this weekly Japanese candlestick chart of LLY, below, I can see that the most recent candlestick pattern is a potential hanging man reversal pattern. We'll see.
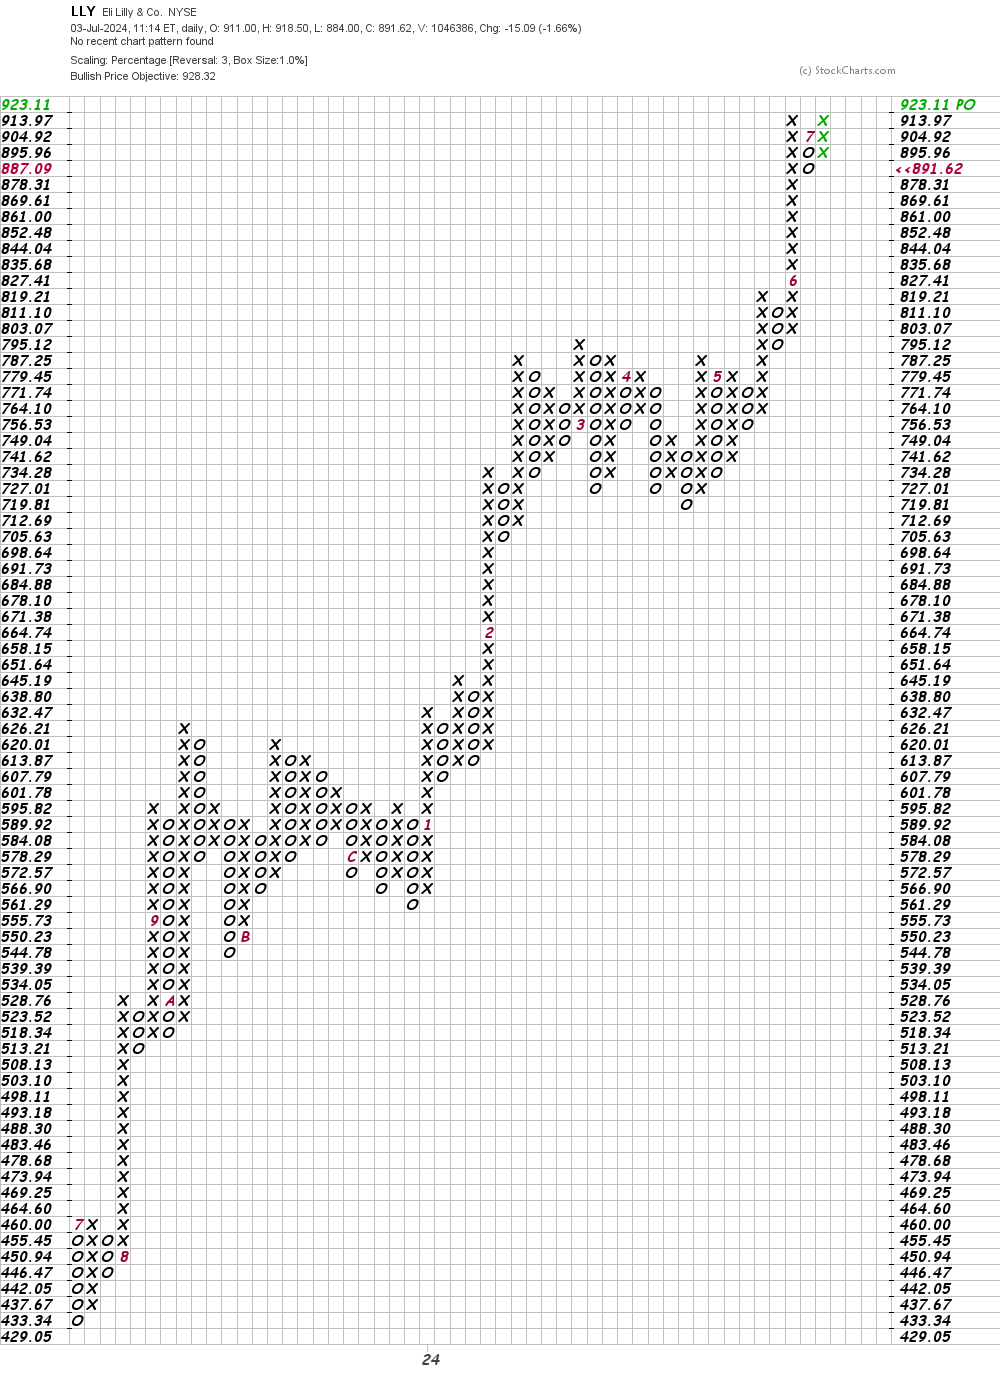
In this daily Point and Figure chart of LLY, below, I can see a nearby upside price target of $928 but a trade at $878 or lower may start to weaken this chart.
Bottom-line strategy: In my June 24 update on LLY I gave traders a heads up that we could get a trend change on LLY. This may be it.
Employees of TheStreet are prohibited from trading individual securities.