A 'Heads Up' on Eli Lilly as the Stock Continues to Climb
Here's what traders and investors need to watch closely.
You've reached your free article limit
You've read 0 of 1 free Pro articles.
Pharmaceutical giant Eli Lilly LLY has made a very strong rally the past three years on the heels of its obesity drug and its solid pipeline of potential drugs in high demand, a.k.a. blockbusters.
Let's check out the charts and indicators to see if this rally is "showing its age."
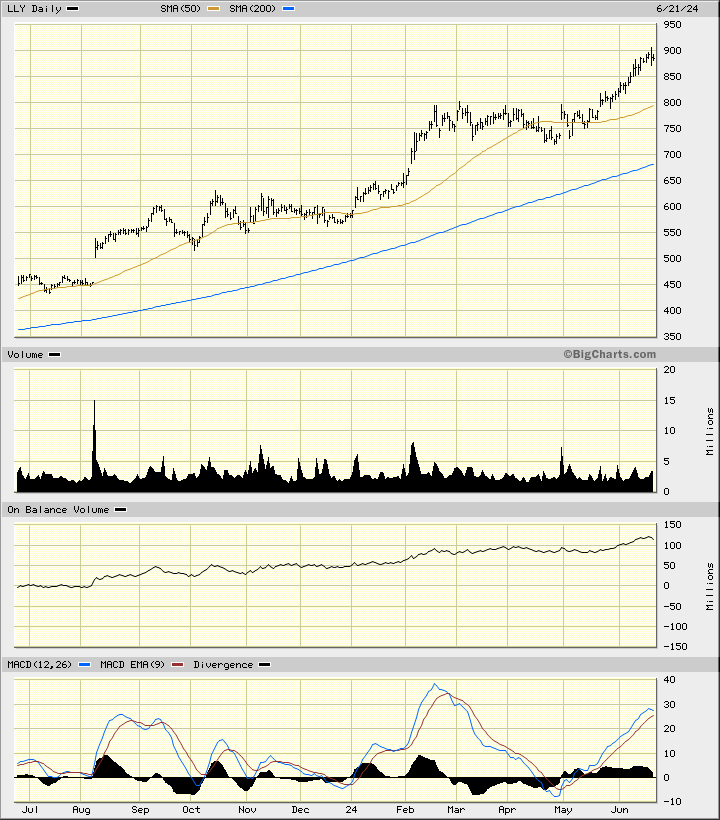
In the daily bar chart of LLY, below, I can see that the shares have doubled in the past 12 months. LLY trades above the rising 50-day moving average line and above the rising 200-day moving average line.
The daily volume histogram shows steady and active turnover this year. The daily On-Balance-Volume (OBV) line has been rising the past 12 months. The Moving Average Convergence Divergence (MACD) oscillator is in a bullish alignment above the zero line but has narrowed slightly in recent days.
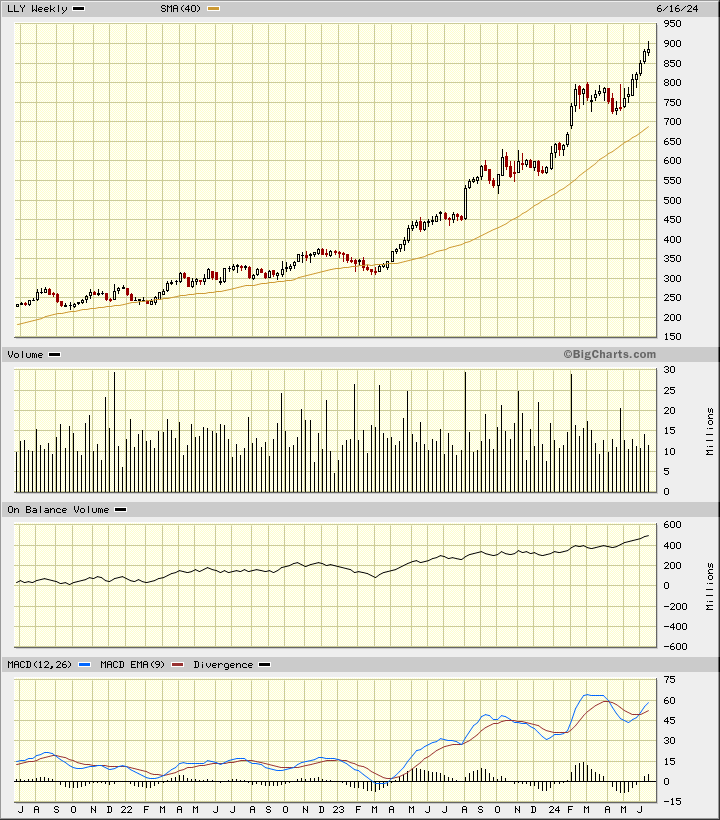
In this first weekly Japanese candlestick chart of LLY, below, I see a mostly bullish setup. Prices are in a longer-term ascent and trade above the rising 40-week moving average line. The most recent weekly candlestick pattern could be a top reversal pattern but it will need bearish confirmation this week.
The trading volume is active. The weekly OBV line is rising and the MACD oscillator has just crossed upwards for a new buy signal.
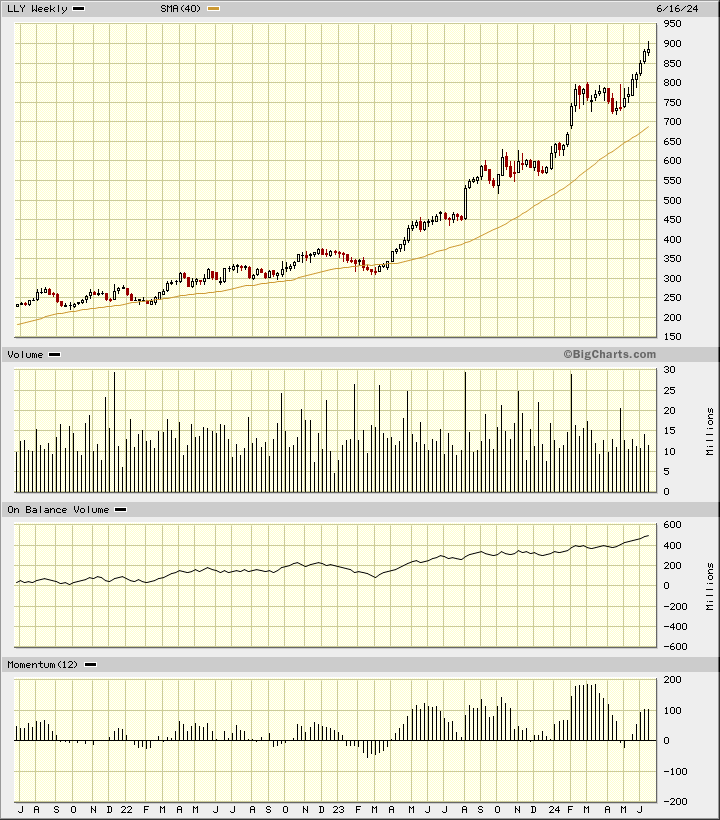
In the second weekly Japanese candlestick chart of LLY, below, I just swapped the MACD oscillator for the 12-week momentum study. The momentum study shows us a bearish divergence in June with weaker momentum readings even though prices made new highs for the move up. This divergence could be foreshadowing a period of price weakness ahead.
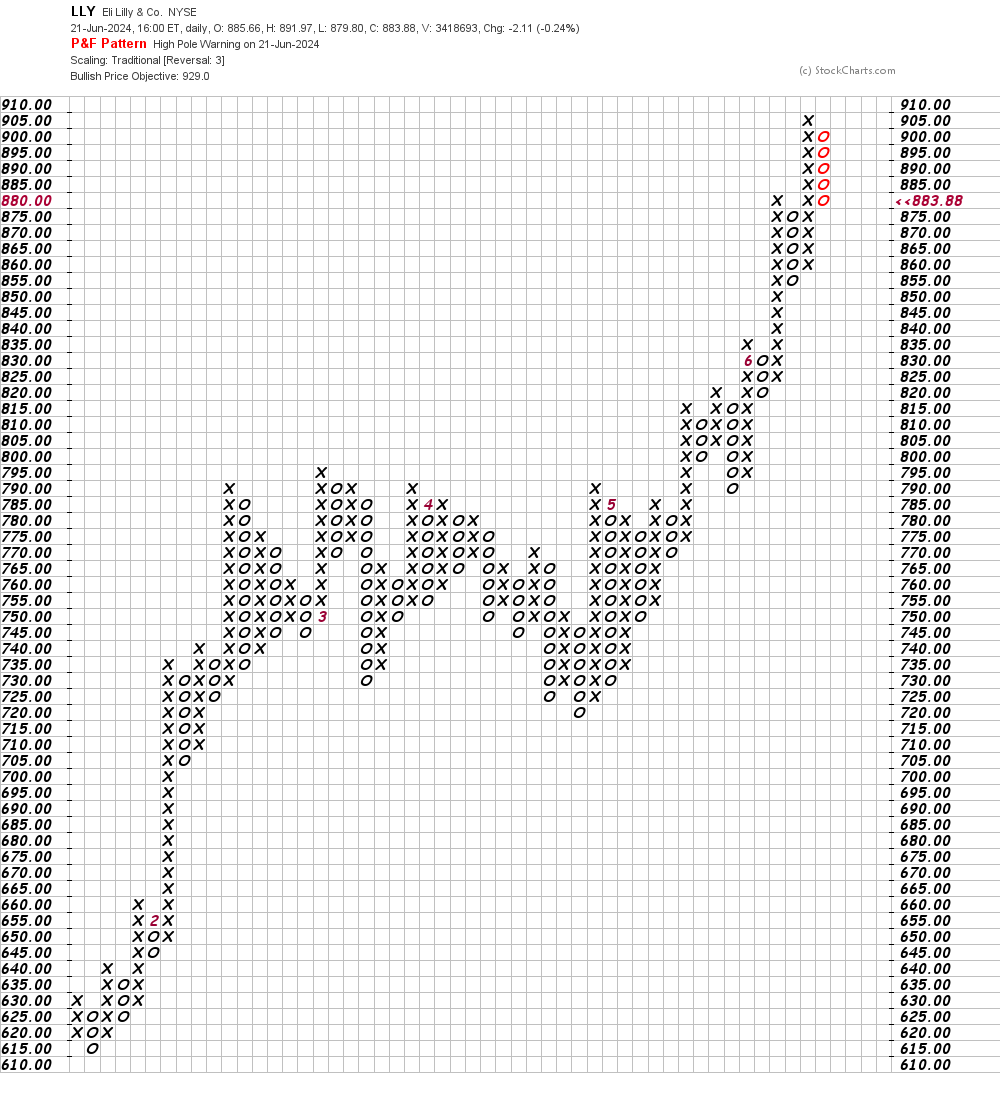
In this daily Point and Figure chart of LLY, below, I can see an upside price target in the $929 area. A trade at $850 will weaken this chart.
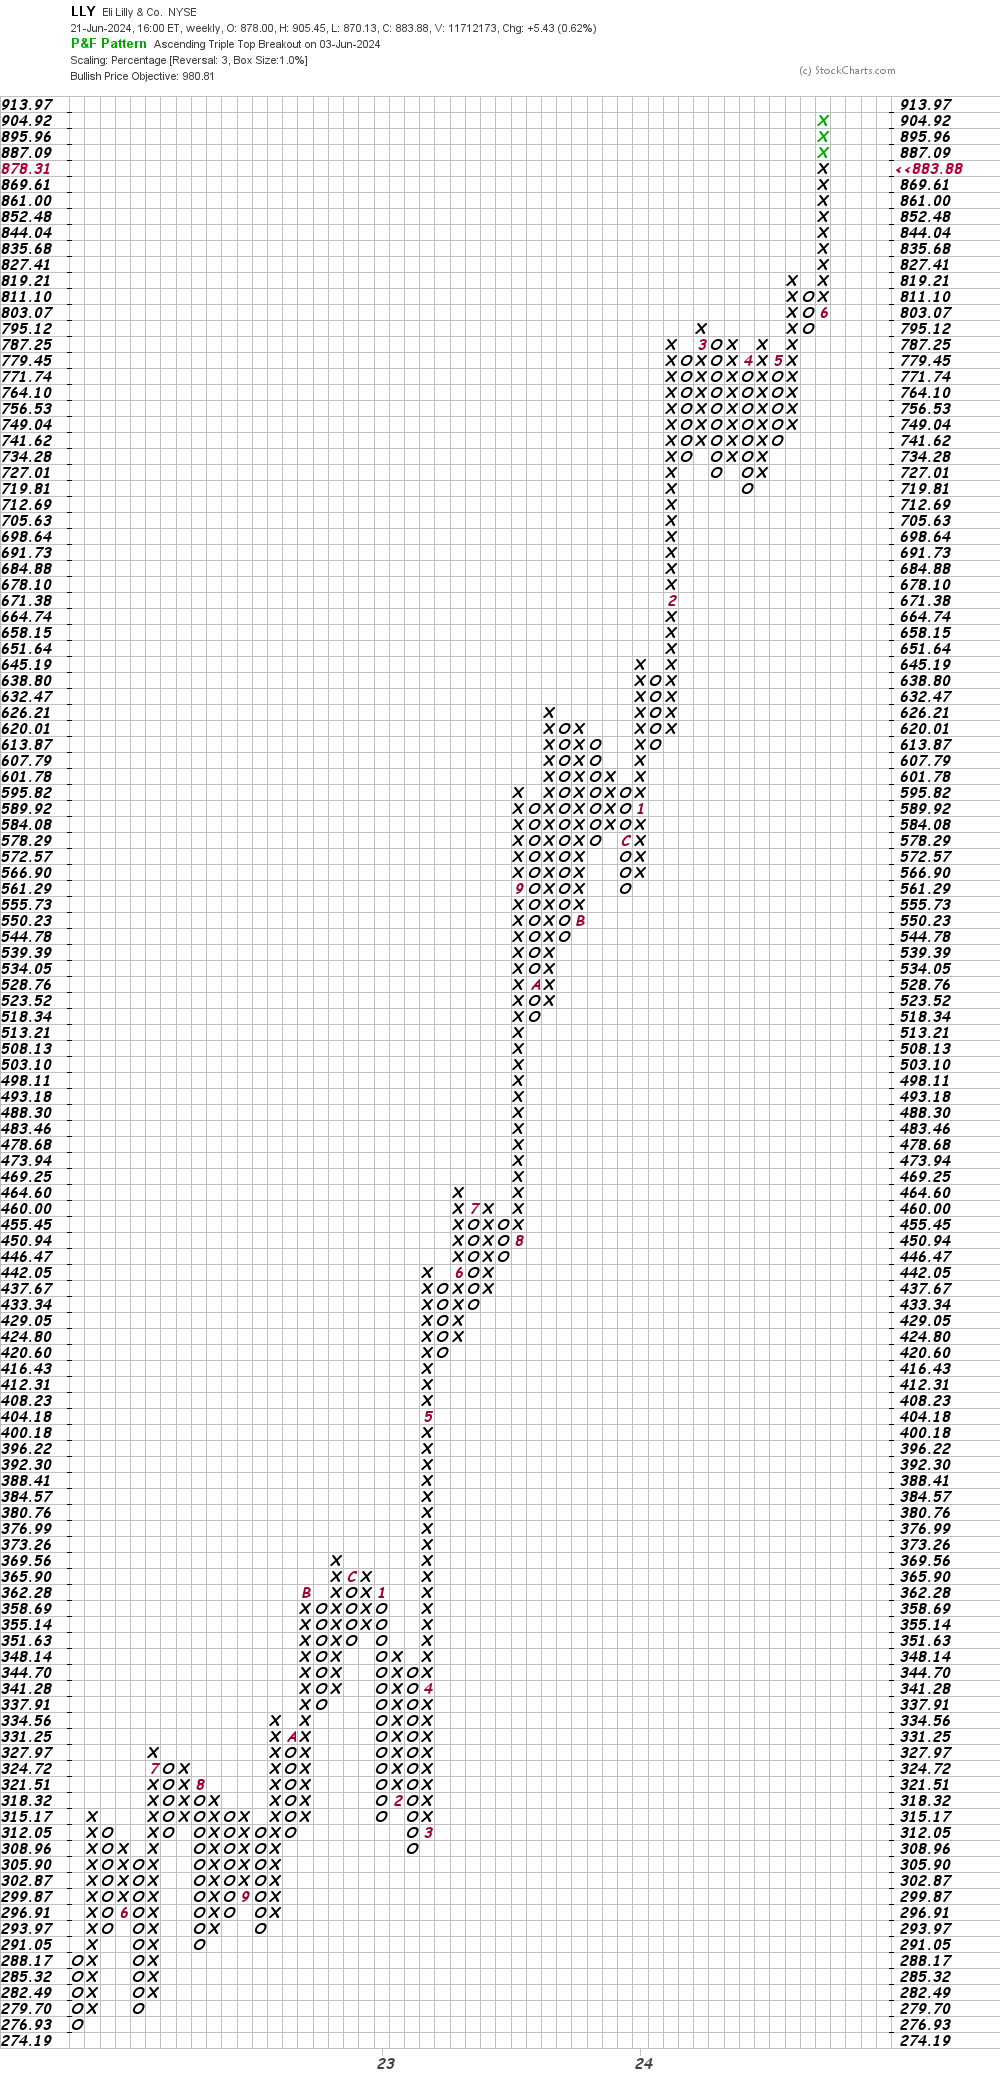
In this weekly Point and Figure chart of LLY, below, I can see that the software is projecting a price target in the $981 area.
Bottom-line strategy: The charts of LLY, above, are currently mixed. Price momentum is a leading indicator and momentum often peaks before prices peak. Momentum divergences do not give us hard-and-fast buy-and-sell signals.
Momentum has begun to slow so this is a "heads up" to traders and investors to watch things closer and maybe raise sell stops to take some money off the table.
Employees of TheStreet are prohibited from trading individual securities.