These Are the Best and Worst Stocks in the Dow
With the Dow Jones Industrial Average on a roll, I identify the strongest and weakest-looking names in the index. And for the very first time here, I'm recommending a short position.
You've reached your free article limit
You've read 0 of 1 free Pro articles.
Subscribers should now have had an opportunity to read my stock-by-stock "checkup" of all the names in the Dow Jones Industrial Average (DJIA). If you haven't yet, please click here for Part 1 and here for Part 2.
Now, let's examine the best-looking stock and worst-looking stock in the DJIA.
Drumroll please.
Simply the Best
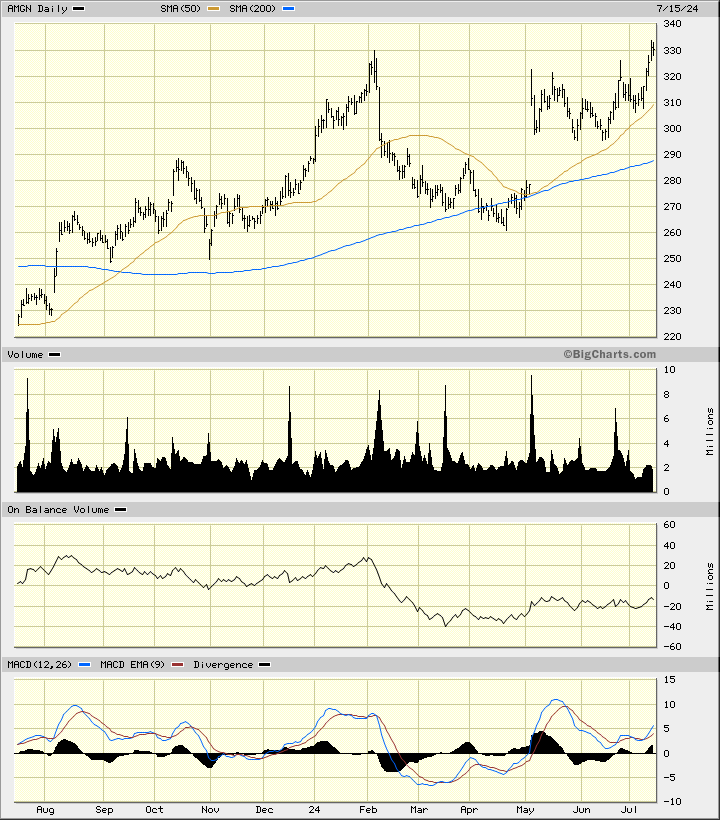
In Part 1 of my Dow checkup I looked at shares of Amgen AMGN. The charts of AMGN, below, are bullish with some impressive targets. When I reviewed AMGN on June 25 I recommended a purchase.
In this updated daily bar chart of AMGN, below, I can see a potential upper-level cup-and-handle pattern. The shares trade above the rising 50-day moving average line and above the rising 200-day line.
The OBV line has been improving since March. The MACD oscillator is above the zero line and rising.
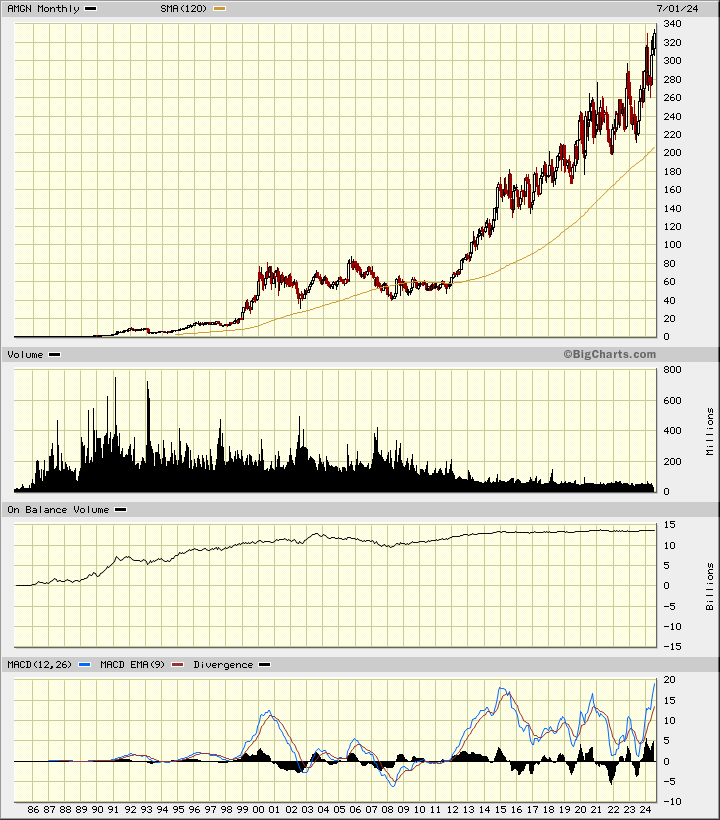
In this monthly Japanese candlestick chart of AMGN, below, I can see an enduring rally going back to 1985.
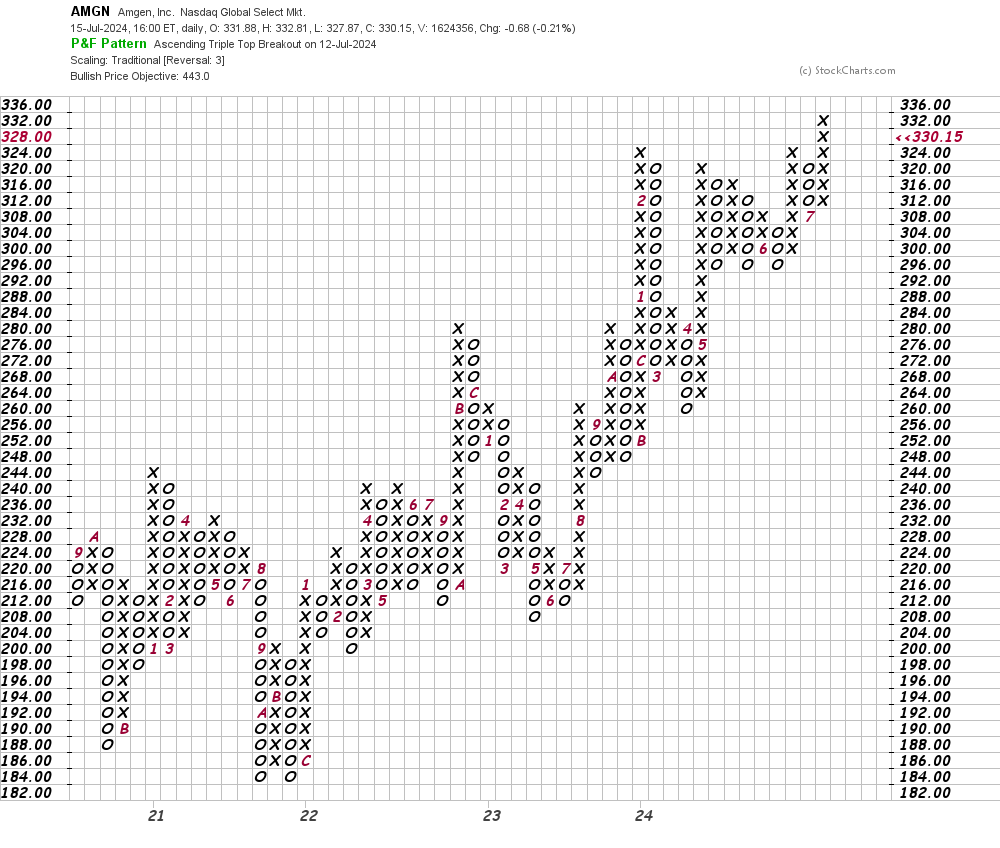
In this daily Point and Figure chart of AMGN, below, I can see that the software is projecting a price target in the $443 area.
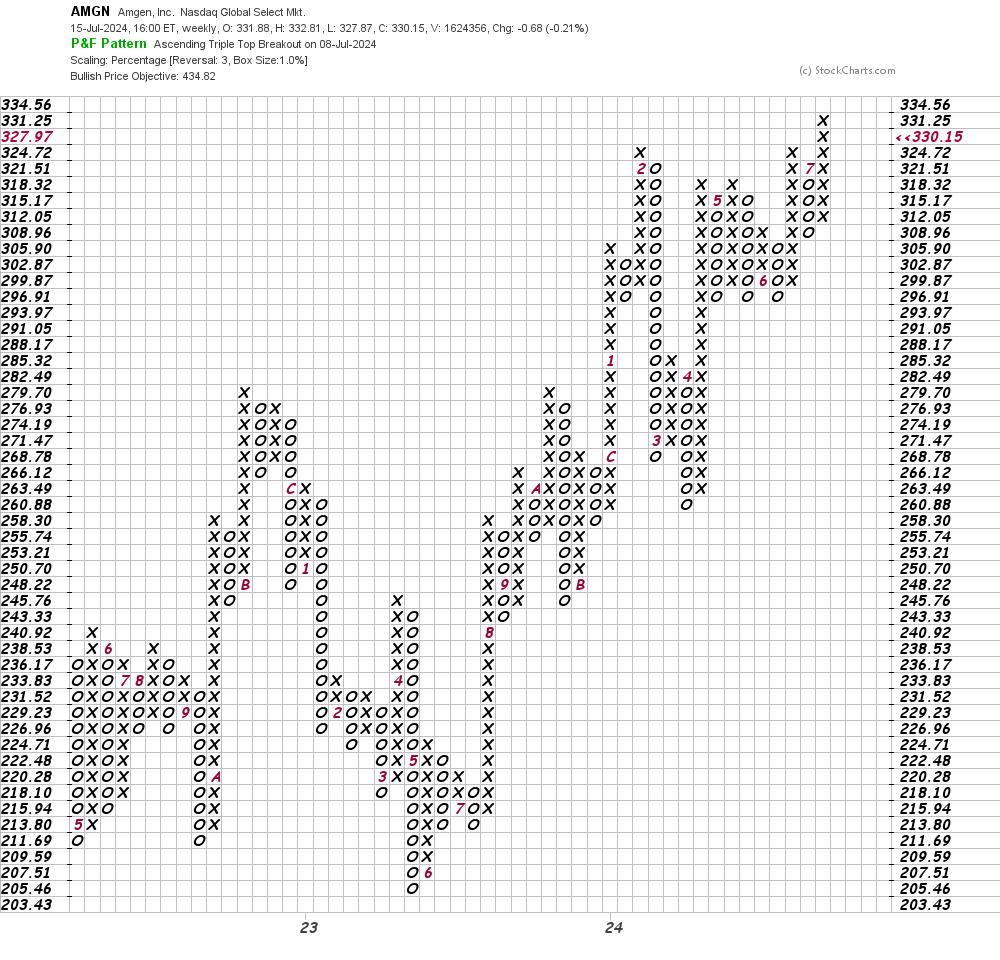
In this first weekly Point and Figure chart of AMGN, below, I can see a price target in the $435 area.
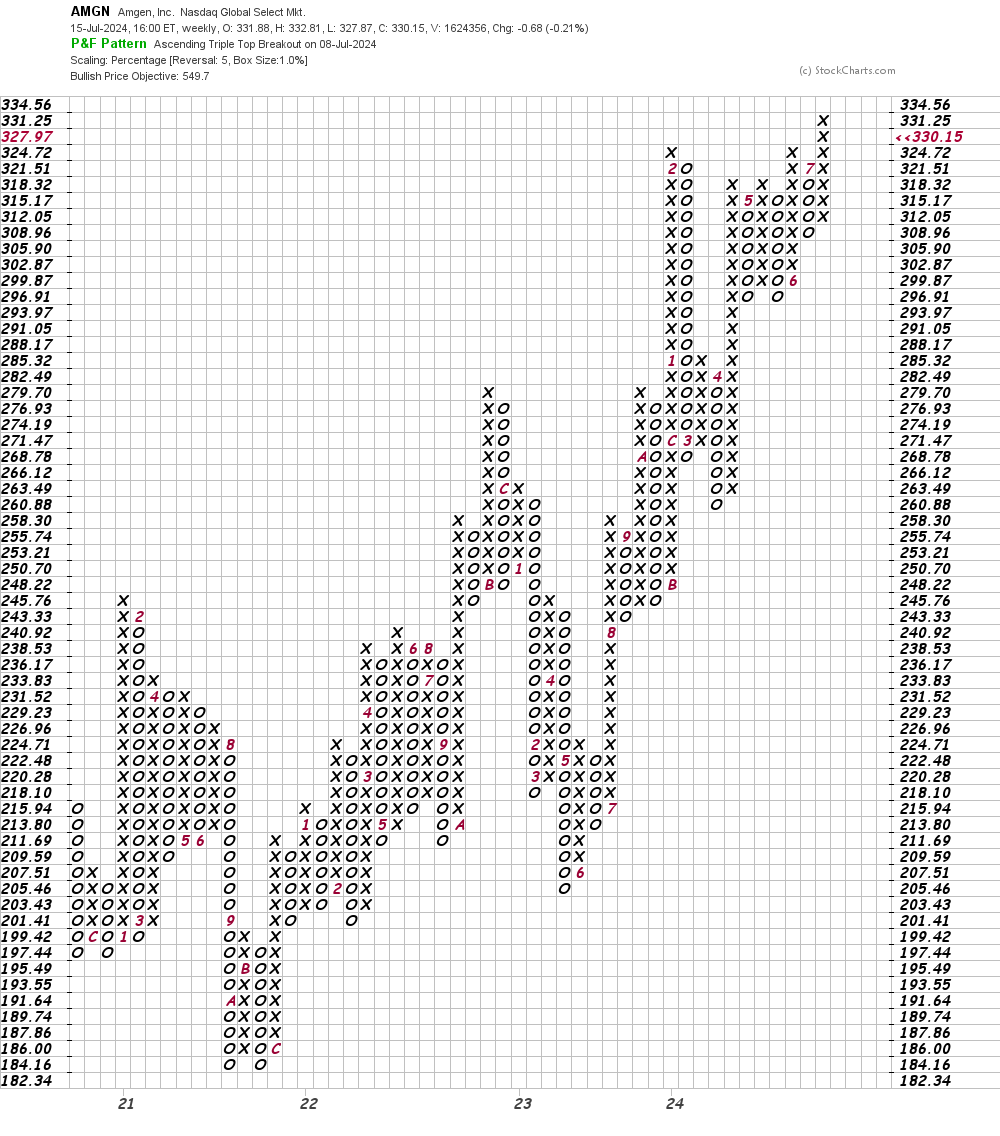
In this second weekly Point and Figure chart of AMGN, below, I used a five-box reversal filter. Here the software shows us a $550 price target.
If the Shoe Fits...
I believe that Nike NKE is the weakest-looking chart in the DJIA. I reviewed the charts of NKE on June 28 and the picture was bearish.
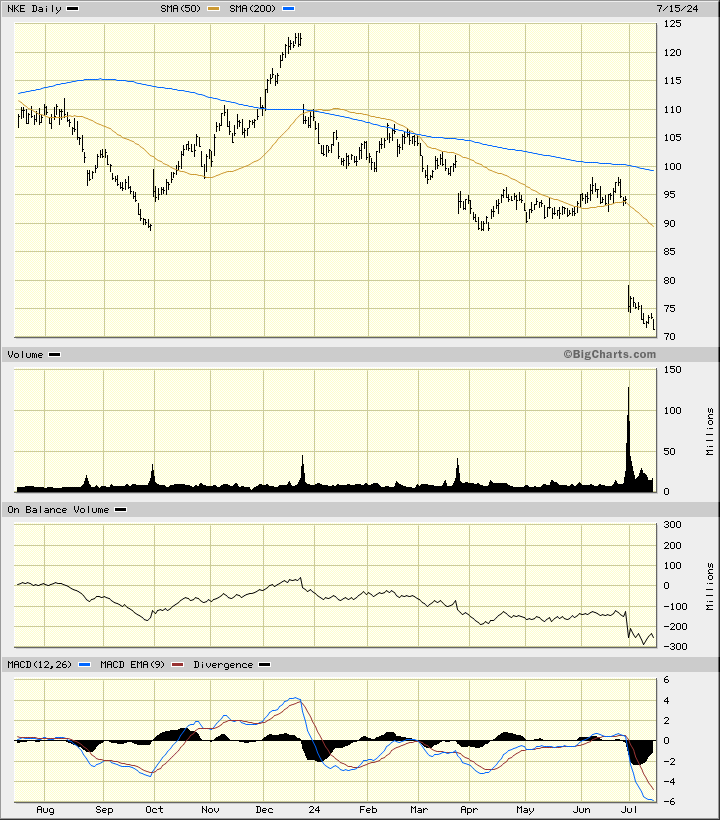
In this updated daily bar chart of NKE, below, I can see that prices made a new 52-week low on Monday.
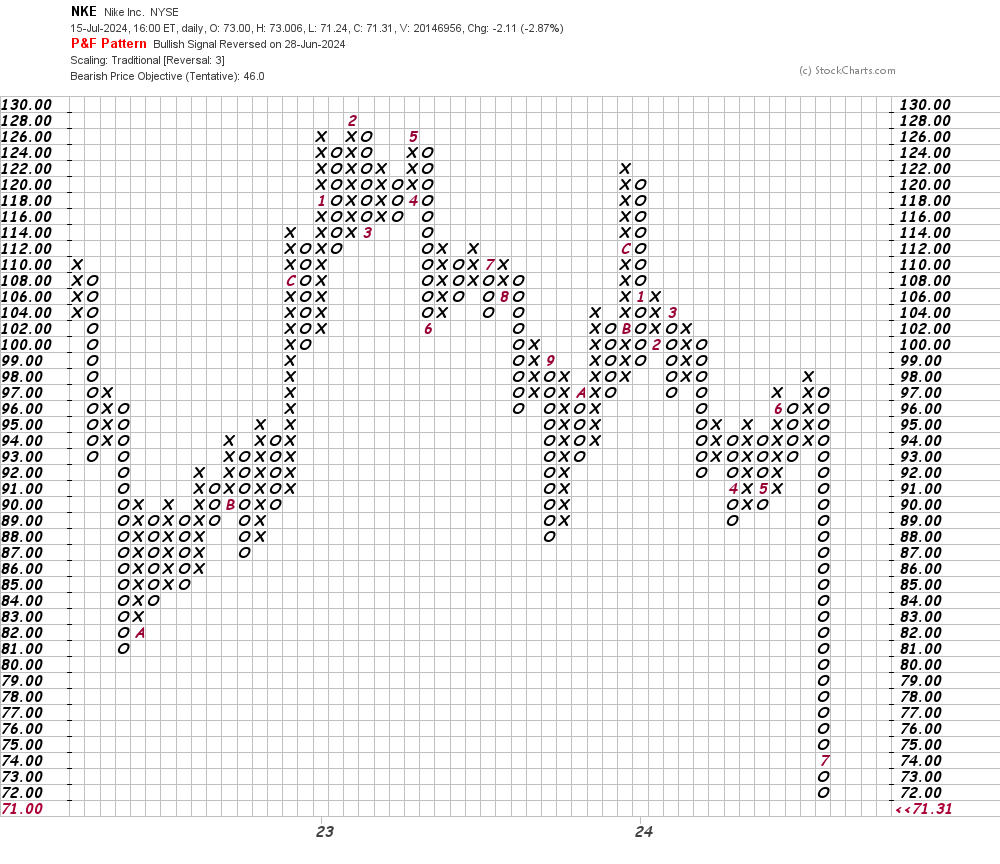
In this daily Point and Figure chart for NIKE, below, I can see a price target in the $48 area.
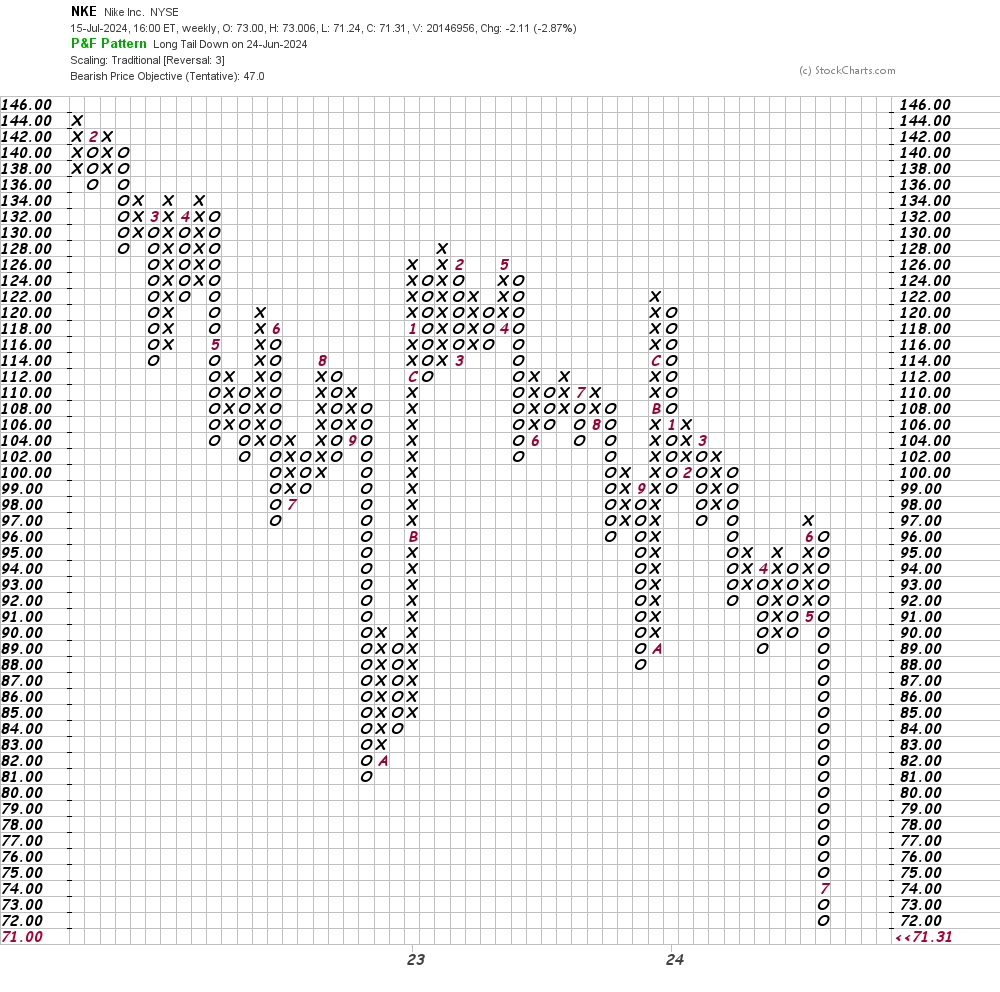
In this weekly Point and Figure chart of NKE, below, I see a $47 price target.
Bottom-Line Strategy
in all my years of writing for TheStreet Pro I have never recommended a short position. Today will be the exception.
Experienced traders could consider a trade of going long AMGN and short NKE.
Employees of TheStreet are prohibited from trading individual securities.