The Dow Is Due for a Checkup
In part 1 of our deep dive series into the technicals of the Dow Jones industrial average we examine Amazon, Apple, Home Depot, Amgen and many more stocks.
You've reached your free article limit
You've read 0 of 1 free Pro articles.
The Dow Jones industrial average just made a record high on Monday, closing at 40,211.72.
This marks a long climb for the historically important index, which has a price history going back to 1896. The last time we popped the hood on the Dow and looked at its 30 stocks was Dec. 14, when it closed around 37,248.
Here, in this first part of our deep dive into the Dow, we'll inspect each stock -- starting the Magnificent Seven tech star Amazon AMZN -- and check the slopes of the 200-day moving averages, see how many stocks are trading above the rising 200-day line, and how many have a negative 200-day line and how many are neutral. In short, we'll see whether the technicals of the stocks have improved over the last seven months, or if we're finding weakness below the surface.
Let's dig in.
Amazon, as we can see chart below, is in an uptrend and trades above the positively sloped 200-day moving average line. The daily On-Balance-Volume (OBV) line is steady and I do not see a bearish divergence from the 12-day momentum study.
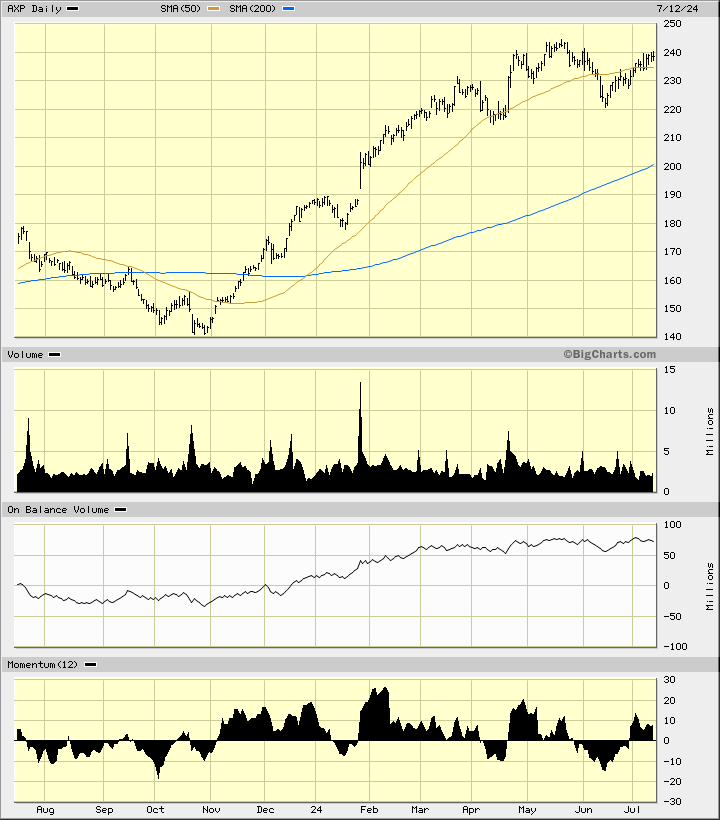
Next on the list is American Express AXP, below, which is also in an uptrend and trades above the rising 200-day moving average line. The daily OBV line is stalled, while the 12-day momentum study shows us a bearish divergence with weakening momentum readings since February, despite prices making higher highs.
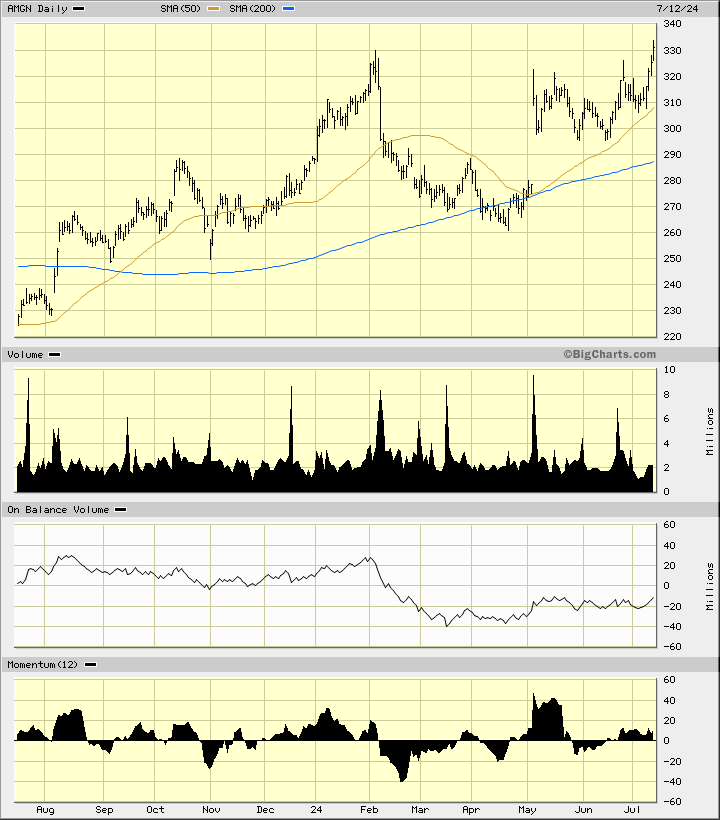
The charts of Amgen AMGN are perhaps the strongest of all the DJIA names. Prices are trading above the rising 50-day moving average line and above the rising 200-day moving average line. The OBV line has improved since the middle of March and the momentum study shows me a bullish divergence since February.
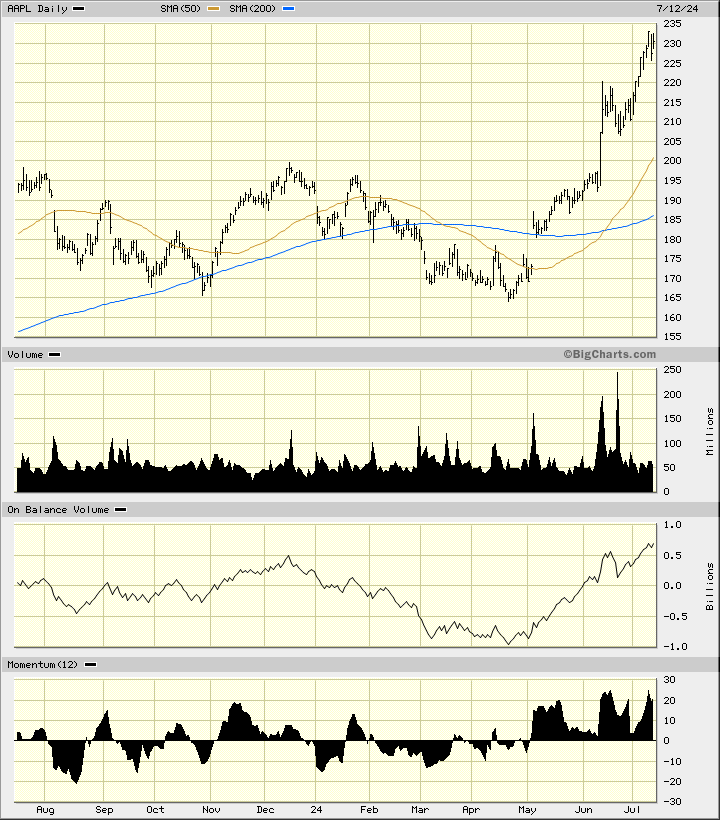
Apple AAPL became a member of the DJIA in 2015 when it replaced AT&T T. It has had a very positive impact on the DJIA for sure. Prices have surged sharply higher in the past three months. The slopes of the 50-day and 200-day averages are positive. The trading volume has been increasing. The OBV line has been very strong but the momentum readings have generated a bearish divergence with roughly equal-highs while prices made higher-highs.
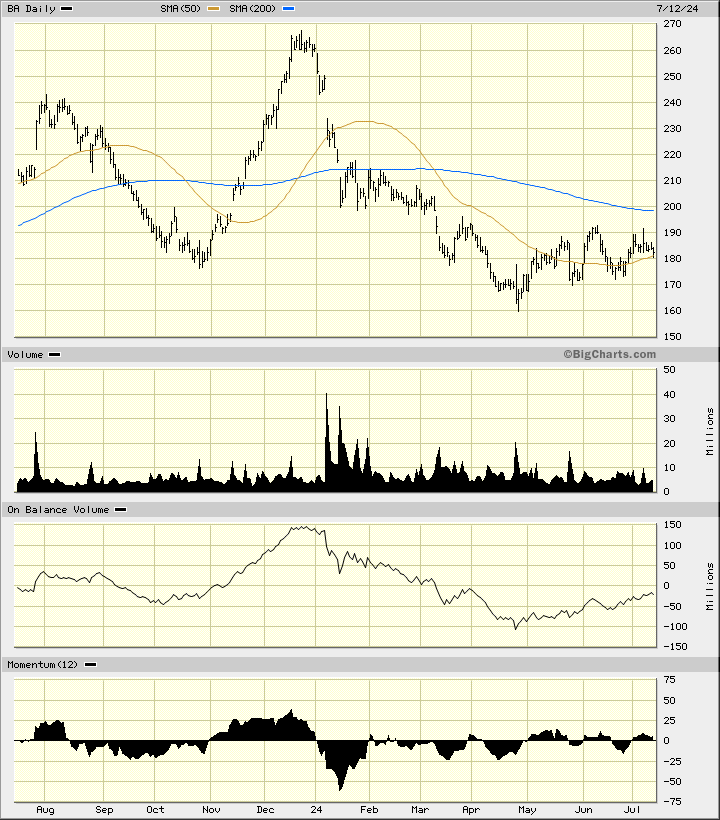
Next up is Boeing BA and that is the first of nine stocks that are flat to down. Prices trade below the bearish 200-day moving average line. The OBV has declined since December but shows improvement since late April. Momentum has been improving since January but it hasn't resulted in a sustained advance.
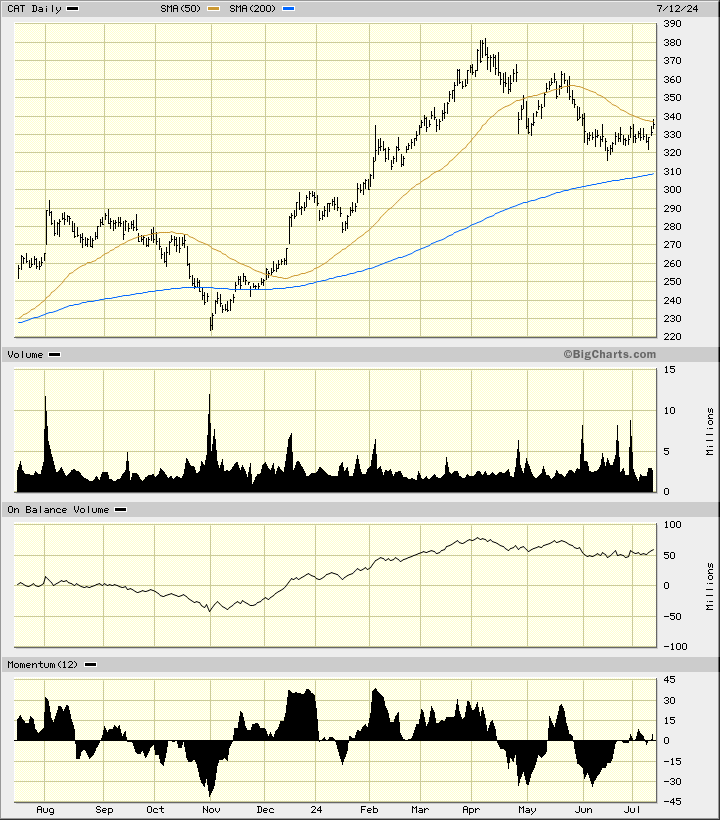
Caterpillar CAT is in an uptrend for now but the 200-day moving average line is cresting (the slope is weakening) and prices are below the declining 50-day line. The OBV has weakened since early April. The momentum study is mixed.
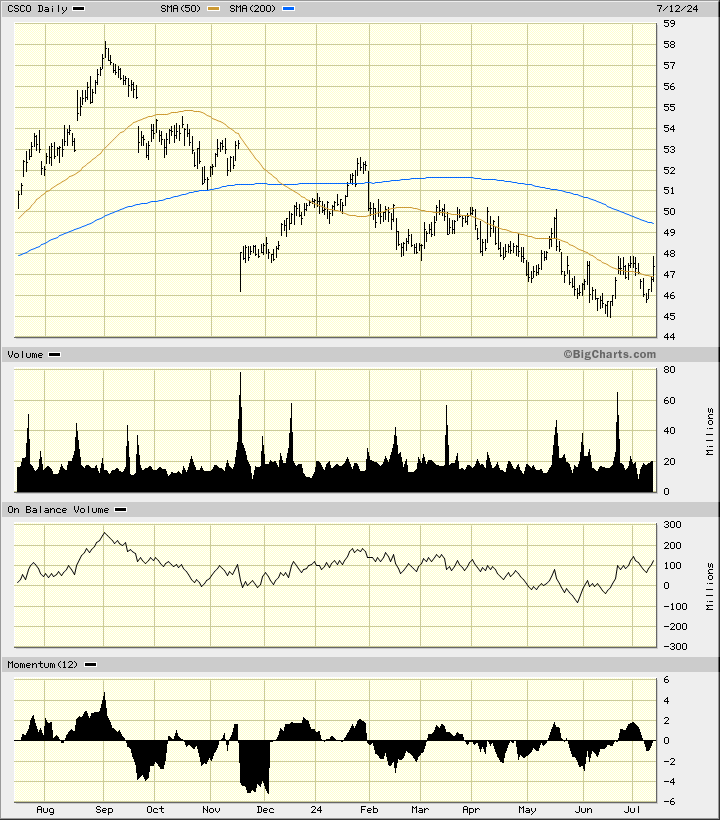
Cisco CSCO has been weakening since early September. Prices are trading below the negatively sloped 200-day moving average line. The daily OBV line has been moved generally lower the past year. The momentum study is not showing us a bullish divergence.
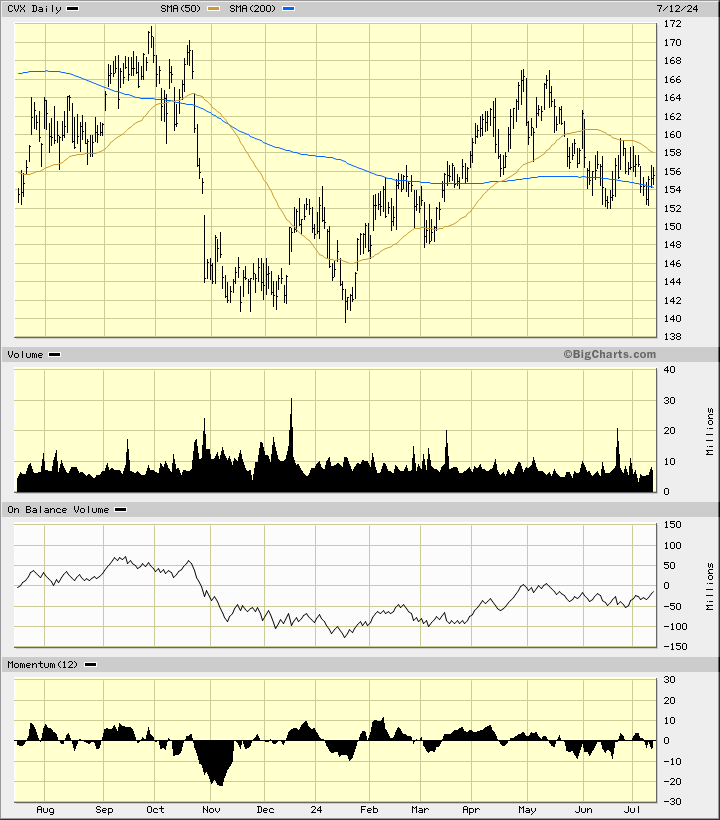
In this chart of Chevron CVX I can see that prices are trading below the declining shorter 50-day average line and are trading around the declining 200-day line. The OBV line has struggled since May. The momentum study is not foreshadowing a rally in my opinion.
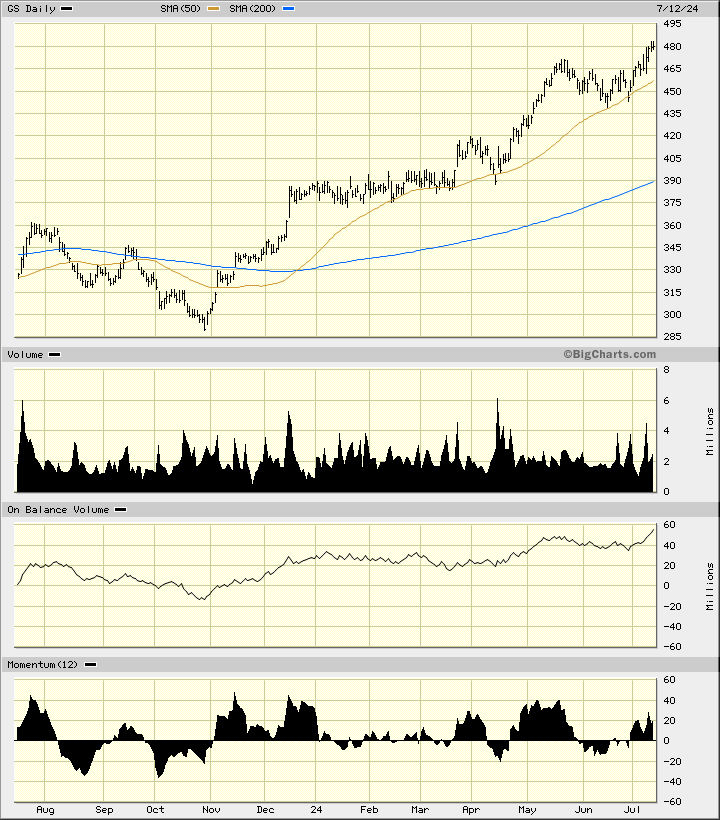
Goldman Sachs GS has been powering higher on the chart (see below) and trades above the rising 200-day moving average line. The OBV line is supportive but the 12-day momentum study has weakened from May to July for a bearish divergence.
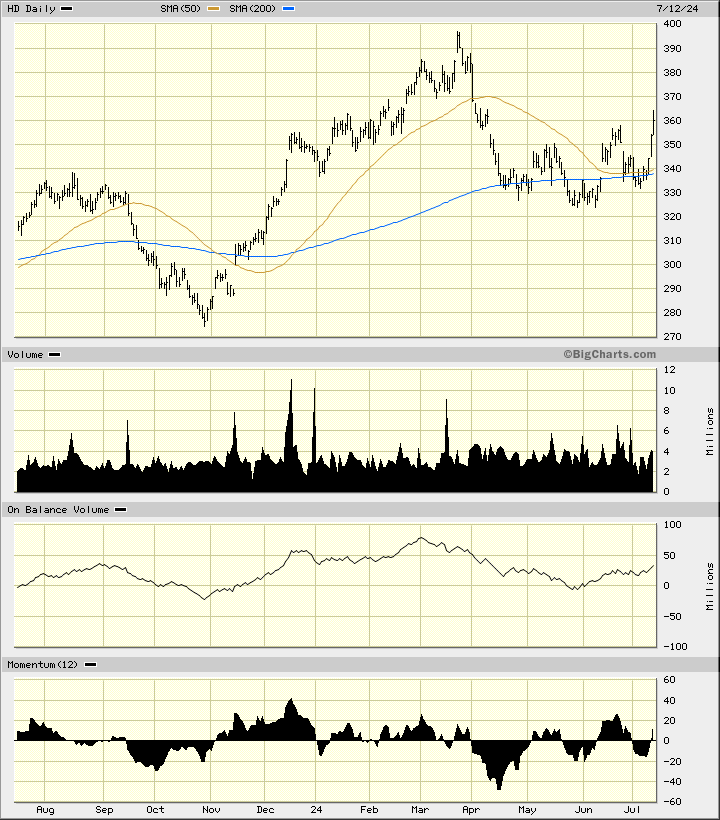
Home Depot HD falls into the category of having a flat 200-day moving average line. Prices are down from their March zenith. The OBV line shows only limited gains the past six weeks. The momentum study has been improving since April.
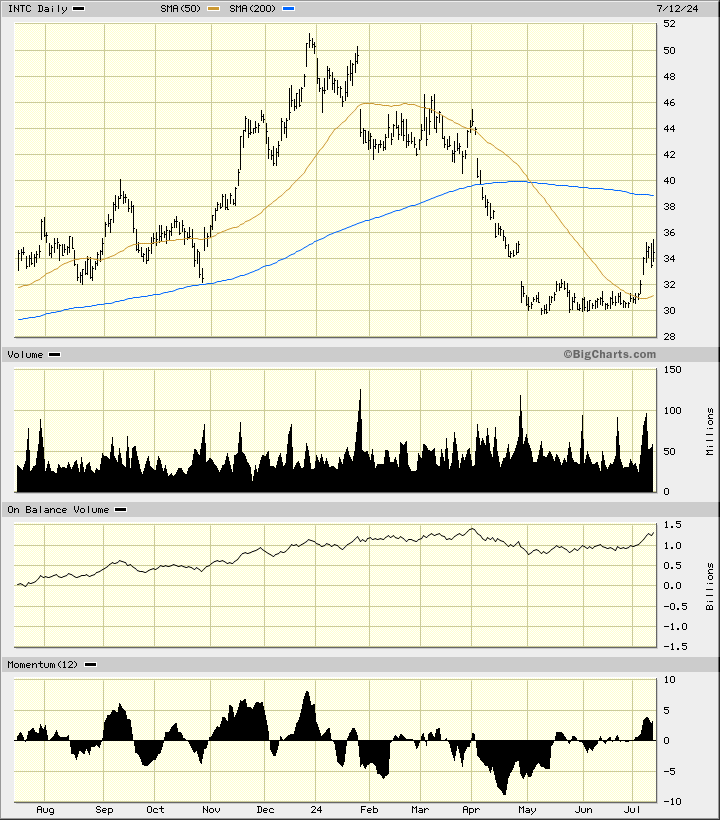
Intel INTC has not helped the DJIA get to 40,000. Prices have weakened for most of 2024. INTC trades below the declining 200-day moving average line. The OBV line is sluggish.
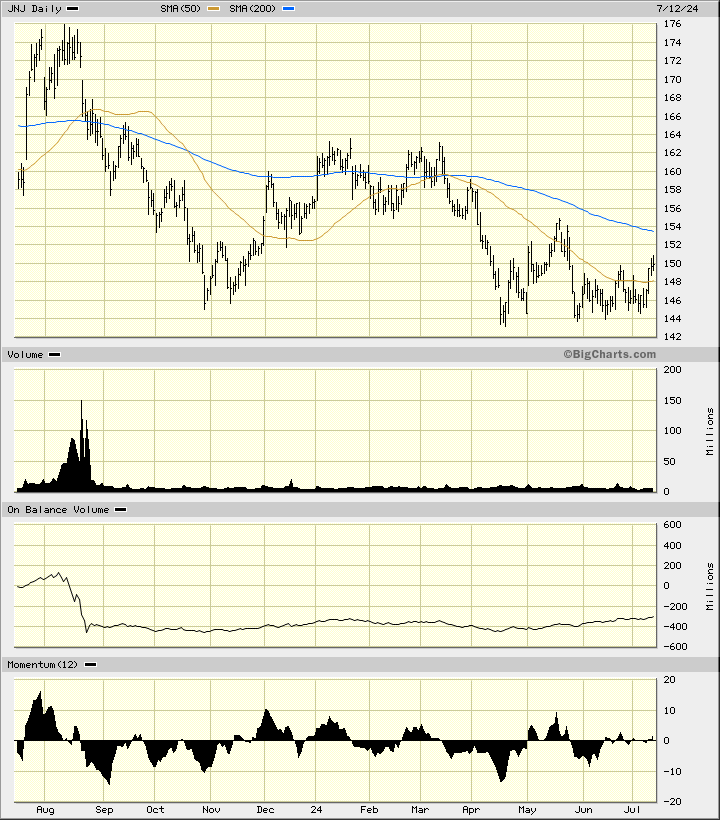
Johnson & Johnson JNJ has been in a downward trend the past 12 months. Prices trade below the negatively sloped 200-day moving average line. The OBV line and the momentum study are not giving us reasons to expect a rally right now.
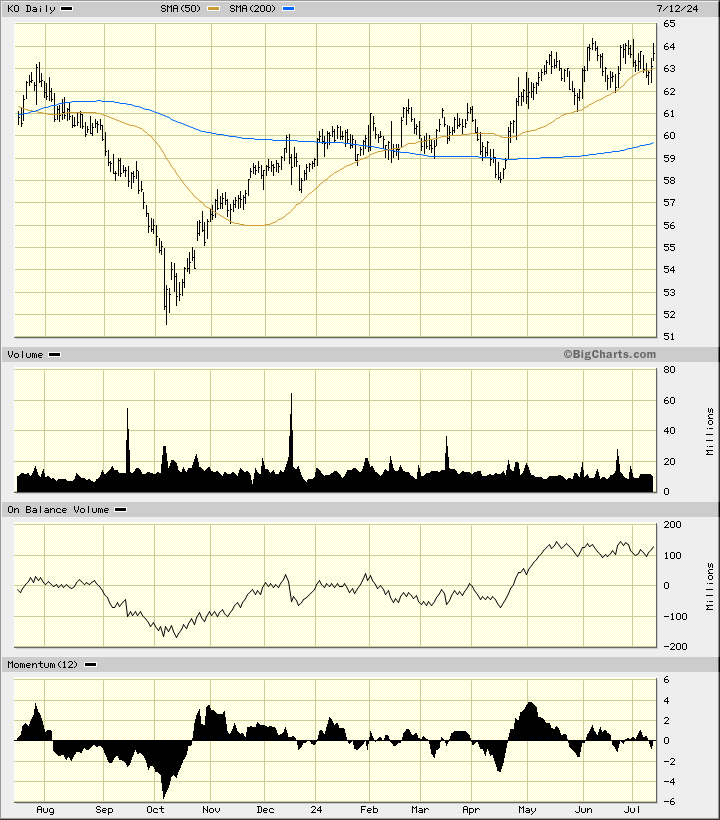
Coca-Cola KO has been bubbling higher but the stock is losing momentum since early May.
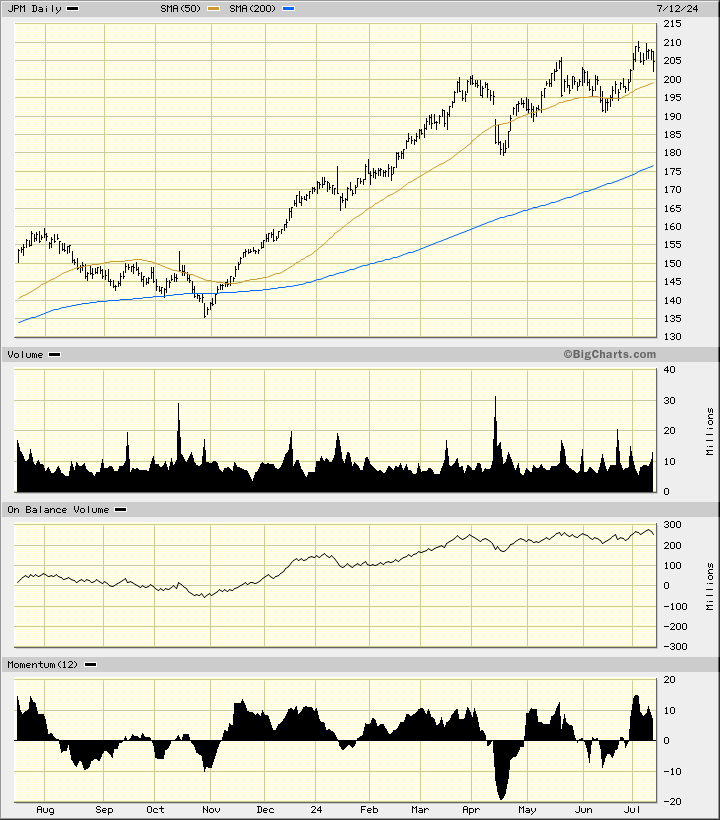
JP Morgan Chase JPM is considered by some market watchers as a leadership stock for the financial sector. Prices are trading above the rising 200-day moving average line and the OBV line is supportive but the momentum study shows a longer-term bearish divergence. Keep an eye on JPM going forward.
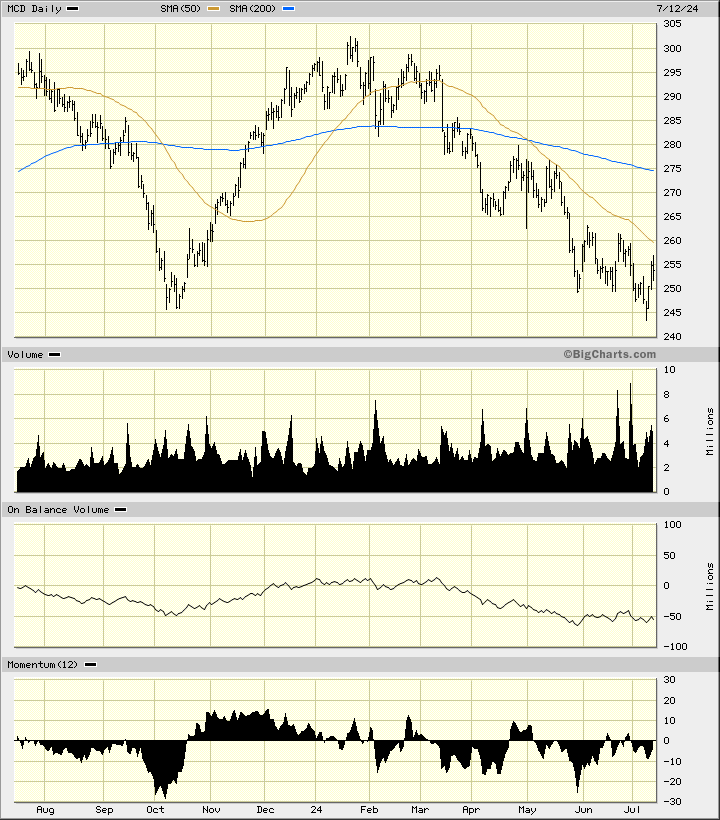
Some people love McDonald's Corp MCD but my current diet restricts my consumption of most of their menu items. Prices are trading below the declining 50-day moving average line and below the negatively sloped 200-day line. The trading volume has increased recently as traders appear to be voting with their feet. The OBV line is bearish and momentum has not yet turned positive.
In part 2, we'll check the rest of the stocks, starting with Honeywell HON, and continuing to Microsoft MSFT and on, and I'll give my verdict on the performance of the 30 names.
Employees of TheStreet are prohibited from trading individual securities.