Dow's Checkup Part 2: The Results
Here we look at the rest of the Dow names, including IBM, Microsoft, Walmart and more, stock by stock ... slope by slope.
You've reached your free article limit
You've read 0 of 1 free Pro articles.
In this second-part of our deep dive into the Dow, we'll inspect the rest of the index's stocks, starting with Honeywell HON and touching on Microsoft MSFT and more.
In part 1, we reviewed the first 15 stocks, including Amazon AMZN , Amgen AMGN, and McDonald's MCD. Remember, we're tying to determine the underlying health of the market by inspecting each stock in this key index. We're checking the slopes of the 200-day moving averages, how many stocks are trading above the rising 200-day line, and how many have a negative 200-day line and how many are neutral.
So let's get to it:
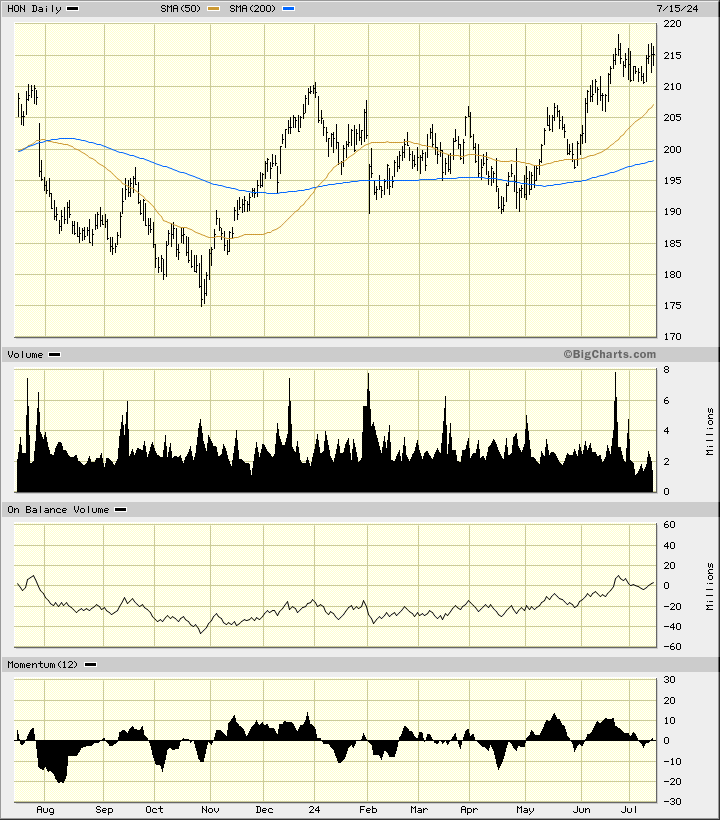
Honeywell HON has managed to move higher the past 12 months, but it has been a struggle. Prices are now trading above the rising 50-day moving average line and above the rising 200-day moving average line. The OBV line is rising with the price action but there is a developing bearish divergence with momentum stowing from May to June.
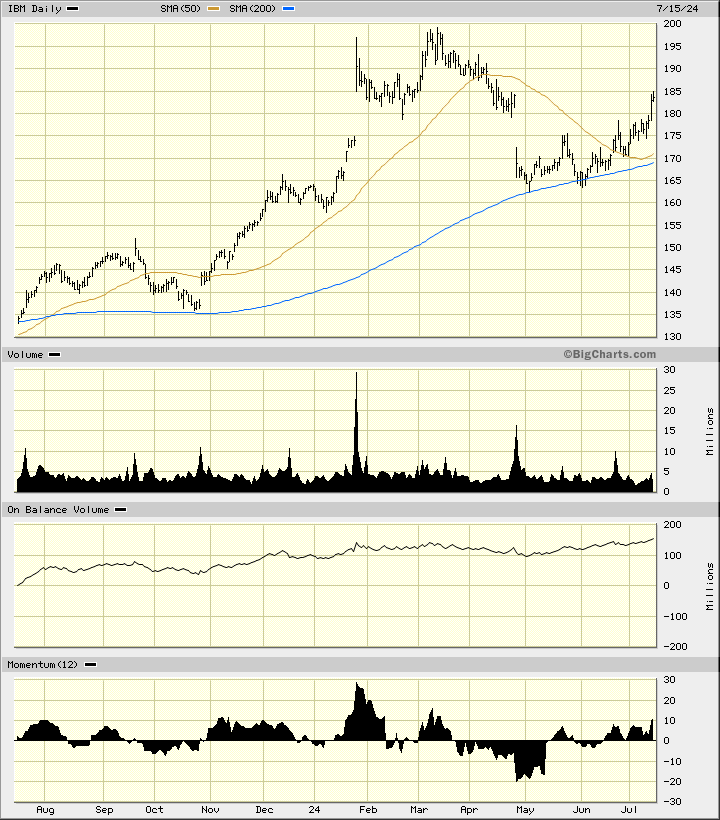
International Business Machines IBM rejoined the DJIA in 1979. Prices now trade above the rising 50-day moving average line and above the rising 200-day line. The OBV line is moving in the right direction, but the momentum study would keep me cautious.
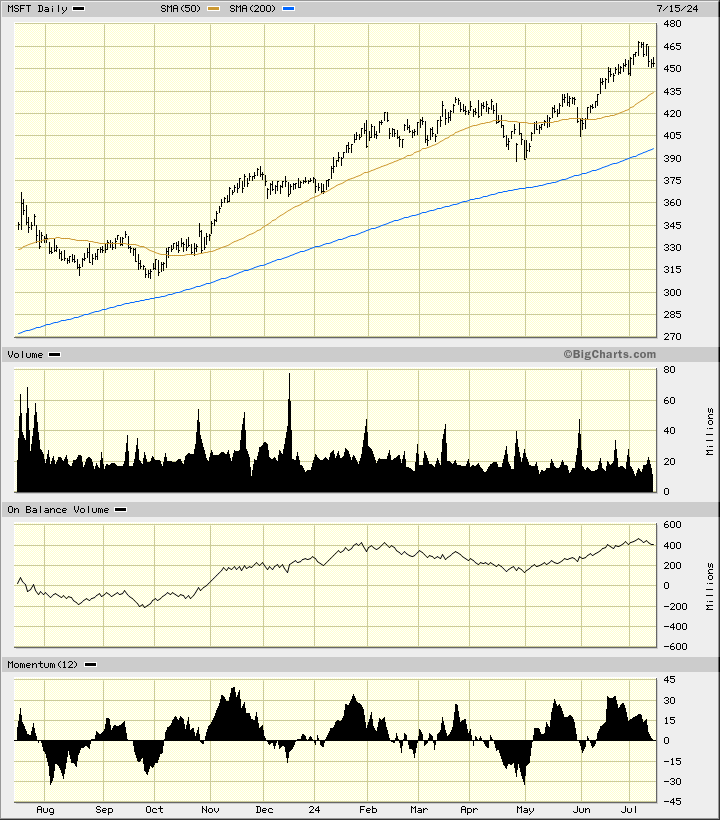
Microsoft MSFT has been a strong driver of gains for the DJIA in the past 12 months. MSFT trades above the rising 50-day average and the rising 200-day line. The OBV line has improved in recent months but has struggled to push clearly into new highs. The momentum study shows roughly equal highs in May and June, even though prices made higher highs. This is a bearish divergence and traders should watch this stock closer.
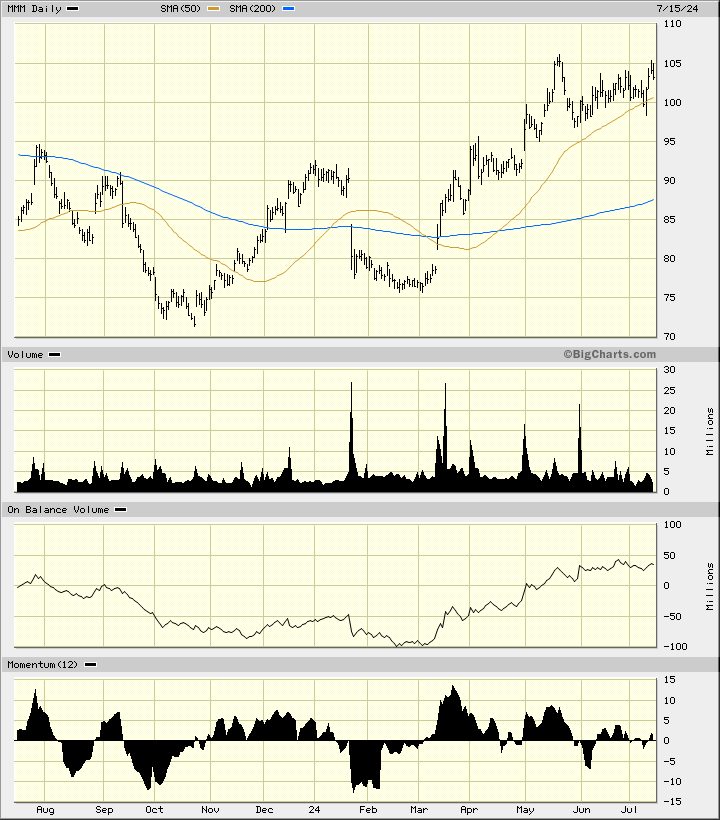
3M MMM gapped higher in March to start an uptrend, but beneath the surface the indicators like momentum tell us to be cautious. MMM trades above the rising 50-day moving average line and above the rising 200-day moving average line. The OBV line turned upwards in March to confirm the price gains but the line has turned sideways the past seven weeks. The 12-day price momentum study shows lower highs from March to May to June and July, even though prices have made higher highs. This is a bearish divergence and could be foreshadowing weaker prices ahead.
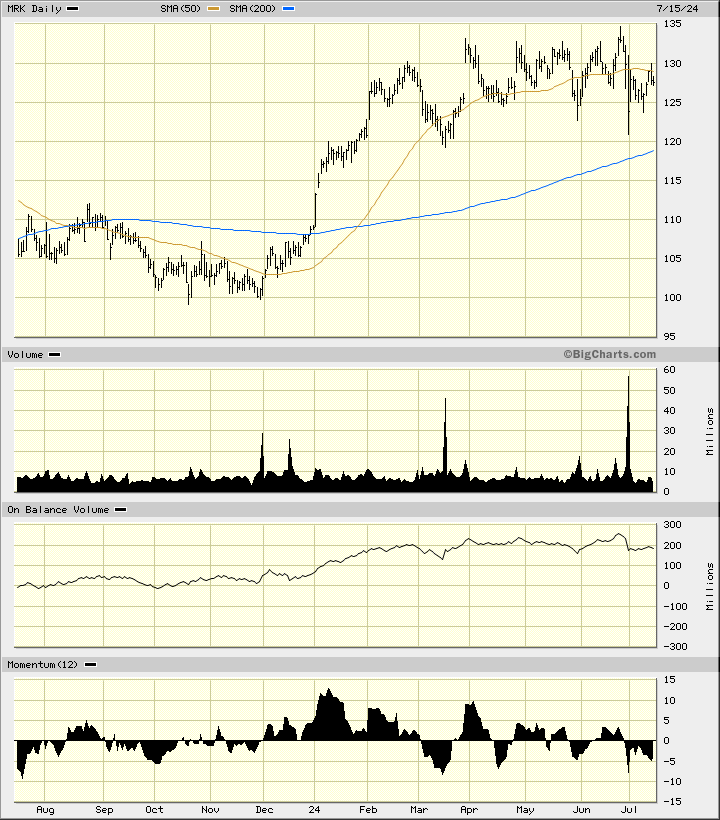
Merck & Co. MRK has been stalled in a sideways trend for several months now. Will prices turn higher and help lift the DJIA or will they retreat? Prices have been encountering resistance in the $130-$135 area. The OBV line has started to weaken and momentum is negative.
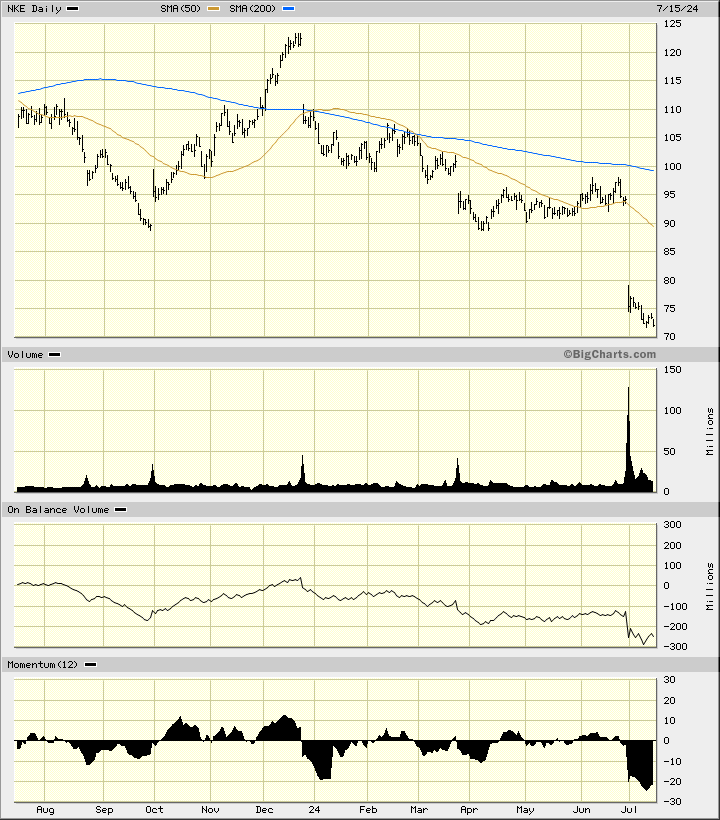
Nike NKE has dropped a shoe -- or many shoes -- in the past eight months. The trend in NKE is very weak and there are no signs of any bottoming action. NKE is likely to be a drag on the DJIA and I would consider it the weakest stock.
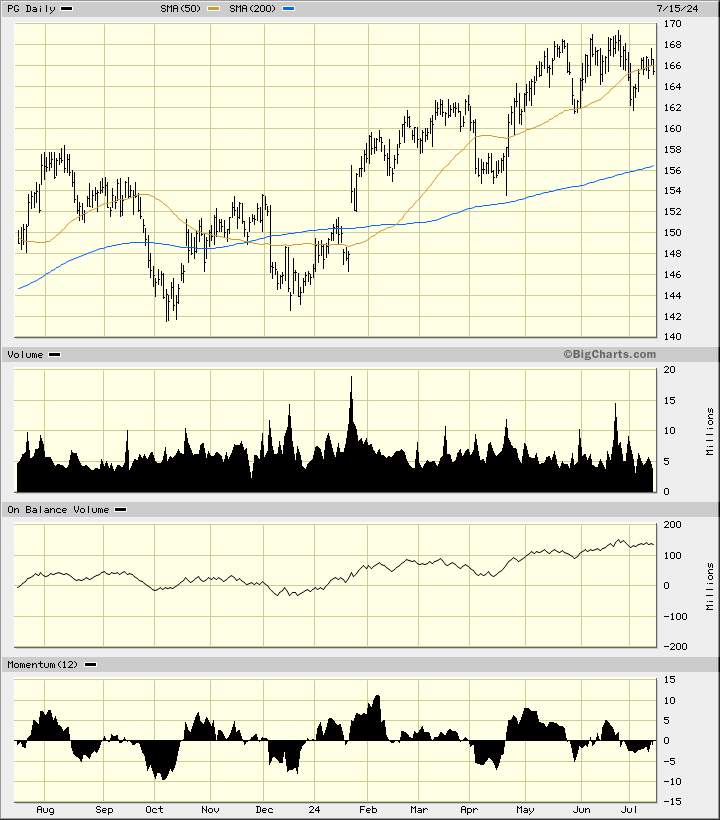
Everyone knows Procter & Gamble PG and many of their products that they use every day but not everyone is familiar with the stock and its indicators. Prices turned sideways in May. Trading volume looks like it has been shrinking since late June. The momentum shows weakness from May to June.
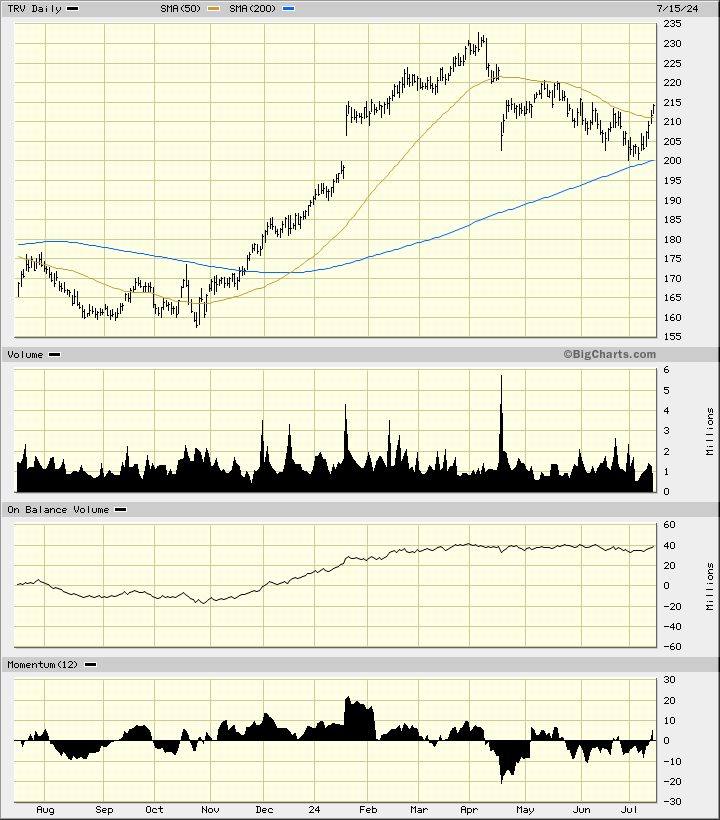
In full disclosure, my cars are insured with Travelers TRV, but I think I can remain objective. TRV has corrected to the downside from a high in early April. Prices got close to the rising 200-day line early this month and are now trading above the 50-day line. The OBV line has drifted down since early April. The momentum readings have been improving since April and we'll see how far that will carry prices.
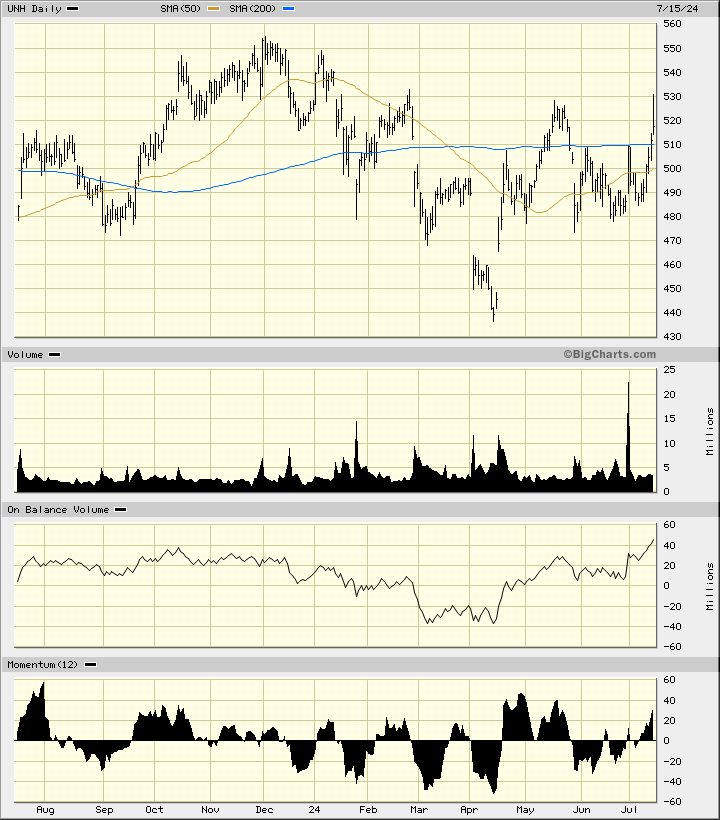
UnitedHealth Group UNH has had a choppy history with a decline from December to April followed by a stop and go rally into July. The OBV line made a decline and a rally in the past year. The momentum study has me confused.
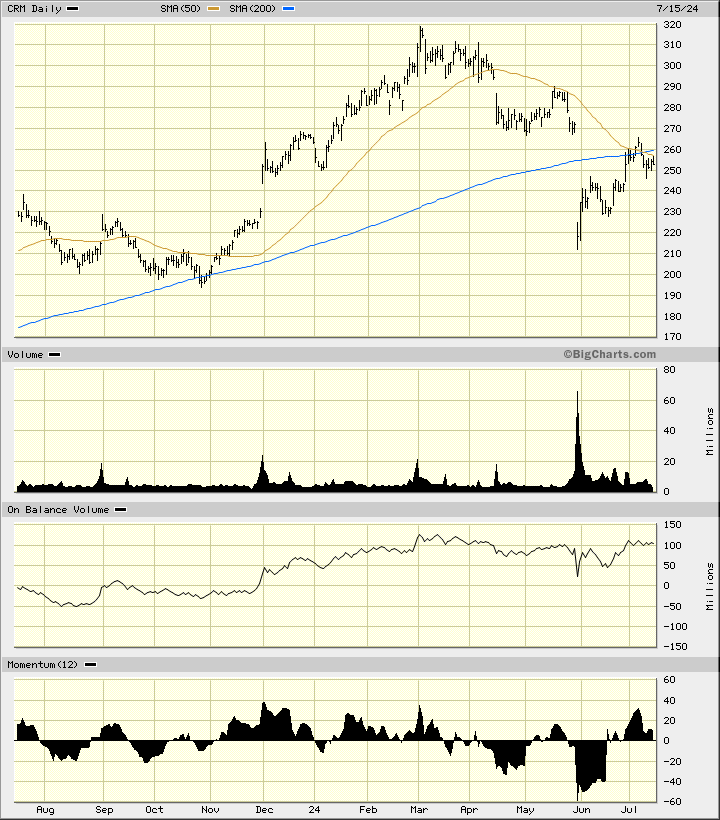
In this daily bar chart of Salesforce CRM I see a stock at a crossroad. Prices tumbled sharply lower from March and then reversed higher from late May with no real base building. Prices are trading below the cresting 200-day moving average line. The OBV line has struggled since early March.
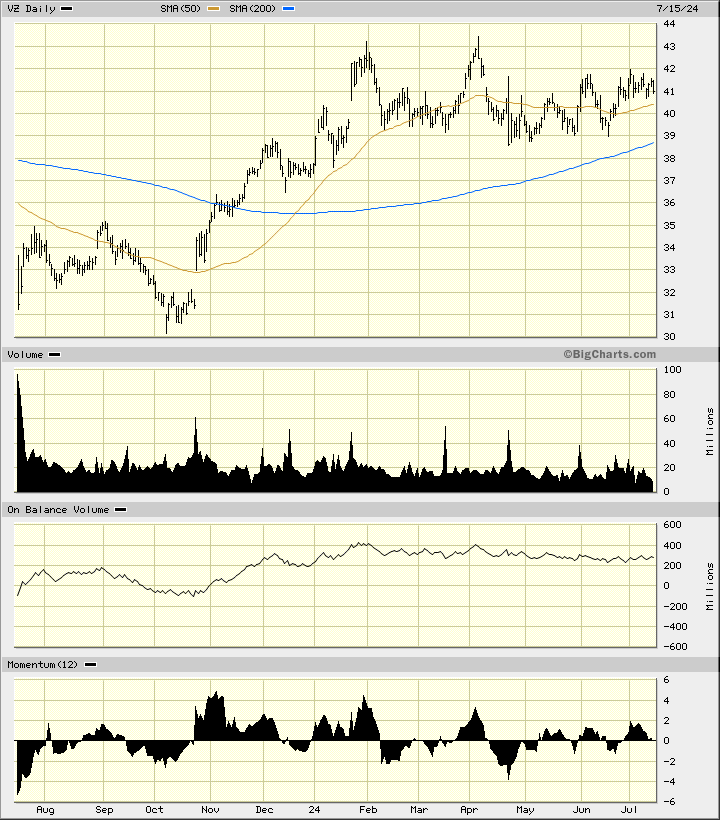
Ever get a spam call? Should we accept a call from Verizon VZ or block it? In this chart of VZ, below, I see a busy signal with prices largely trendless. VZ is trading above the rising 200-day moving average line, but I would rate the trend as flat or neutral.
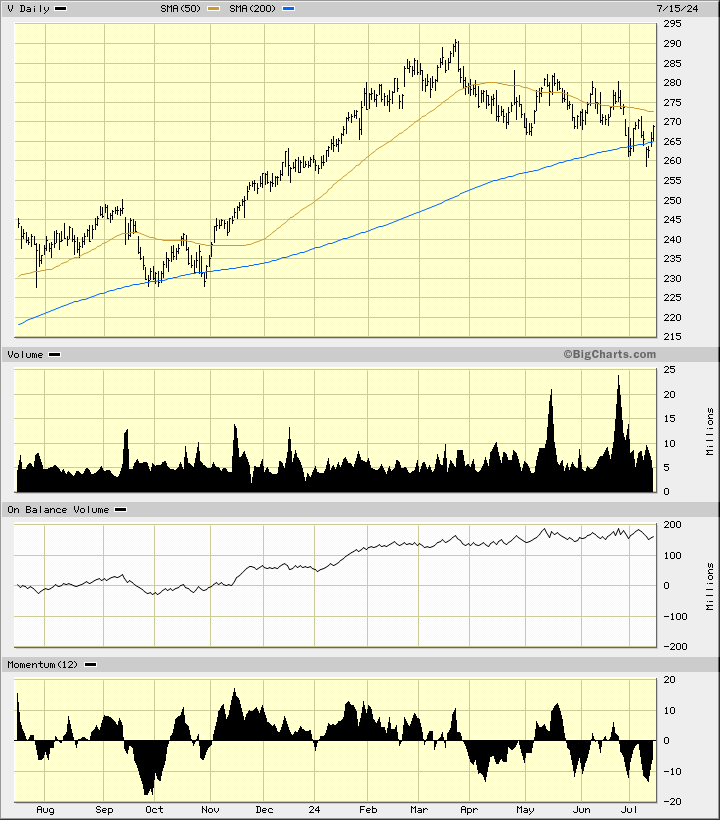
Visa V has weakened since late March and has been testing the 200-day moving average line. The OBV line is neutral and trading volume has not increased as prices test the 200-day line. The 200-day line can often act as support but trading volume is really needed to turn prices higher. V may need a bigger credit line.
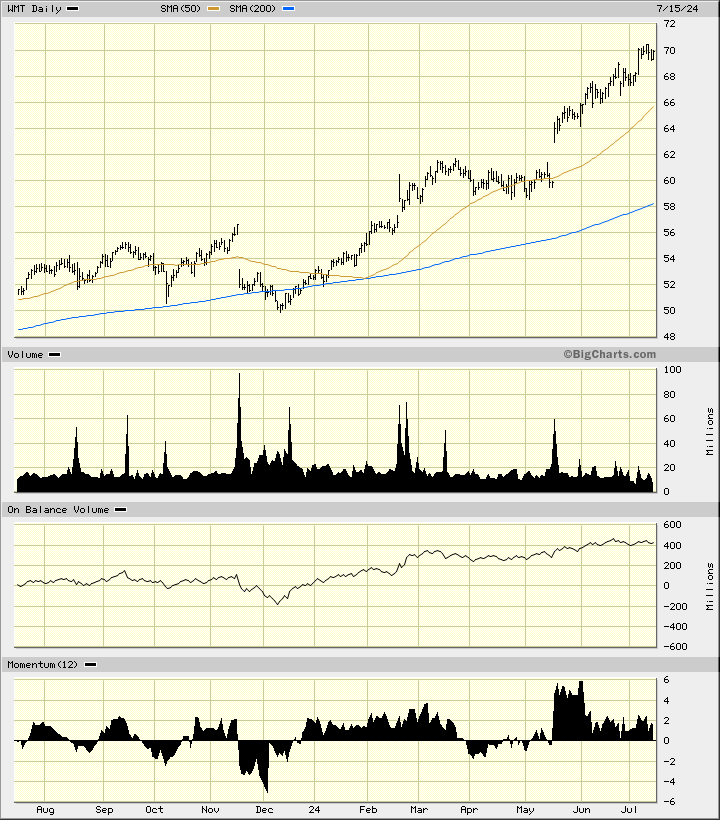
Walmart WMT has rallied since early December and volume has been active. The slopes of the 50-day and 200-day averages are both positive. The OBV line has started to level off and price momentum has weakened. Maybe the best gains for WMT are behind it?
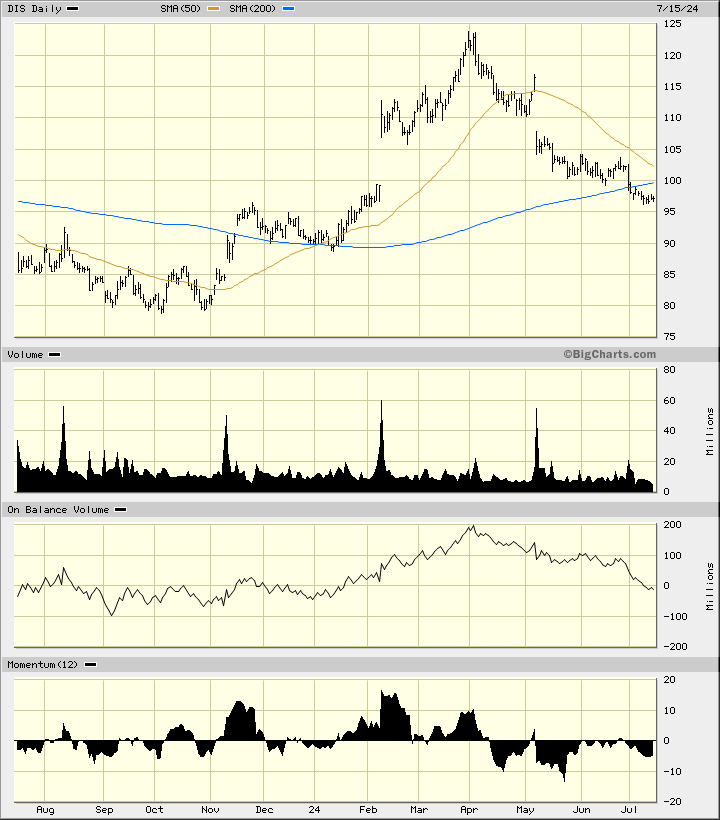
Walt Disney DIS had a proxy battle and rally until early April, but then the honeymoon was over and prices are now below the 50-day and the 200-day line, but the slope of the 200-day is still positive. The OBV line is pointed down but momentum is slowing.
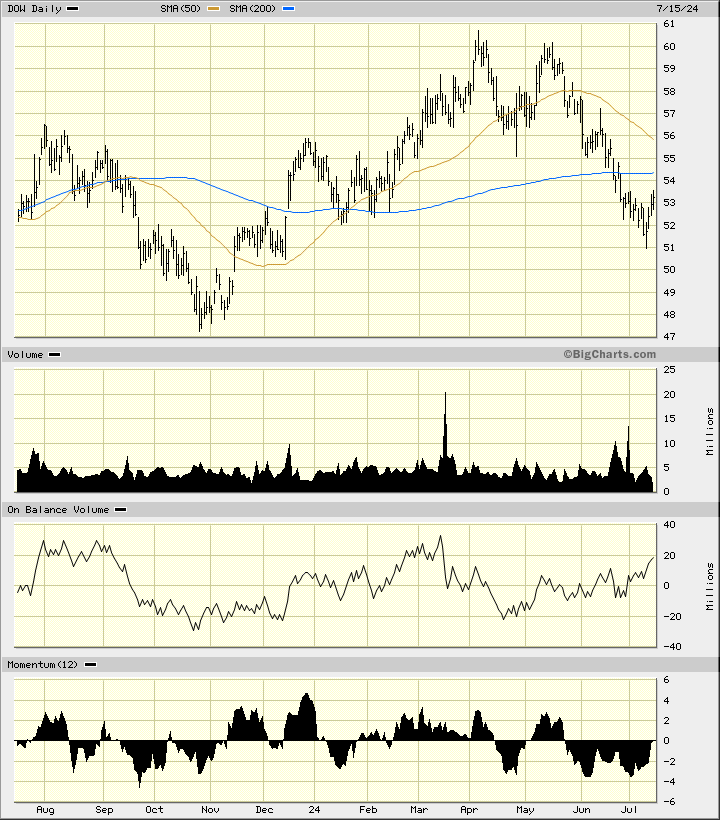
The charts of Dow Inc. DOW are weak but the indicators suggest we might get a bounce. DOW trades below the declining 50-day line and below the cresting 200-day line. The OBV line has improved in recent weeks and the momentum study shows equal lows while prices have declined. This is a type of bullish divergence.
Bottom line: Going stock by stock through the Dow, I rate 21 stocks as positive for now and nine stocks as neutral or bearish at this point.
With the markets capable of making "V" turns, anything could develop and shift a number of positive stocks to bearish and some of the bearish stocks to bullish.
Now Let's turn the page and look at the strongest Dow stock and the weakest. Maybe an idea for a pairs trade...
Employees of TheStreet are prohibited from trading individual securities.