CrowdStrike Can't Protect Itself From the Chart Action
The cybersecurity name posted earnings about a month after the tech outage. Let's see what the technicals are telling us.
You've reached your free article limit
You've read 0 of 1 free Pro articles.
Wednesday night CrowdStrike CRWD reported adjusted earnings per share of $1.04, which beat estimates by $0.07 and revenue of $963.87 million, which beat by $5.55 million. Normally this kind of news would point to higher share prices, but traders seemed to be concerned that the company slightly tweaked its full-year guidance in response to last month's global outage.
Or is it investors generally reducing their exposure to technology names?
Let's check the charts and indicators.
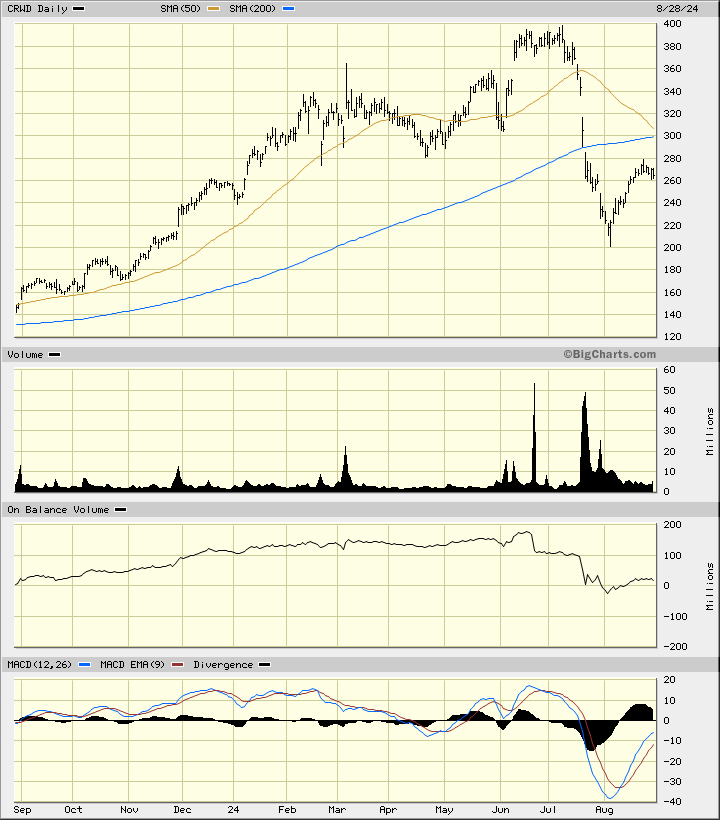
In this daily bar chart of CRWD, below, I can see the stock's plunge and modest/weak rebound. The bounce in CRWD stopped short of the underside of the cresting 200-day moving average line and short of a 50% rebound. I have noticed over the years that when a stock fails to recover more than 50% after a slide, it's a sign that the bears are still in control. Trading volume was light on the rebound telling me that investors did not view the price decline as a buying opportunity. The On-Balance-Volume (OBV) line has not rebounded and the Moving Average Convergence Divergence (MACD) oscillator is below the zero-line and starting to narrow as the rebound weakens.
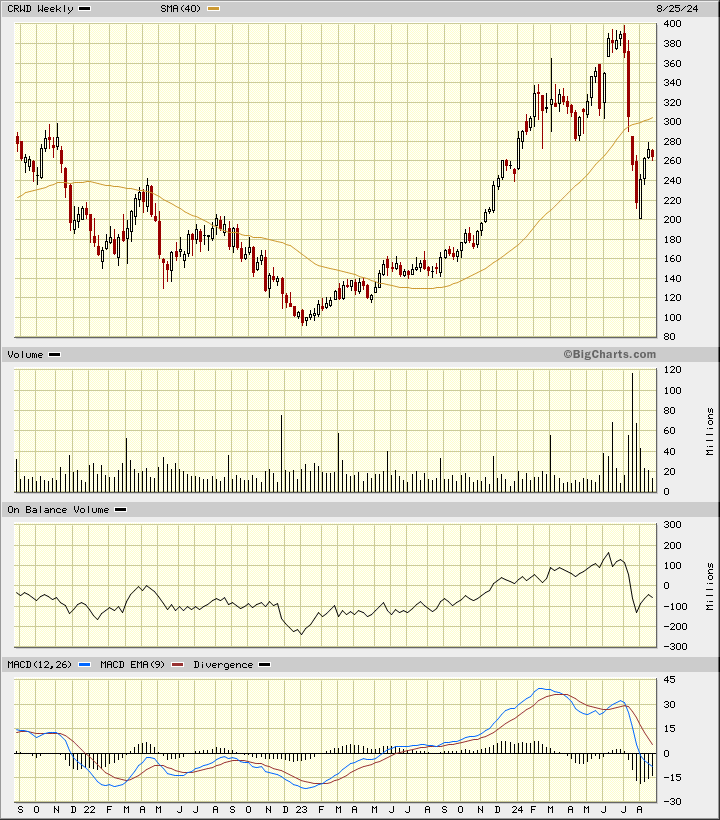
In this weekly Japanese candlestick chart of CRWD, below, I see that the two most recent candle patterns suggest we are looking at a top reversal -- an upper shadow on a relatively small real body followed by a bearish (red) candle.
The 40-week moving average line is rolling over. The weekly OBV line has been weak the past three months. The MACD oscillator has fallen below the zero-line for an outright-sell signal.
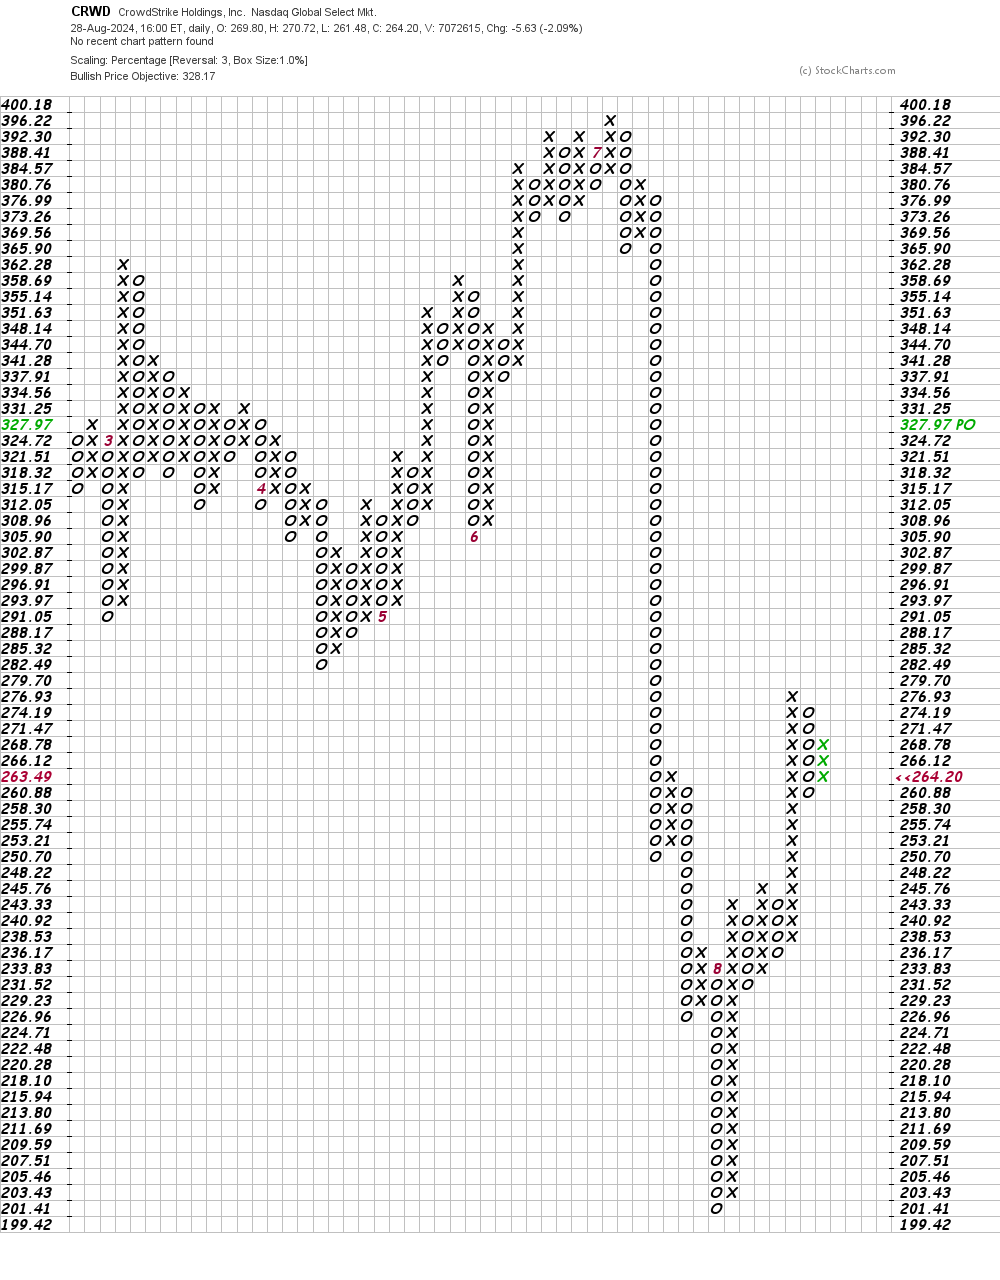
In this daily Point and Figure chart of CRWD, below, I can see that the software has projected an upside price target. A trade at $255 should start to weaken this chart.
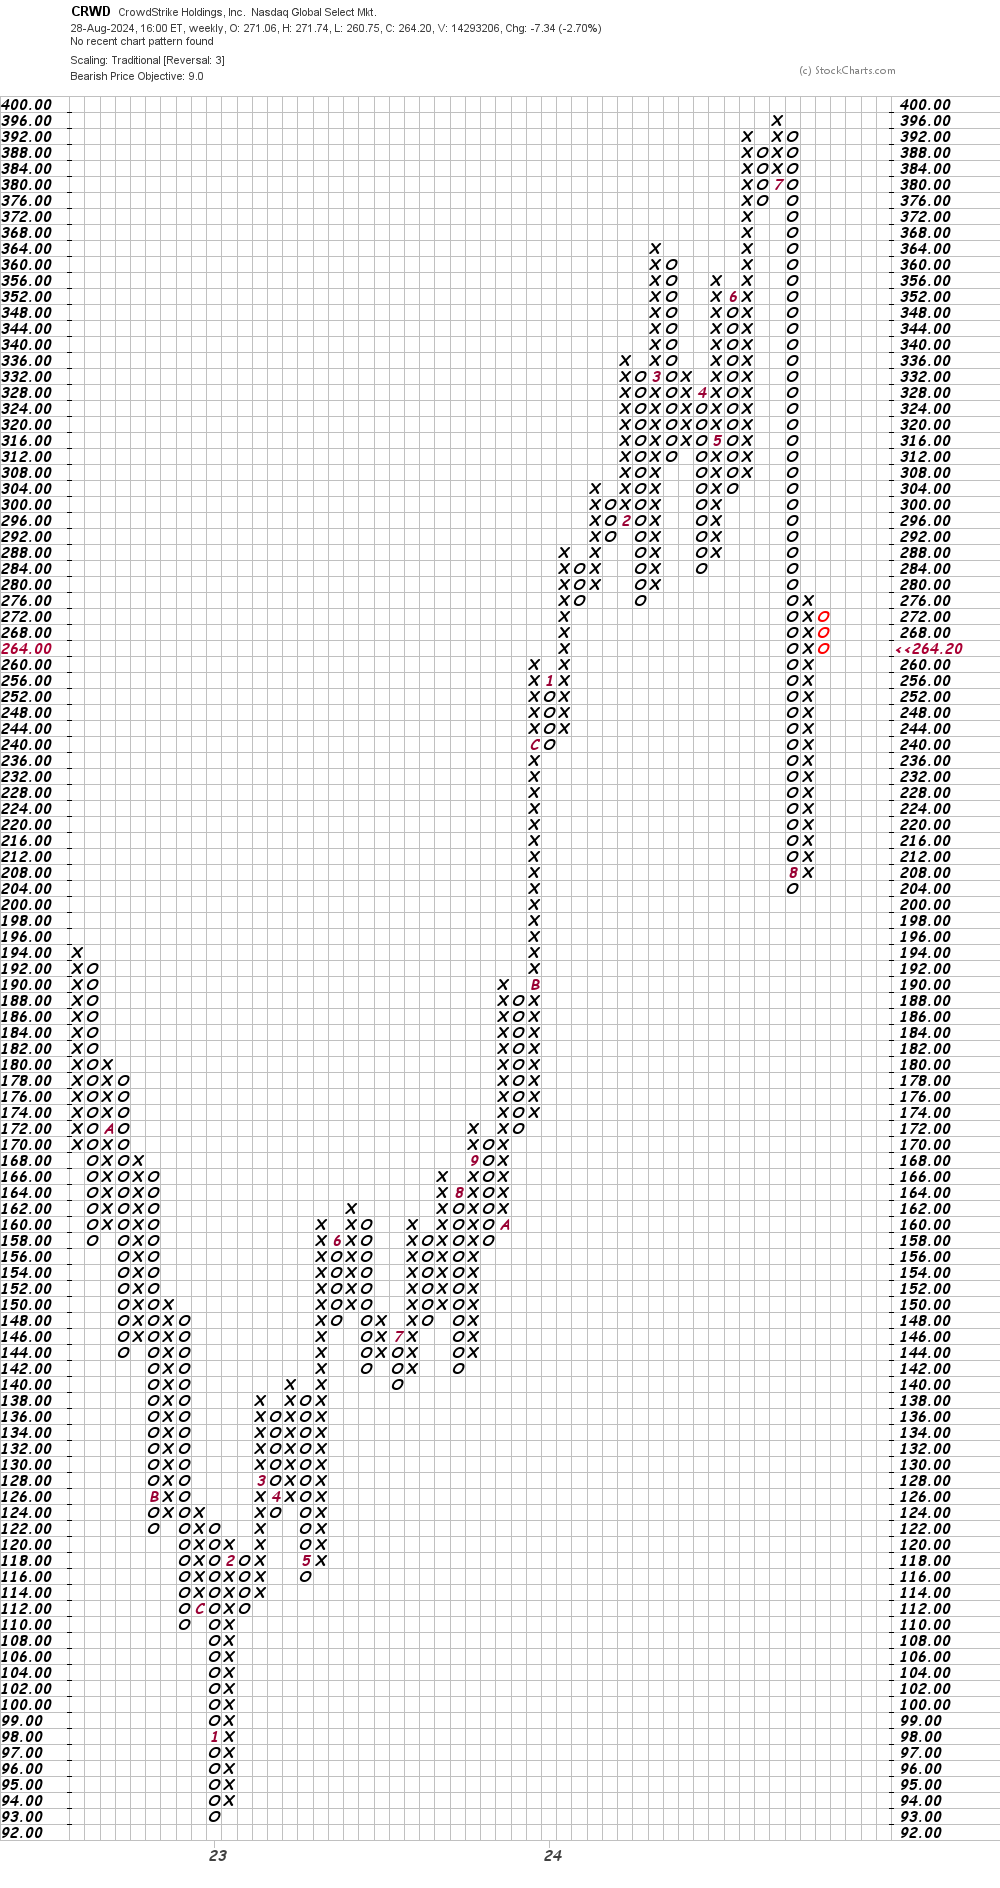
In this weekly Point and Figure chart of CRWD, below, the software gives us a very dramatic (and perhaps too bearish) price target of just $9. The direction may well be correct but this price target should probably be taken with a grain of salt.
Bottom line strategy: The rebound bounce in CRWD looks like it is over. The question now is, Are we only going to get a retest of the early August low, or have we started a new trend lower? Tell me what you think?
Employees of TheStreet are prohibited from trading individual securities.